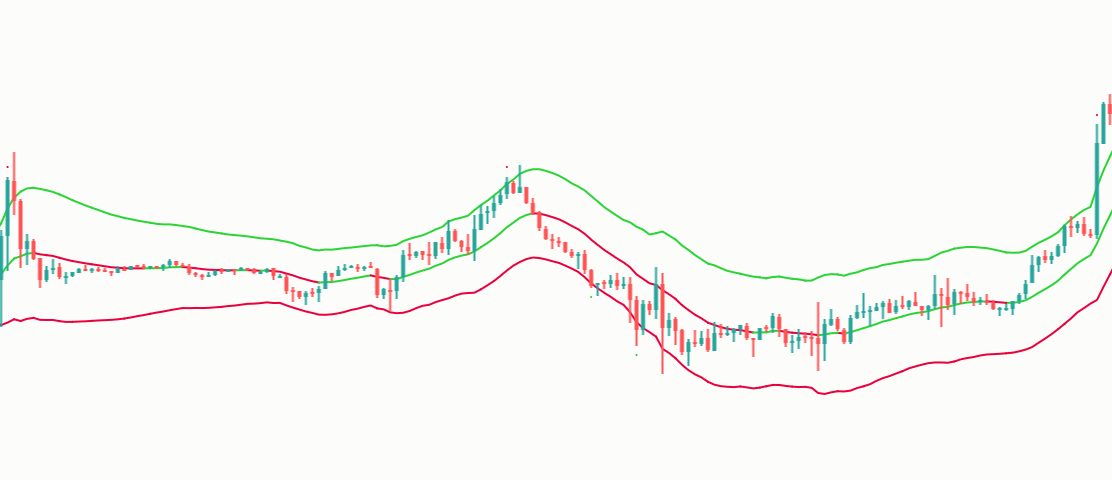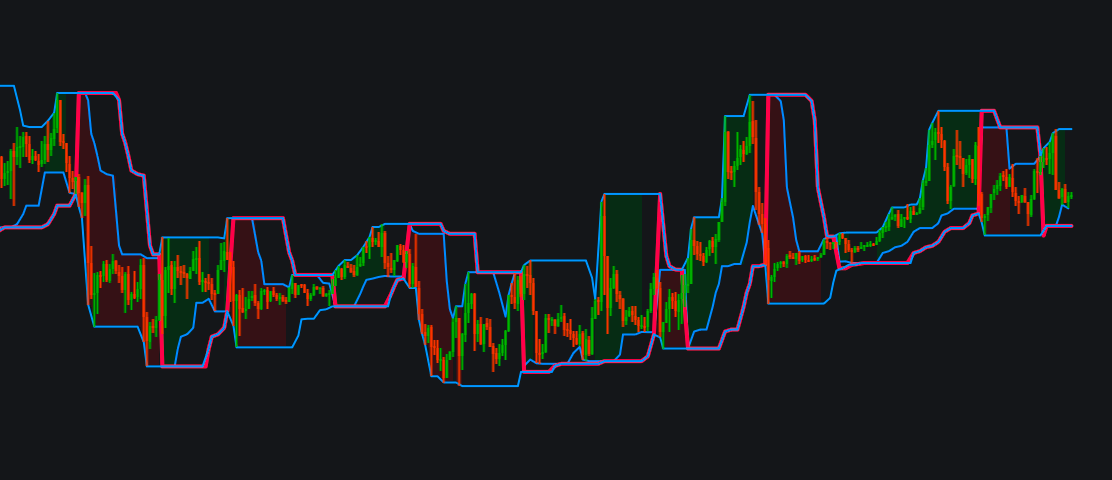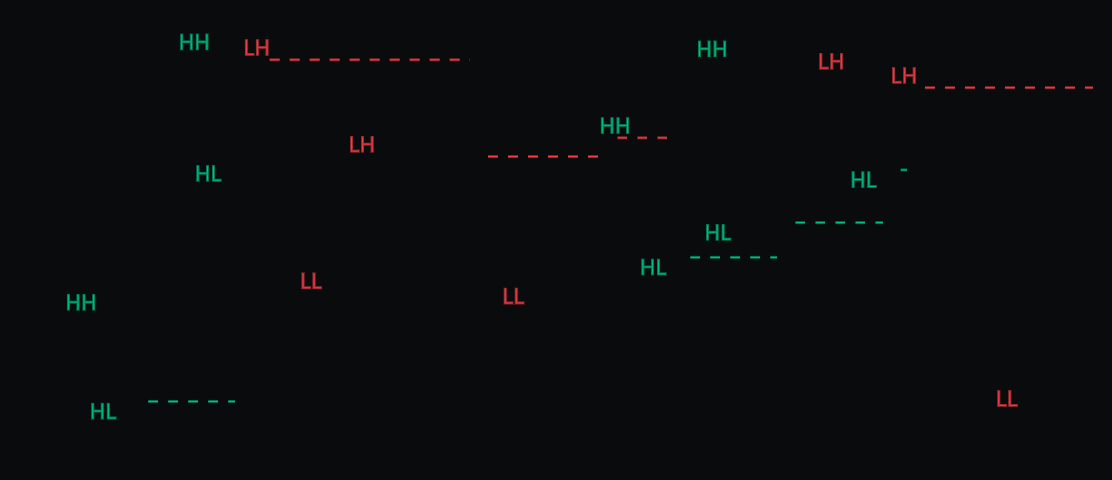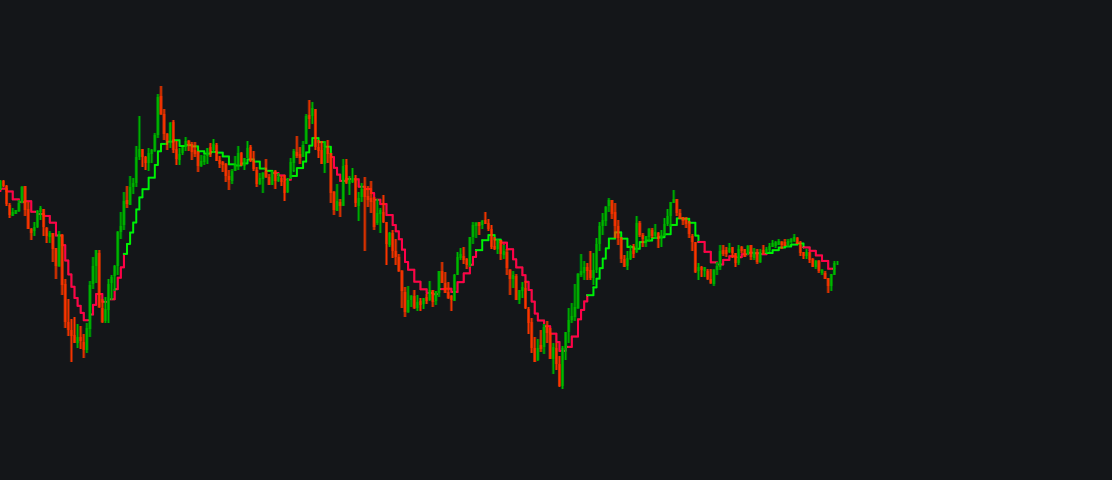
SM ENTRYimage
SM ENTRY
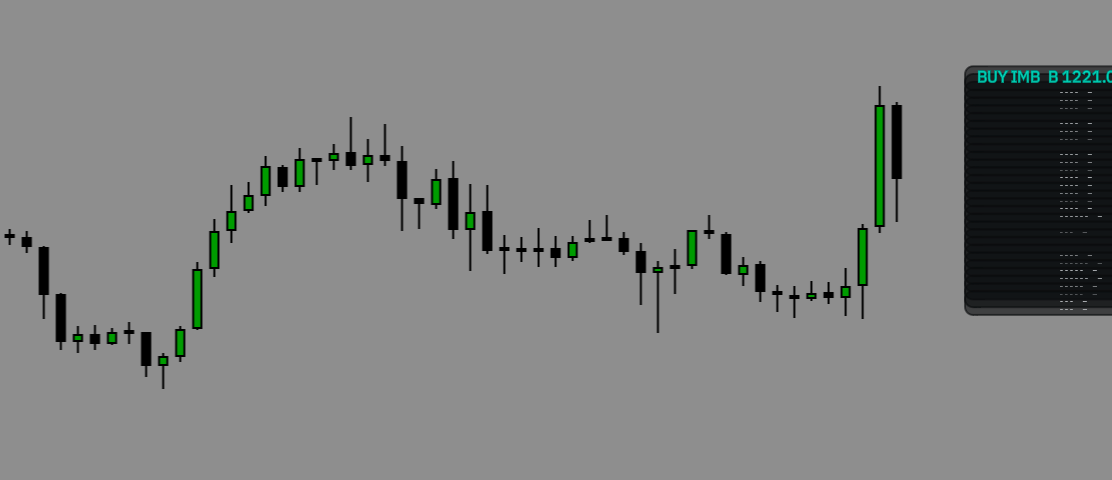
SM ENTRY - Precision entry signals with a flat-price filter Most indicators only tell you which way the market is going. SM ENTRY is built around a different question: when is the right moment to enter? It marks the exact candle where momentum shifts, an…
/indicator/sm-entry-59
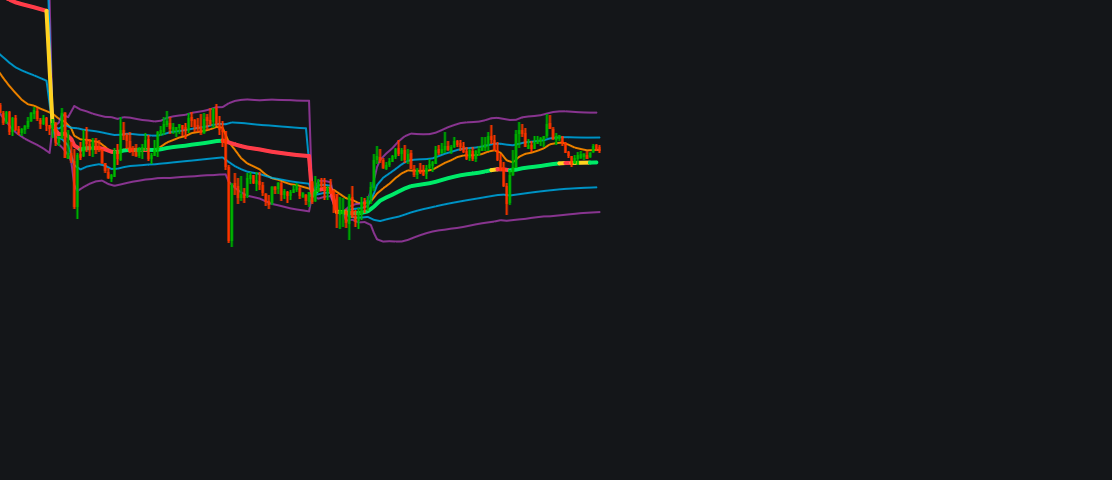
VWAP + SD Bands + EMA 20image
VWAP + SD Bands + EMA 20
Session VWAP + ±1/±2 SD Institutional Bands + EMA 20 is a clean, institutional-grade overlay indicator designed for intraday traders, scalpers, and trend followers across Gold (XAU/USD), Forex, Indices, and Crypto. KEY FEATURES: 1. Dynamic Trend-Biased S…
/indicator/vwap-sd-bands-ema-20-17
Jake Orderflow Profile — Imbalance & Zone Trackingimage
Jake Orderflow Profile — Imbalance & Zone Tracking
Jake Orderflow Profile displays a detailed, chart-anchored price ladder with estimated buy/sell volume, imbalance highlighting, and zone-entry tracking. Each row follows its price level as you scroll or zoom. Switching timeframes recalculates the profile…
/indicator/jake-orderflow-profile-imbalance-zone-tracking-73
Zalen Wave Oscillatorimage
Zalen Wave Oscillator
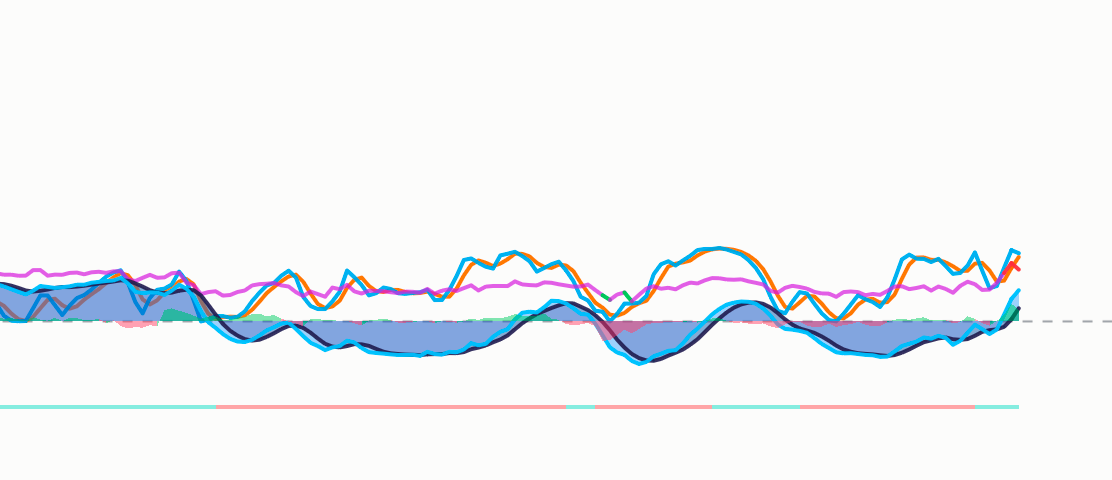
Zalen Wave Oscillator  is a momentum pane built around an adaptive wave engine. It is designed as the companion of Zalen WaveTrend Overlay: with Auto settings on, both use the same engine, so the dots in this pane land on the same candles as the Overlay'…
/indicator/zalen-wave-oscillator-67
Abu Laith Downtrend linesimage
Abu Laith Downtrend lines
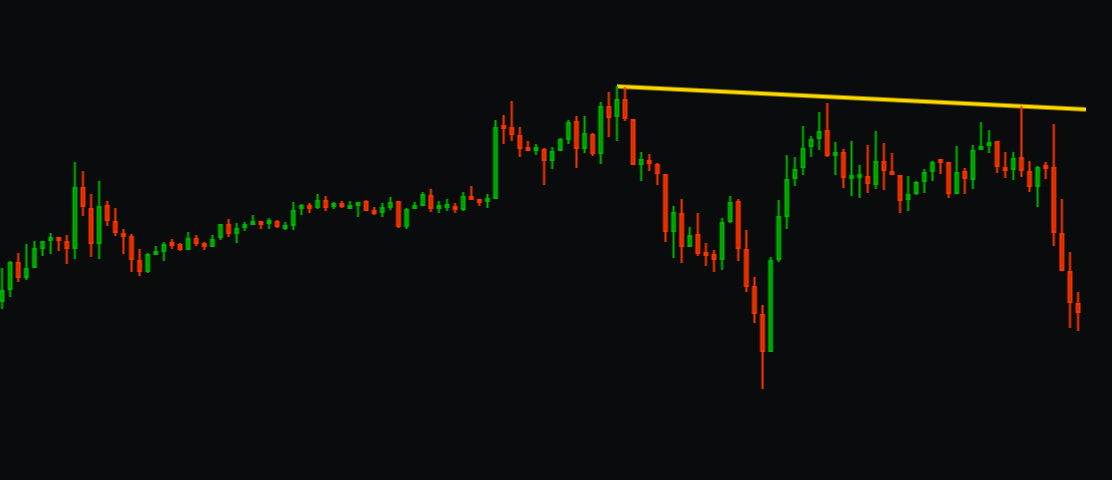
How to use it The line marks where sellers have been stepping in. A breakout means that pressure has eased. It is not a buy signal on its own. Combine it with your own analysis: trend, volume, support/resistance and market context. Works on stocks, ETFs…
/indicator/abu-laith-downtrend-lines-17
GasBuddyCryptoimage
GasBuddyCrypto
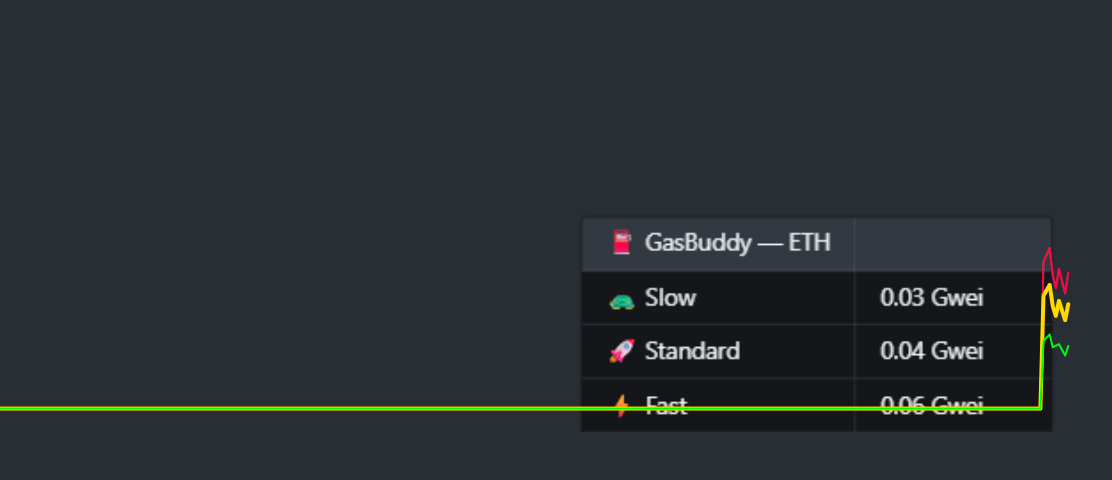
GasBuddyCrypto is a real-time gas tracker for 27 EVM blockchain networks. It displays current gas fees for Slow, Standard, and Fast transaction speeds directly on your chart, helping traders identify the most cost-effective moments to execute transaction…
/indicator/gasbuddycrypto-30
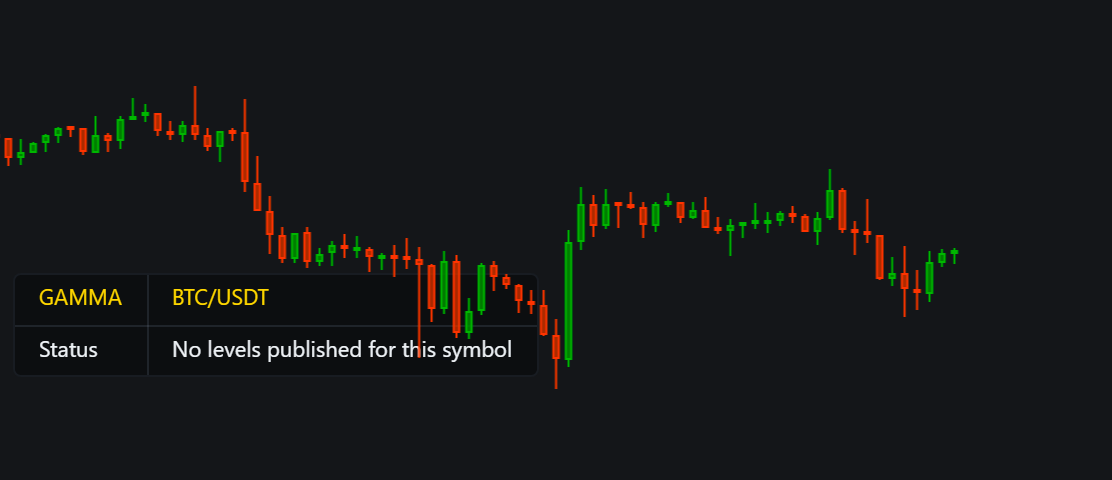
Gamma Levels image
Gamma Levels
Private indicator for invited users: it needs an access code from the author and shows nothing without one. It draws the analyst's liquidity centers for 41 instruments, highlights the strongest one, and labels rule-based CALL, PUT and exit signals on 5-m…
/indicator/gamma-levels-75
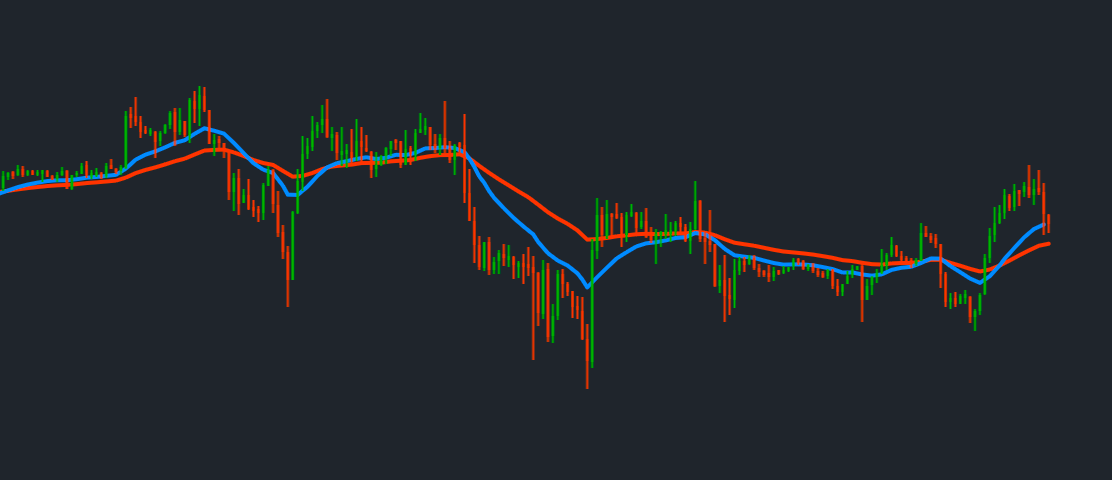
EMA 20 + EMA 50 (Free)image
EMA 20 + EMA 50 (Free)
A simple dual exponential moving average indicator combining EMA 20 and EMA 50 in a single chart indicator. EMA 20 is displayed in blue and EMA 50 in orange. Designed for swing trading and trend analysis, without additional signals or background shading.
/indicator/ema-20-ema-50-free-48
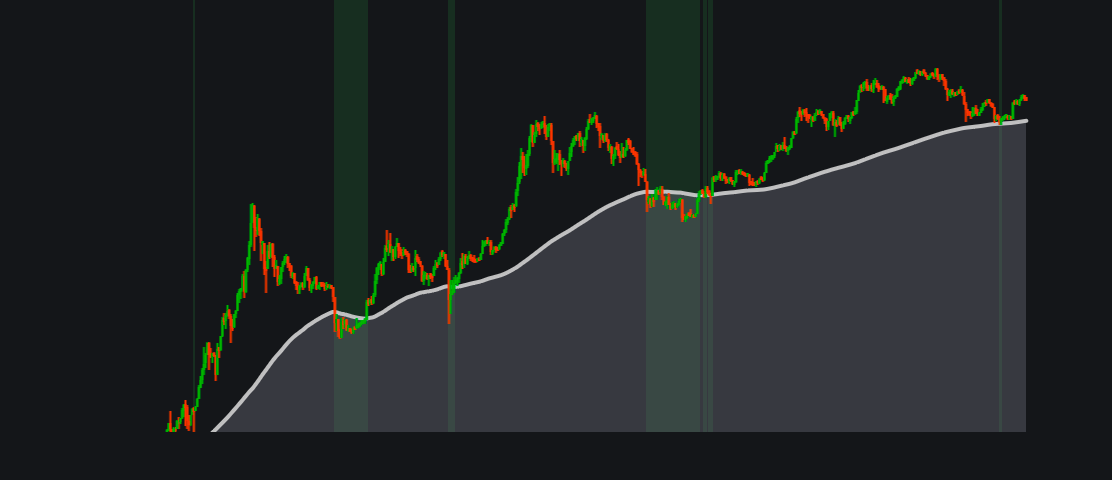
BTC Buy Zone [METIS]image
BTC Buy Zone [METIS]
BTC Buy Zone [METIS] The Best Place to Buy Bitcoin The indicator highlights an area on the chart where, historically, attractive conditions have emerged for building a long-term position in Bitcoin. It helps assess the current price in the context of the…
/indicator/btc-buy-zone-metis-71
AbsorbX — Footprint Absorption & Exhaustionimage
AbsorbX — Footprint Absorption & Exhaustion
AbsorbX — Footprint Absorption & Exhaustion AbsorbX reads TakeProfit's native Volume Footprint (buy/sell volume and trade counts at every price row) and flags two classic order-flow events directly on your chart: absorption and exhaustion . Signals AB…
/indicator/absorbx-footprint-absorption-exhaustion-55
Nadaraya Watsonimage
Nadaraya Watson
The  Nadaraya-Watson  is a dynamic technical analysis tool designed to identify market trends, extreme price levels (overbought/oversold conditions), and potential trend reversals. By plotting smoothed upper and lower dynamic boundaries around price acti…
/indicator/nadaraya-watson-1
Turtle Trade Channels (TuTCI)image
Turtle Trade Channels (TuTCI)
Turtle Trade Channels (TuTCI) is a breakout trend-following indicator based on the classic Turtle Trading rules. It plots a 20-bar high/low channel for entries, a 10-bar channel for exits and a trend line, and marks Long Entry, Short Entry, Exit Long and…
/indicator/turtle-trade-channels-tutci-11
Abu Laith Swing Structureimage
Abu Laith Swing Structure
Abu Laith Swing Structure  reads the swing structure of any chart and answers two questions at a glance: which way is the trend, and at what price is it proven wrong. It works on stocks, ETFs, crypto, forex and low-priced stocks, on any timeframe. How it…
/indicator/abu-laith-swing-structure-60
The Signal by Abu Laith – Trend, Exhaustion & Multi-Timeframe Zonesimage
The Signal by Abu Laith – Trend, Exhaustion & Multi-Timeframe Zones
The Signal by Abu Laith combines trend direction, key price zones and exhaustion warnings in one overlay, so you can answer three questions on any chart: What is the trend? Where are the important levels? Is the move getting tired? WHAT IT SHOWS 1. Lait…
/indicator/the-signal-by-abu-laith-trend-exhaustion-multi-timeframe-zones-81
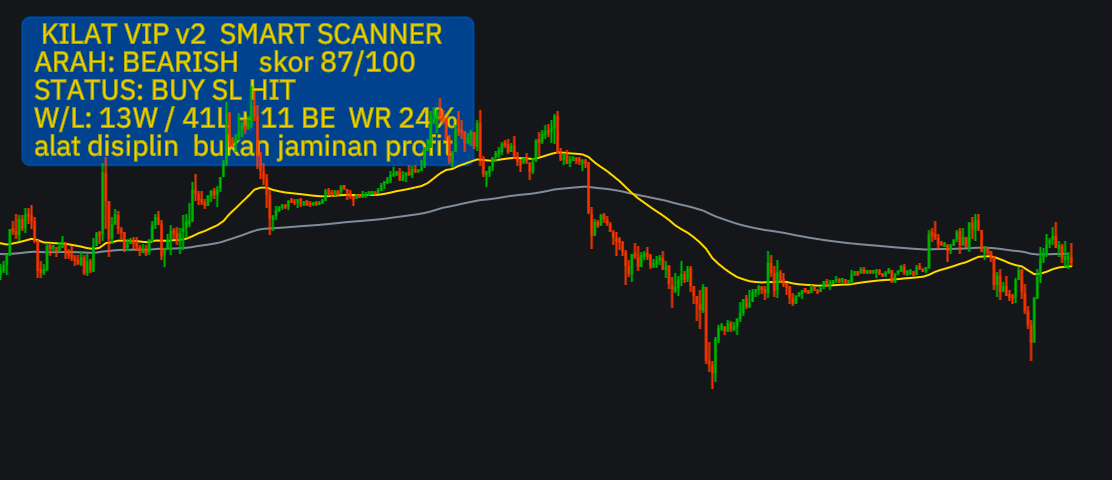
KILAT VIP v2 — SMART SCANNER 1.6image
KILAT VIP v2 — SMART SCANNER 1.6
KILAT VIP v2 — Smart Scanner by ICT Macro VIP Algo Systems A precision confluence scanner built for Gold, Forex, Indices and Crypto — now on TakeProfit. KILAT VIP v2 blends 6 weighted factors into a single 0–100 confluence score, so you only look at se…
/indicator/kilat-vip-v2-smart-scanner-1-6-17