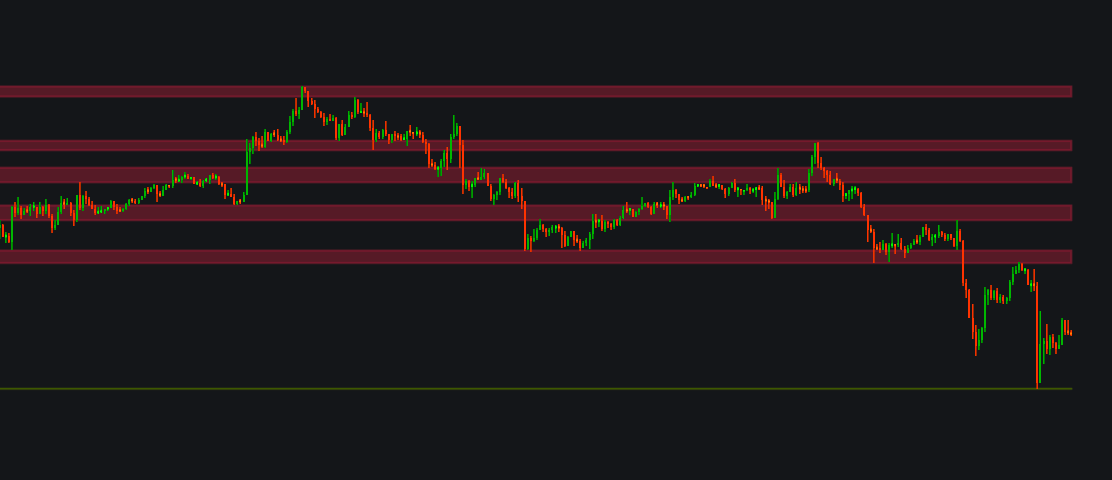
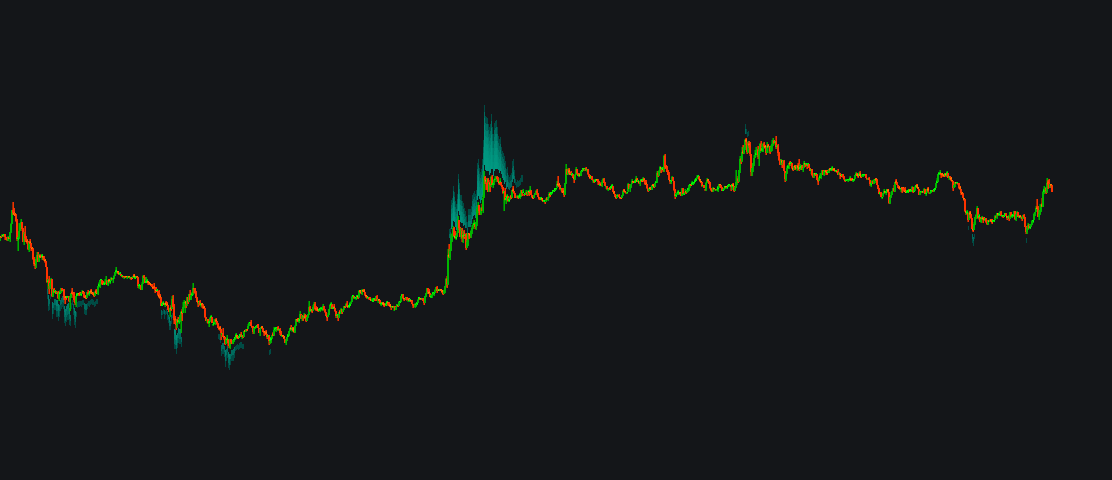
Community Indicators

Community Indicators

Bull Bear Power 50% alertimage
Bull Bear Power 50% alert
Bull Bear Power indicator using EMA to detect trend strength and generate alerts when price reaches 50% of the projected movement, helping traders identify potential entry and reversal zones with improved timing and market momentum analysis.
/indicator/bull-bear-power-50-alert-13
CVD + Volume Deltaimage
CVD + Volume Delta
Delta Volume + CVD Heatmap This indicator combines Volume Delta , Cumulative Volume Delta (CVD) , and relative intensity analysis to identify buying or selling dominance in the market. The Delta is calculated as the estimated difference between buying …
/indicator/cvd-volume-delta-47
kaufman Adaptive Moving Average dual KAMAimage
kaufman Adaptive Moving Average dual KAMA
# Kaufman Adaptive Moving Average (Dual KAMA) – Free Indicator A dual adaptive moving average system that tracks both short‑term and long‑term trends. The indicator plots two KAMA lines (Fast and Slow) and colors candles based on their relative position.
/indicator/kaufman-adaptive-moving-average-dual-kama-59
Linear Regression Slopeimage
Linear Regression Slope
The Linear Regression Slope (LRS) is a momentum oscillator that measures the direction and strength of a trend. Calculated using a least-squares "line of best fit" for a specific time period, it yields a numerical value that represents the average rate o…
/indicator/linear-regression-slope-57
Price Momentum Oscillatorimage
Price Momentum Oscillator
The Price Momentum Oscillator (PMO)  is a technical analysis tool that measures the rate of change in an asset's price, smoothed twice with moving averages. It is primarily used to identify trend direction, signal potential buy/sell crossovers, and pinp…
/indicator/price-momentum-oscillator-28
Micah's Oscillatorimage
Micah's Oscillator
A multi-layer momentum & confluence system for high-conviction timing OVERVIEW Micah's Oscillator is an all-in-one momentum oscillator that combines six classic edge-finding techniques into a single, color-coded pane — so instead of stacking five separat…
/indicator/micah-s-oscillator-97