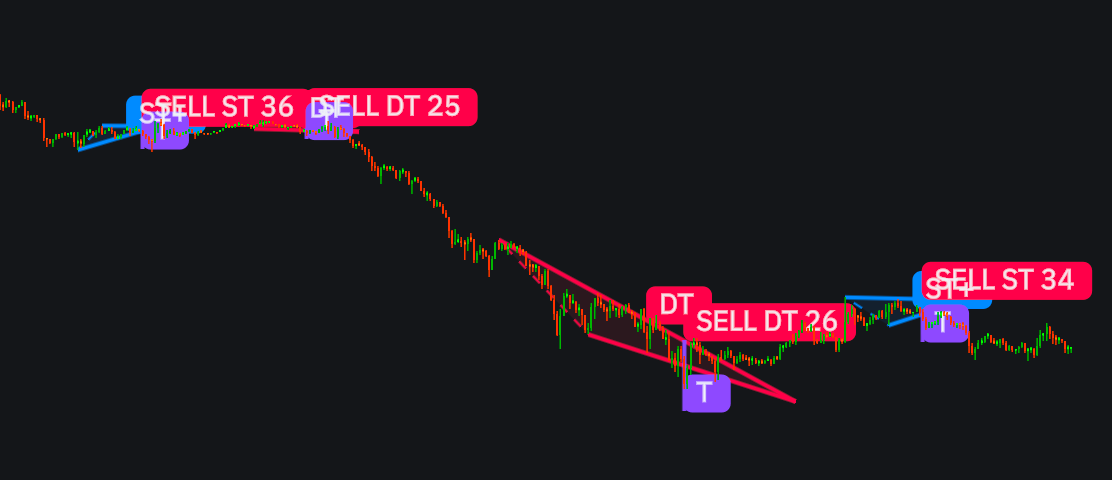
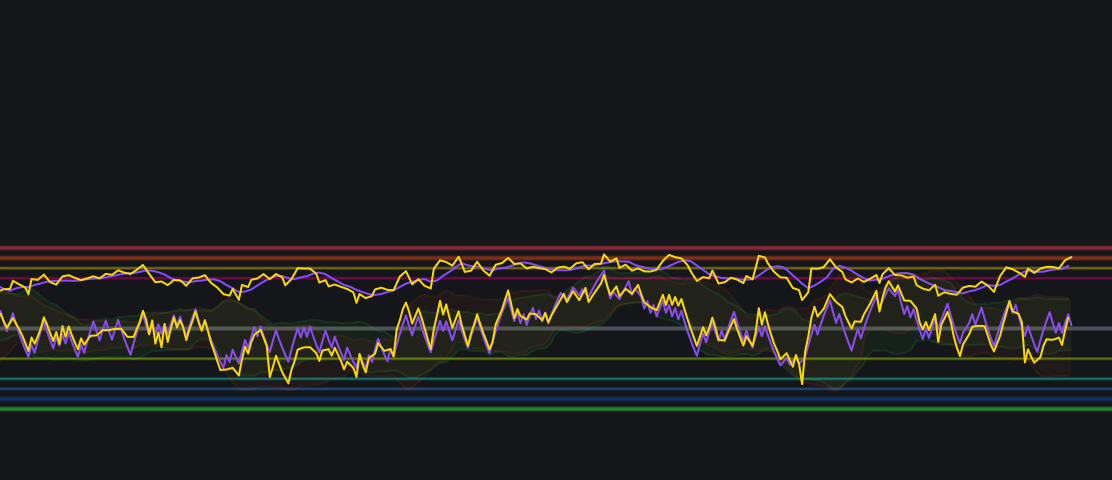
MACD 4C Line — 4-Color MACDimage
MACD 4C Line — 4-Color MACD
MACD 4C Line — 4-Color MACD Line with Momentum Phase Visualization MACD 4C Line is a clean, 4-color  MACD implementation for Indie that applies momentum phase logic to a classic line-based MACD display. This version is designed for traders who prefer t…
/indicator/macd-4c-line-4-color-macd-15
Trend Line Methods (TLM) — Indie versionimage
Trend Line Methods (TLM) — Indie version
Trend Line Methods (TLM) is a professional trendline and channel construction indicator designed for traders who rely on structure, slope, and market geometry rather than lagging oscillators. The indicator provides two complementary analytical methods…
/indicator/trend-line-methods-tlm-indie-version-61
Classic Ultimate MA MTF (CM Style)image
Classic Ultimate MA MTF (CM Style)
Ultimate Multi-Timeframe Moving Average (MTF MA) Ultimate Multi-Timeframe Moving Average is a flexible technical indicator that allows traders to analyze price trends using multiple types of moving averages and multiple timeframes within a single chart.
/indicator/classic-ultimate-ma-mtf-cm-style-91
Tether Lineimage
Tether Line
The Tether Line indicator  is a technical analysis tool primarily used as a dynamic baseline to identify market trends and support/resistance levels. Named because prices tend to "tether" or cluster around it, the indicator calculates the midpoint betwe…
/indicator/tether-line-6
Andean Oscillatorimage
Andean Oscillator
The Andean Oscillator (originally created by Alex Grover) is a technical indicator that tracks upward and downward price momentum. It separates bullish and bearish pressure rather than combining them into a single line, and is highly favored in trading e…
/indicator/andean-oscillator-79
Trend Intensity Indeximage
Trend Intensity Index
The Trend Intensity Index (TII) measures the strength and direction of a prevailing market trend. Ranging from 0 to 100, a value above 50 indicates a bullish trend, while a value below 50 indicates a bearish trend. Traders use it to confirm trends and sp…
/indicator/trend-intensity-index-9