
ATR Super Trend: Multi-Source
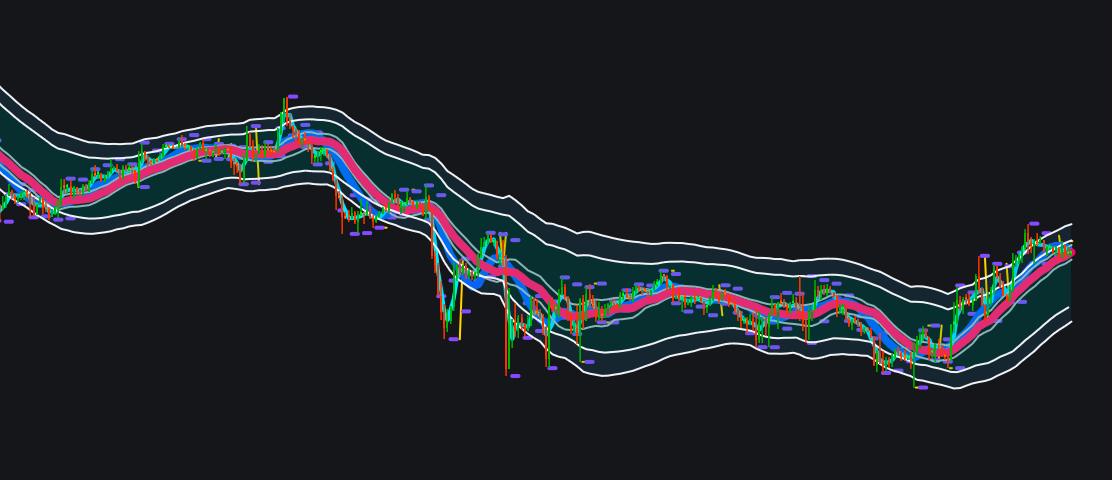
Overview Welcome to the ultimate adaptation of the classic trend-following indicator. Inspired by the legendary Supertrend algorithm, this enhanced version brings professional-grade flexibility and precision to your charts. While most standard ports lock…
Overview Welcome to the ultimate adaptation of the classic trend-following indicator. Inspired by the legendary Supertrend algorithm, this enhanced version brings professional-grade flexibility and precision to your charts. While most standard ports lock…