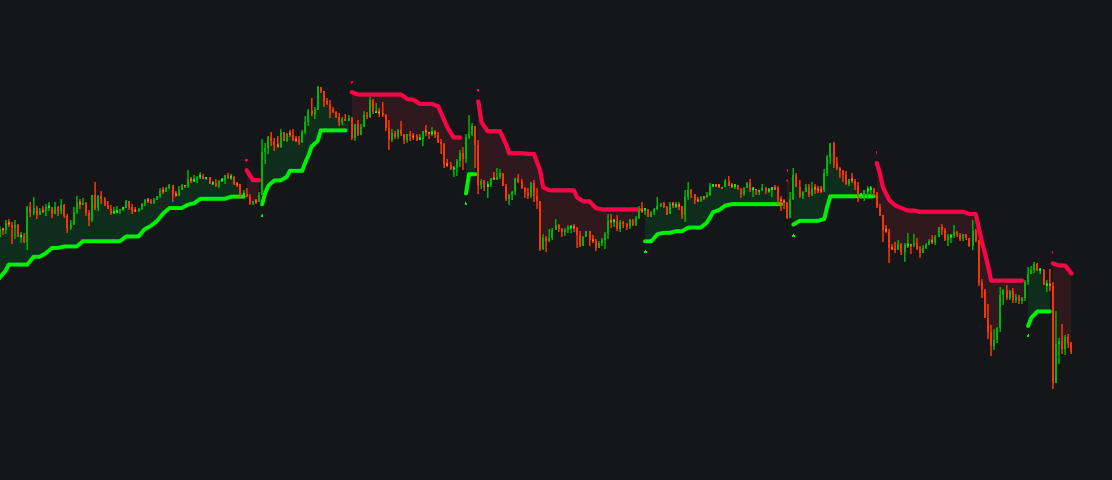

DW Range Filter (B&S Signals)
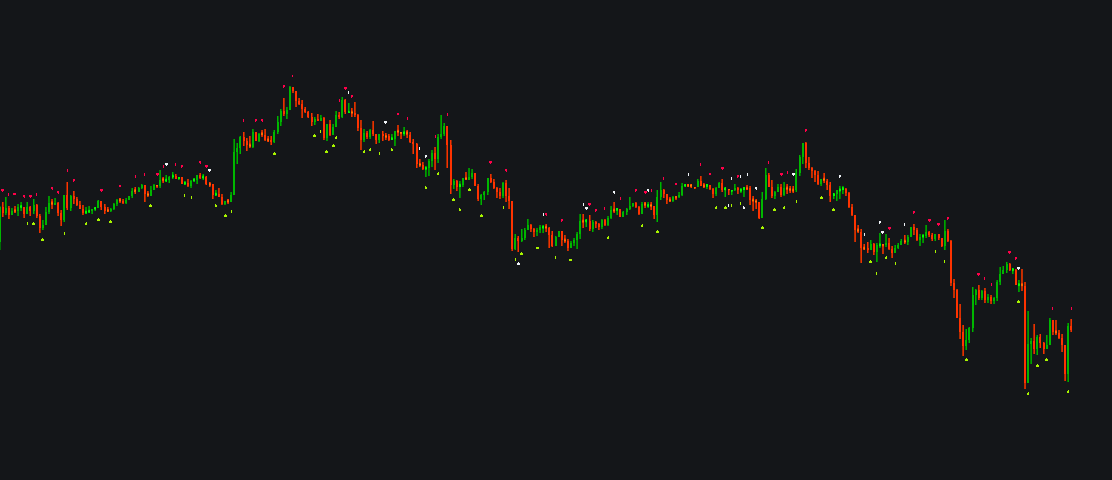
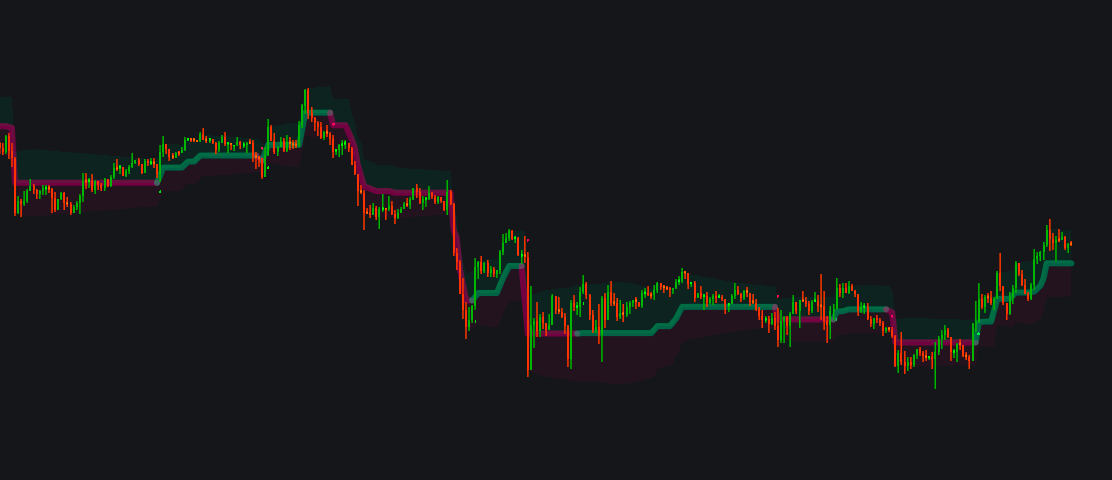
DW Range Filter DW Range Filter (B&S Signals) is a trend-following overlay indicator that filters out market noise and prints alternating BUY and SELL labels when price breaks out of a volatility-adjusted range. It is a native Indie port of the Range Fi…
DW Range Filter DW Range Filter (B&S Signals) is a trend-following overlay indicator that filters out market noise and prints alternating BUY and SELL labels when price breaks out of a volatility-adjusted range. It is a native Indie port of the Range Fi…