nod8181's Cover image
Volume Breakout Radarimage
Volume Breakout Radar
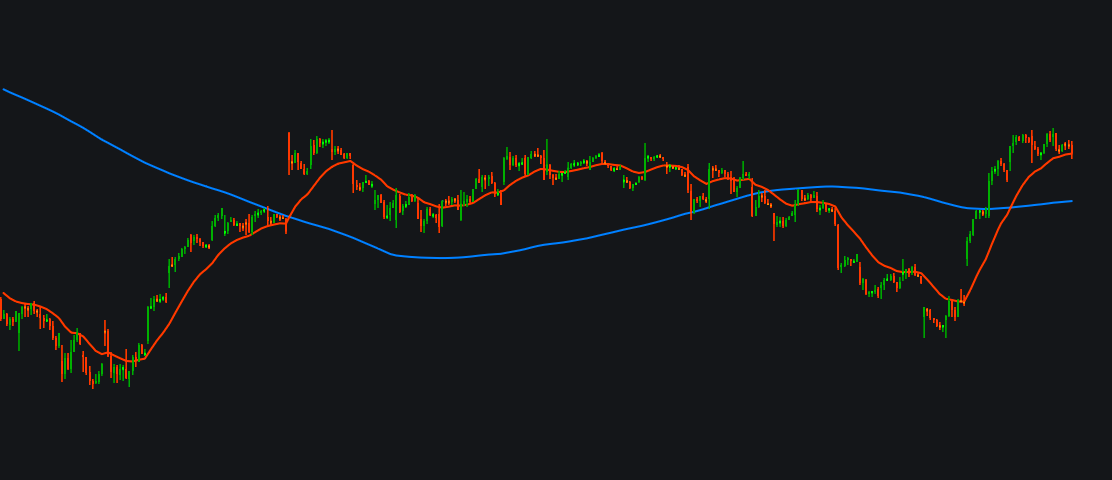
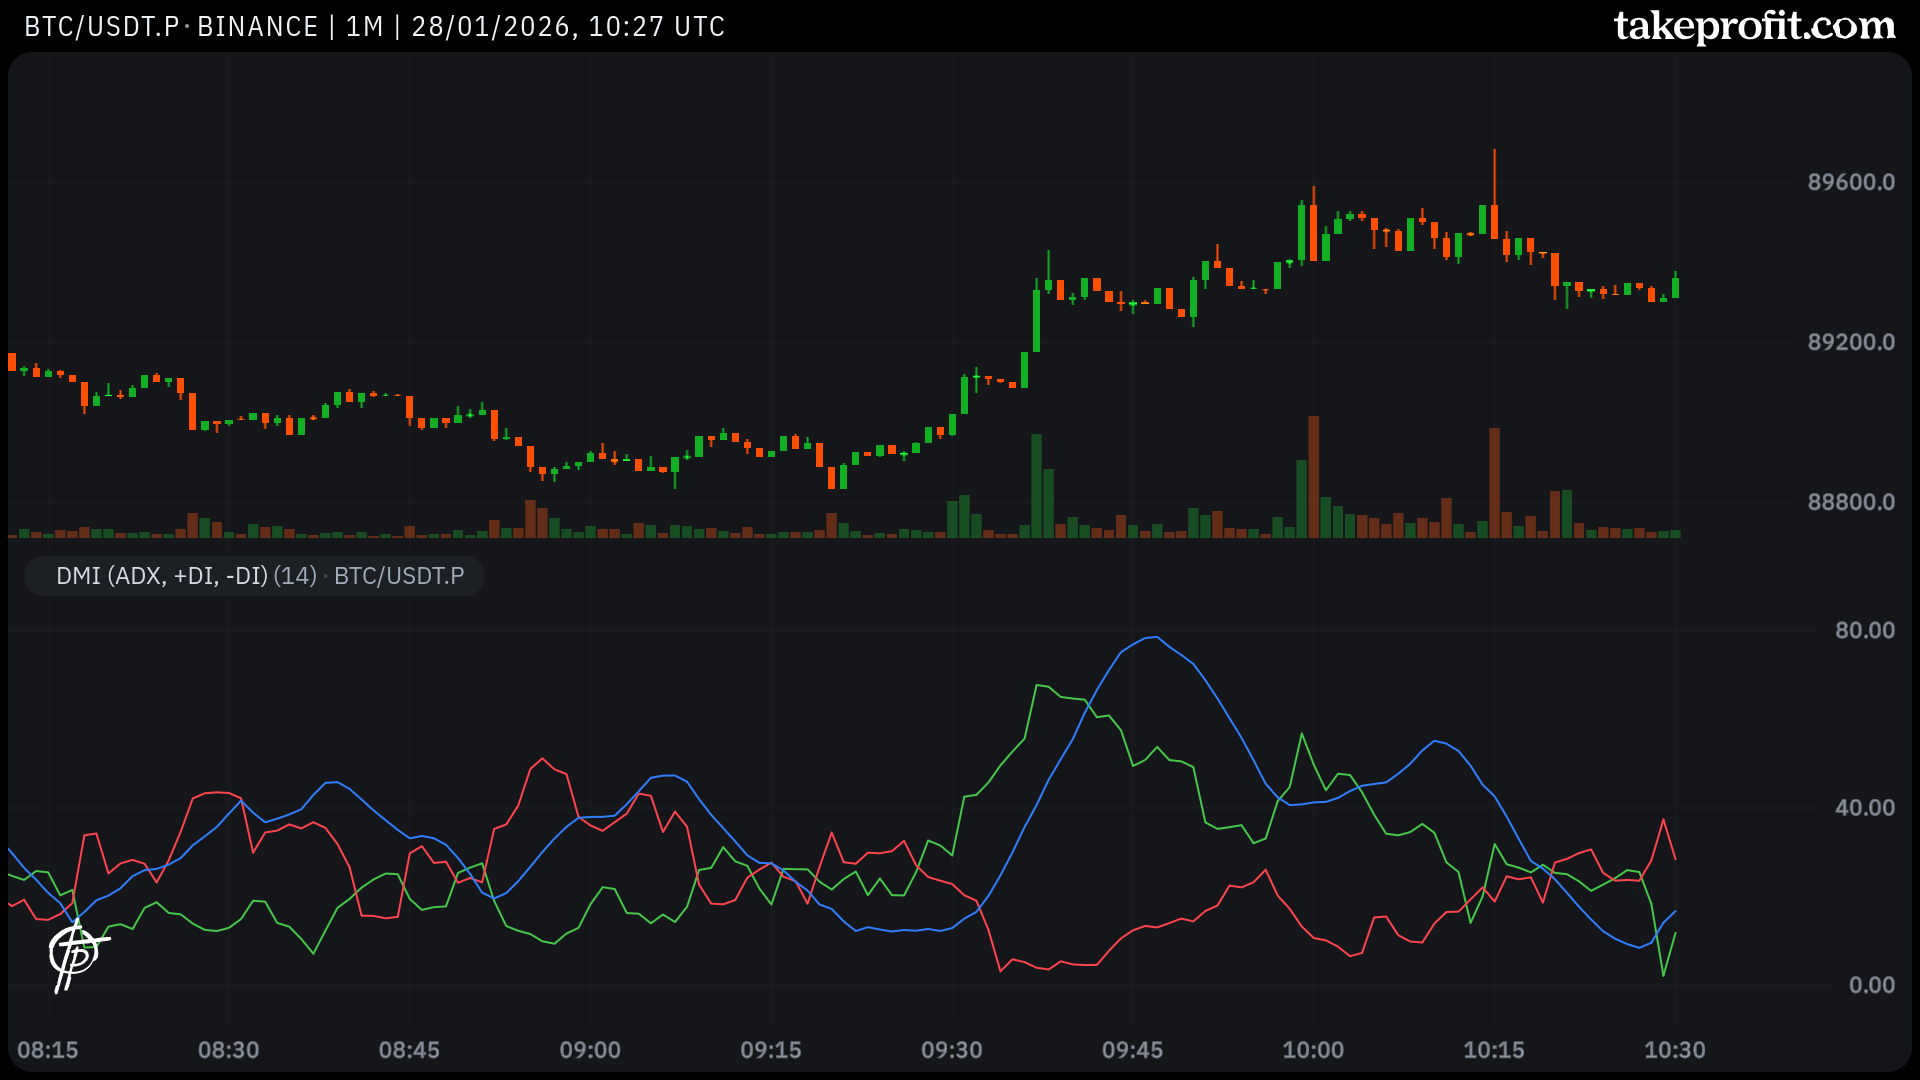
What the indicator does Logic Calculates highest high / lowest low of recent candles Compares current volume to average volume Signals only when price + volume agree Signals Bullish breakout Price breaks above recent highs Volume is significant…
/indicator/volume-breakout-radar-64
ADX Power Zonesimage
ADX Power Zones
General Disclaimer - Trading Indicators Risk Disclosure Trading financial instruments carries a high level of risk and may not be suitable for all investors. The possibility exists that you could sustain a loss of some or all of your initial investment.…
/indicator/adx-power-zones-62
Momentum Wave Explosionimage
Momentum Wave Explosion
How to Trade It 🚀 Bullish Explosion (BUY) Wave crosses above upper threshold Bright green marker appears Background glows green → Enter long position 💣 Bearish Explosion (SELL) Wave crosses below lower threshold Bright pink/red marker appears Backgroun…
/indicator/momentum-wave-explosion-44
Smart Money Flow Scannerimage
Smart Money Flow Scanner
Visual Features Line : Shows money flow strength Background : Heatmap intensity (stronger = brighter) Markers : Appear only on strong signals Zero line : Reference point How to Trade It Buy Setup: Flow crosses above zero Background turns green Marker app…
/indicator/smart-money-flow-scanner-84
Trend Pullback Detectorimage
Trend Pullback Detector
What this indicator does (stock-optimized) This indicator finds high-probability pullback entries in established stock trends instead of chasing breakouts. Concept Uses a 200 SMA to define the primary stock trend Uses a 20 EMA to detect pullbacks
/indicator/trend-pullback-detector-87
Trend Momentum Crossoverimage
Trend Momentum Crossover
Trend Momentum Crossover is a trend-following indicator that identifies high-probability buy and sell opportunities by combining moving average crossovers with momentum confirmation. The indicator plots two Simple Moving Averages (fast and slow) to defi…
/indicator/trend-momentum-crossover-23
DMIimage
DMI
The DMI indicator tracks market trend strength and direction by combining +DI, -DI, and ADX lines, helping traders identify bullish or bearish dominance and trend intensity.
/indicator/dmi-27