Confluence S/R Proimage
Confluence S/R Pro
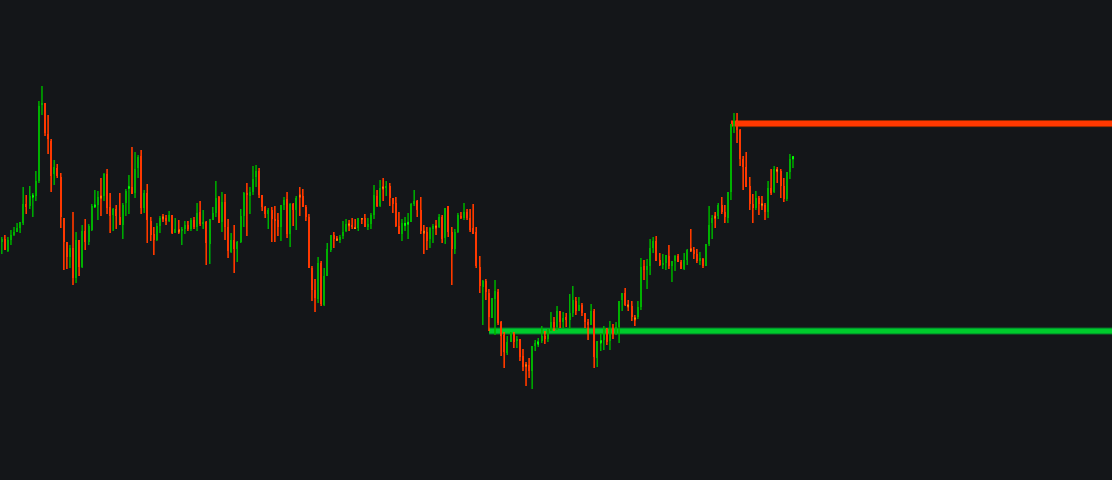
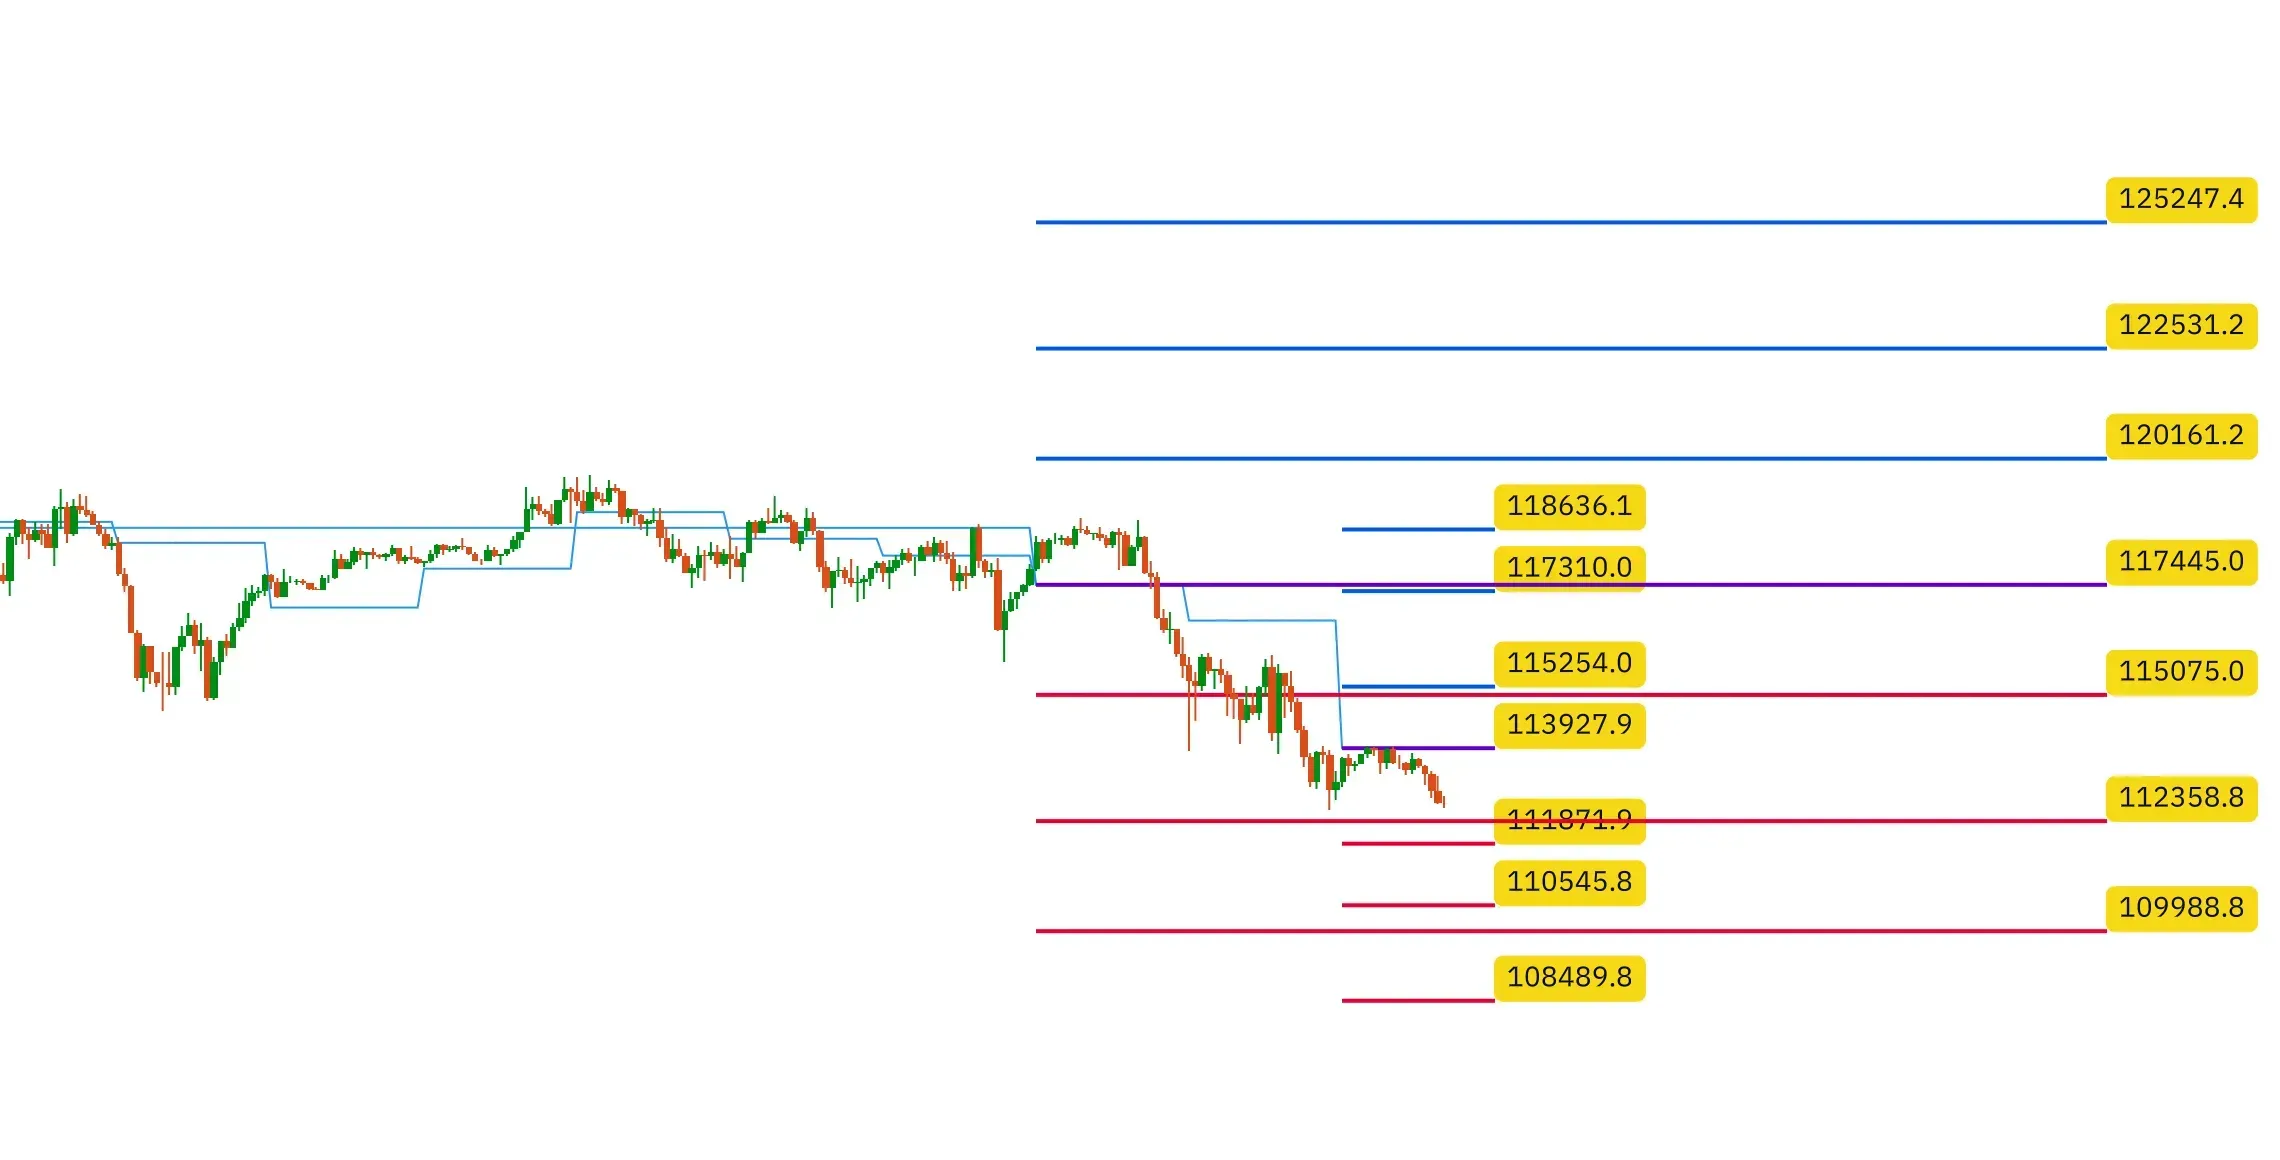
Confluence S/R Pro Pinpoint high-probability support & resistance levels using a powerful 3-factor confirmation system. Works on any timeframe. Confluence S/R Pro identifies the most significant support and resistance levels by combining three powerful t…
/indicator/confluence-s-r-pro-58
Daily & Weekly Pivotsimage
Daily & Weekly Pivots
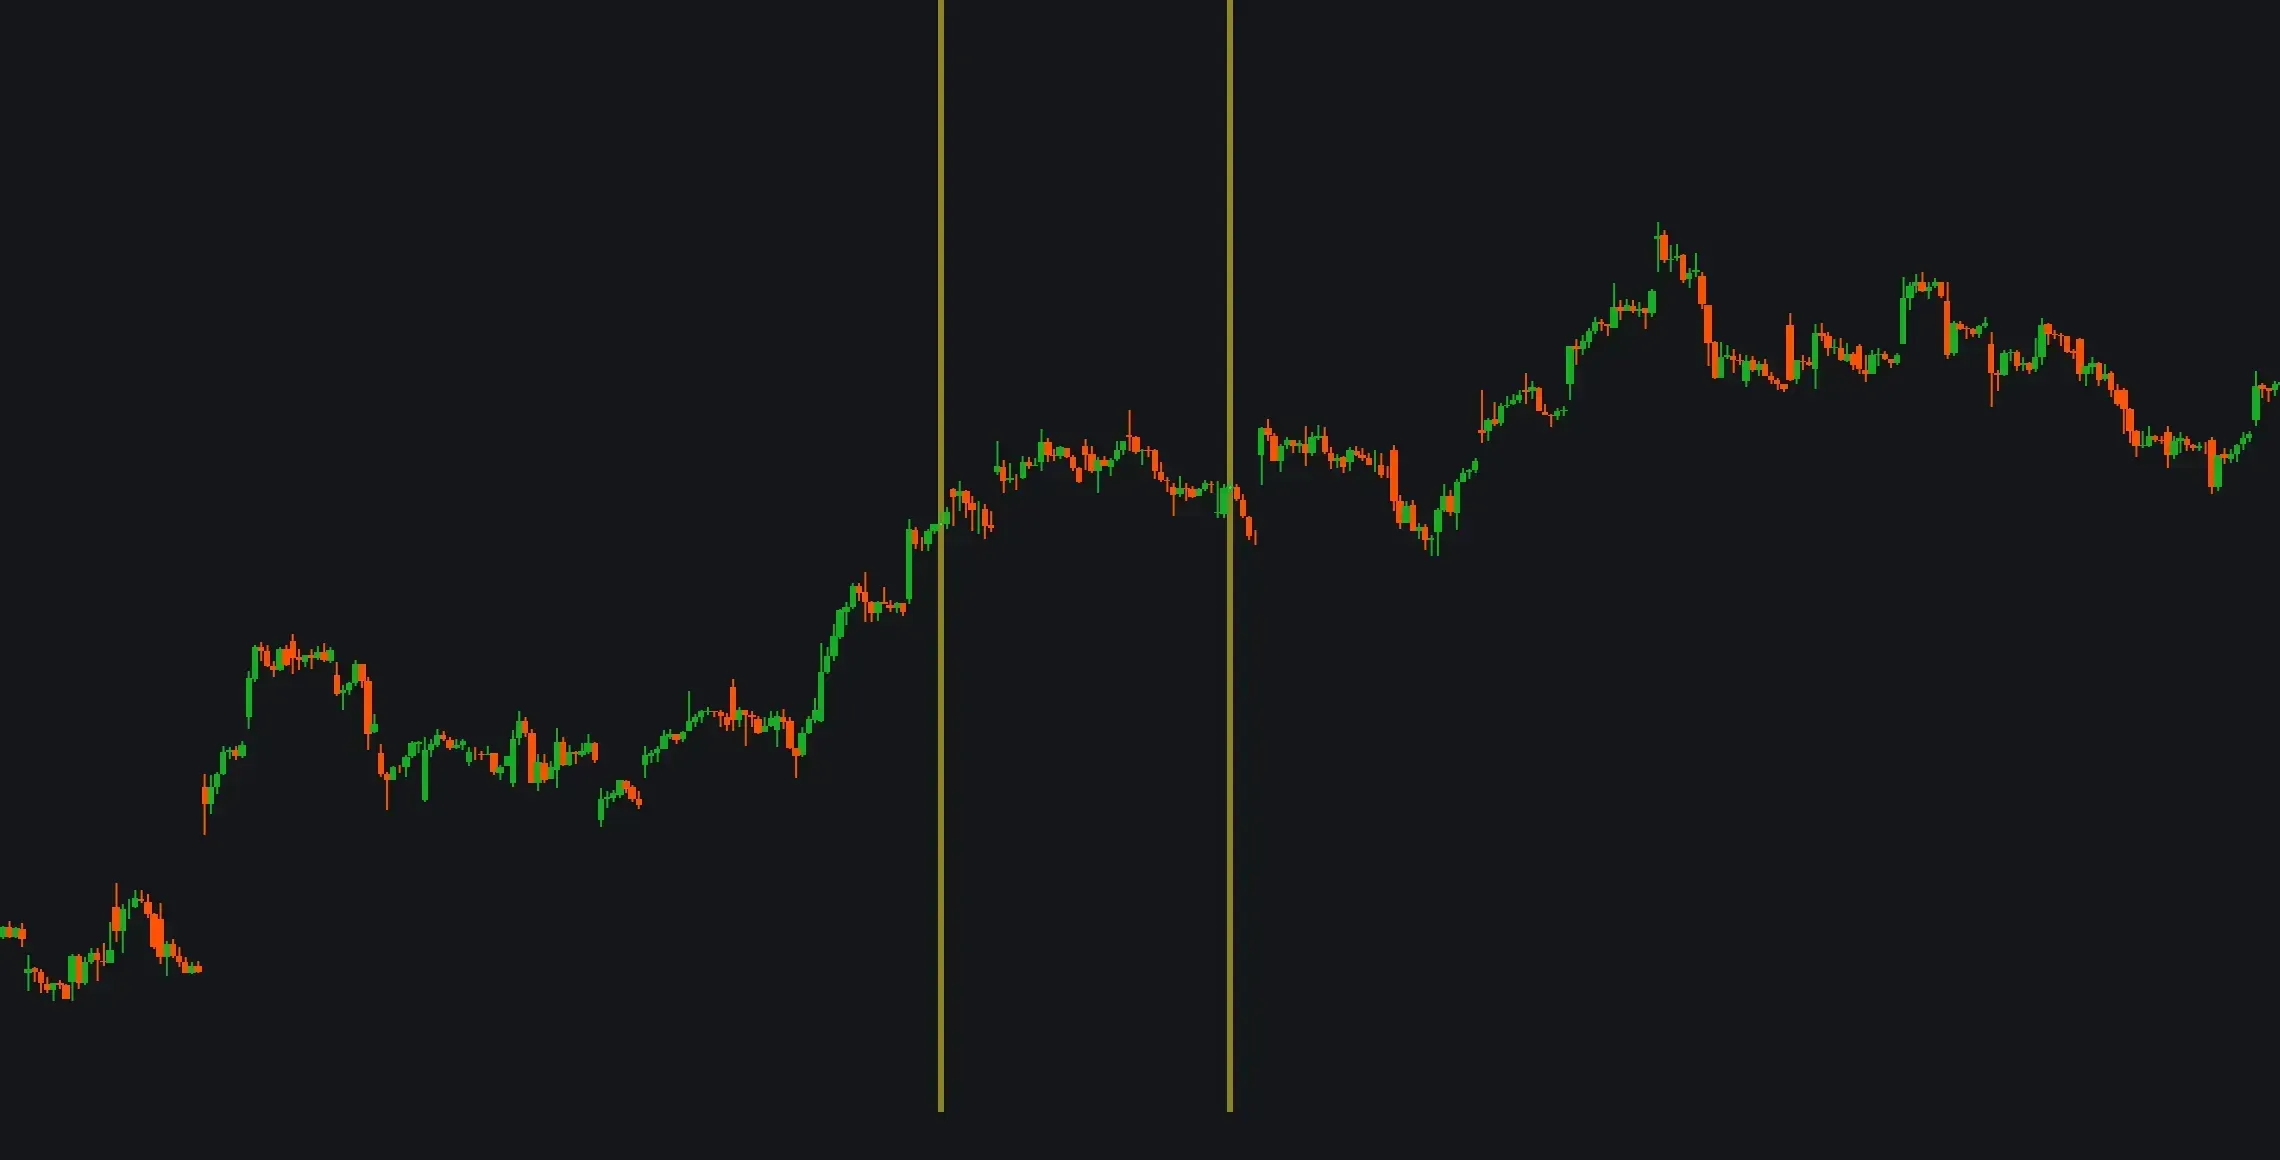
Unlock a powerful edge in your trading with Daily & Weekly Pivots , the ultimate indicator for identifying crucial market turning points. Designed for serious traders, this premium tool provides a comprehensive, real-time view of both daily and weekly p…
/indicator/daily-weekly-pivots-96
ORB - Opening Range Breakoutimage
ORB - Opening Range Breakout
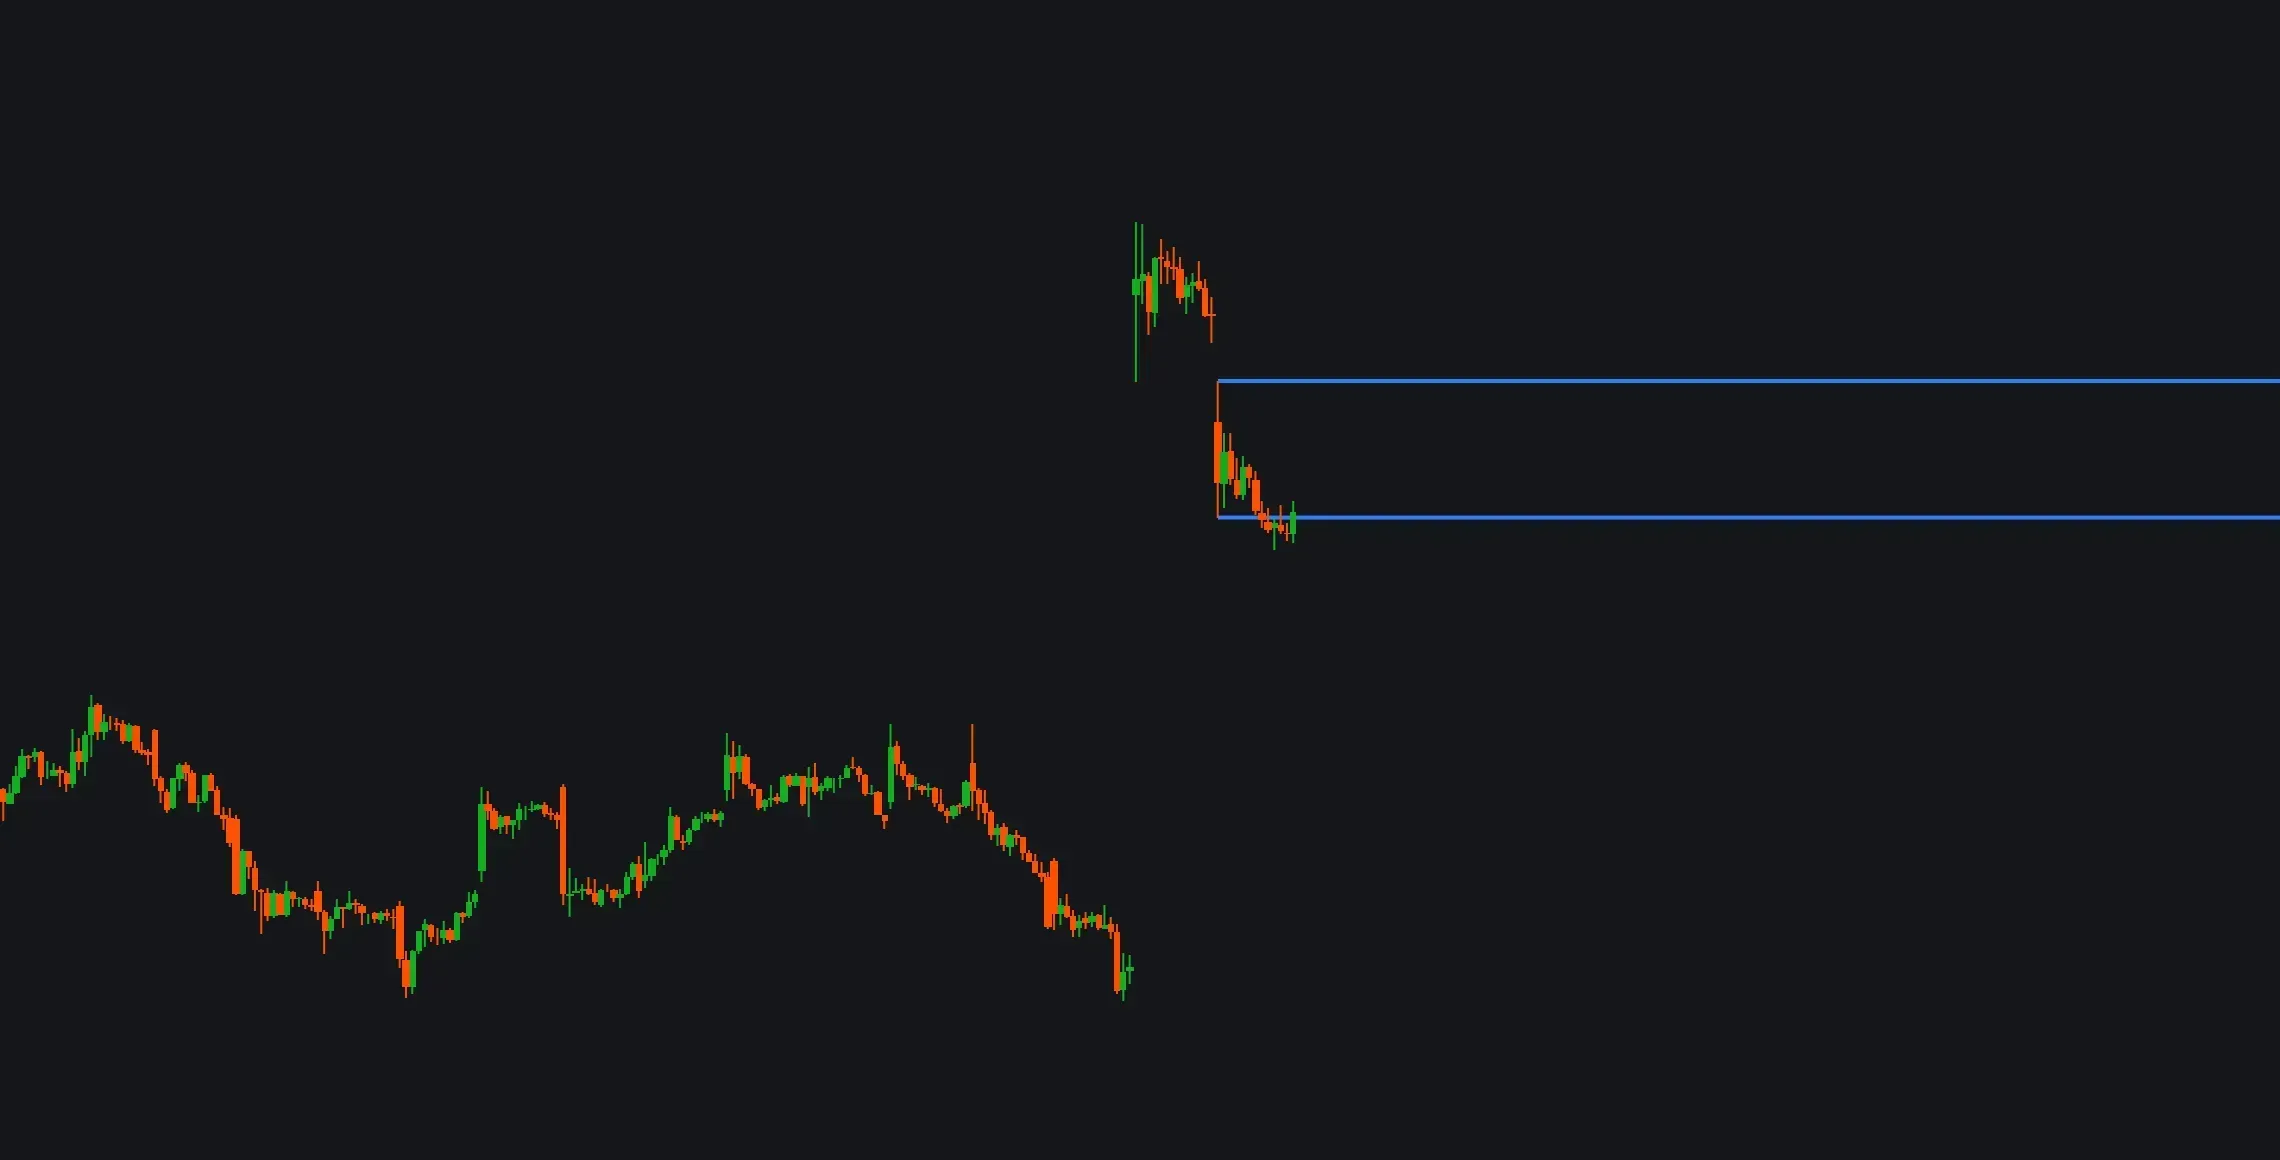
Mark the Opening Range with Precision The ORB indicator automatically identifies and marks the high and low of the first candle during your specified market opening session. Perfect for day traders who rely on opening range breakout strategies. Key Featu…
/indicator/orb-opening-range-breakout-78
Doji Candlesimage
Doji Candles
Doji Candles Automatically identifies and highlights doji candlestick patterns on your chart with customizable visual alerts. Doji candles are powerful reversal signals that occur when the opening and closing prices are nearly identical, indicating marke…
/indicator/doji-candles-97
Simple Pattern Recognizerimage
Simple Pattern Recognizer
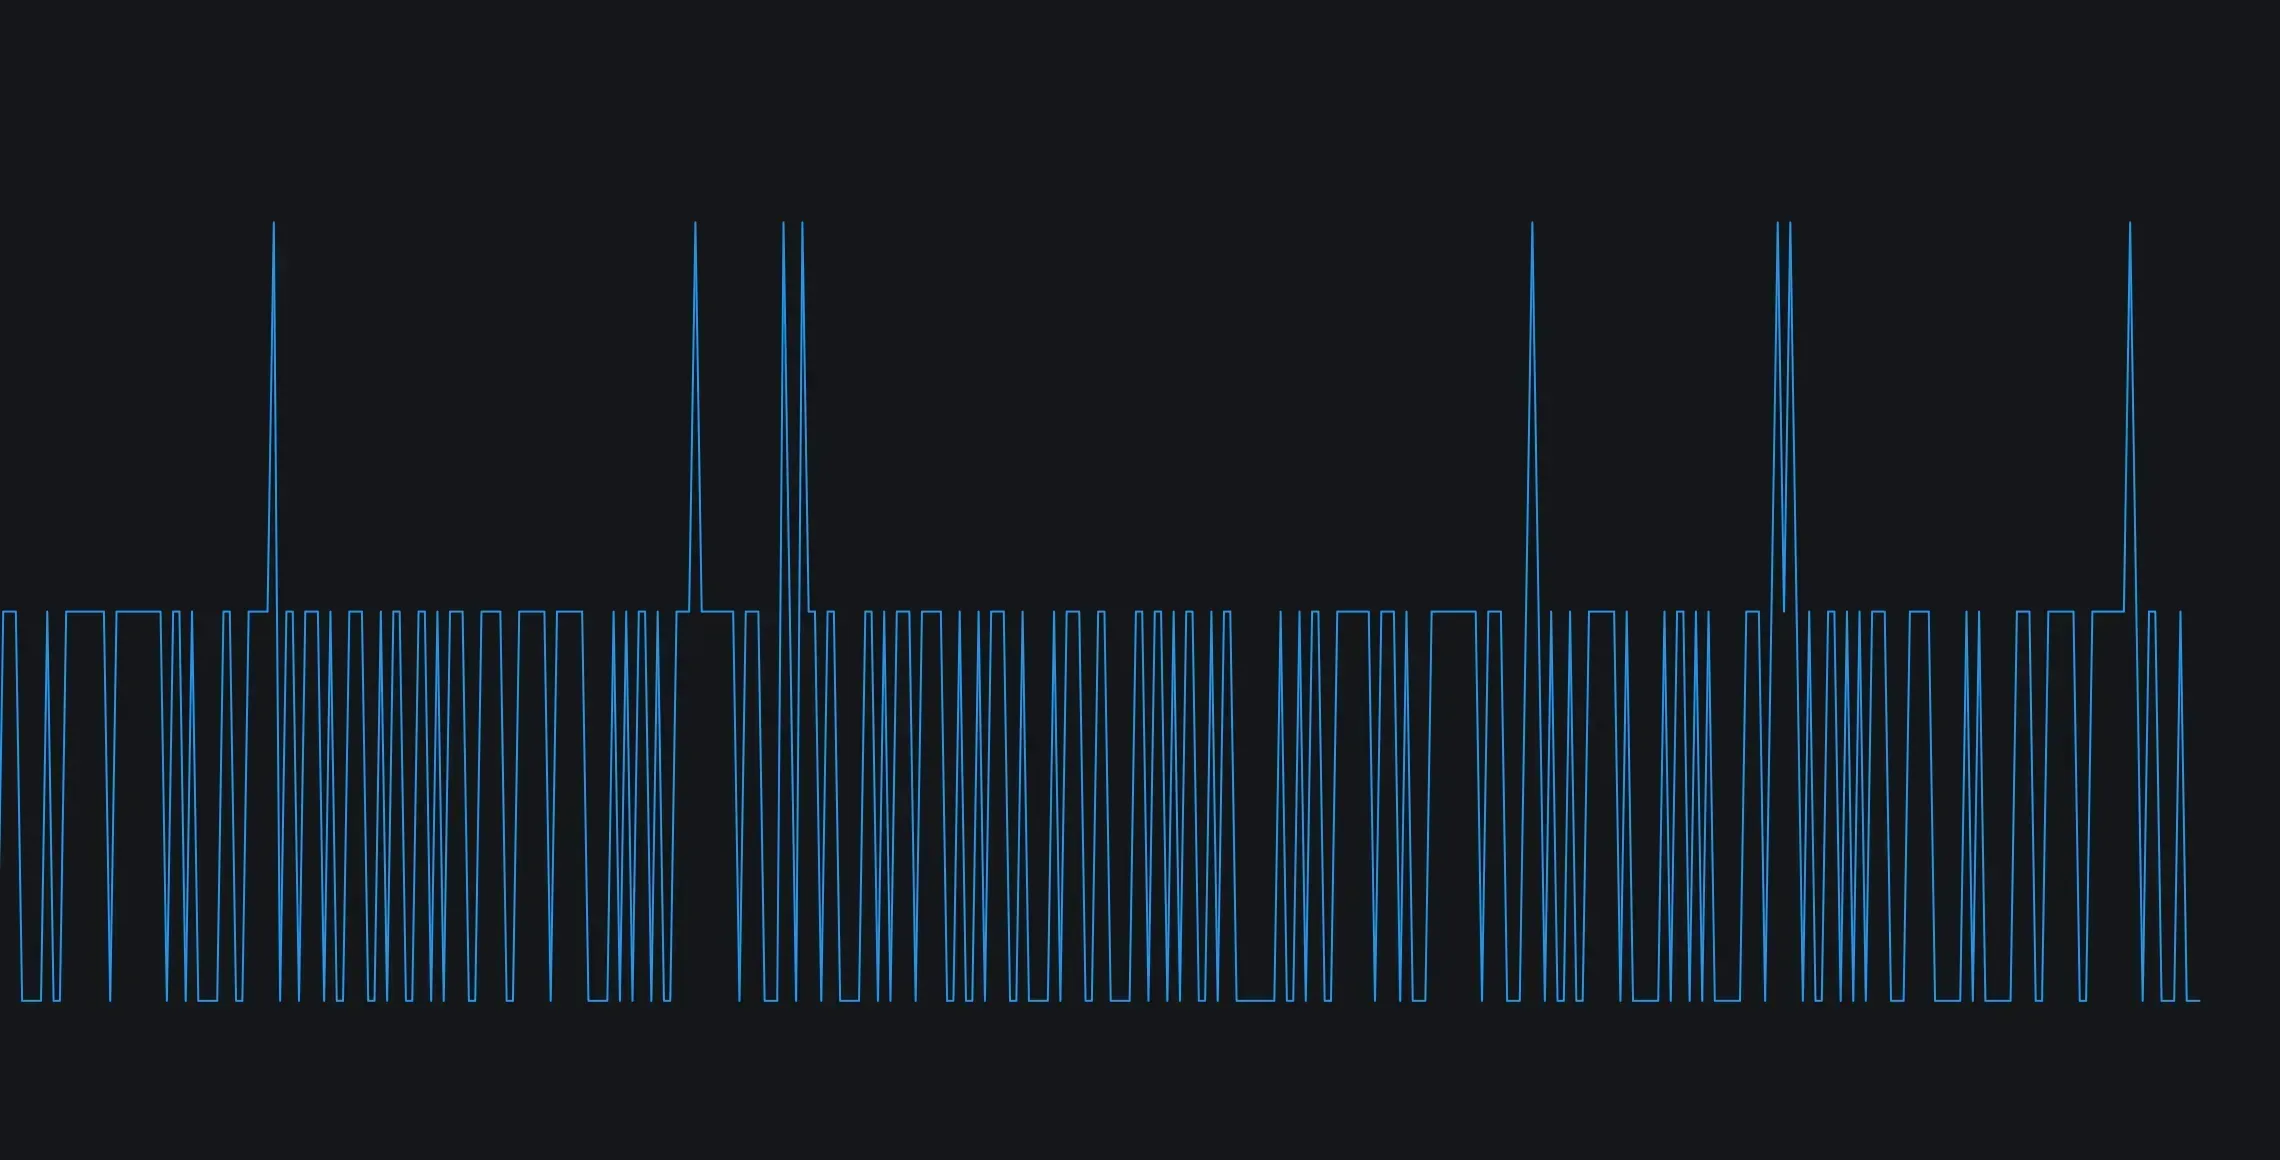
How It Works: Finds pivot highs and lows using configurable strength Analyzes pivot relationships to identify classic patterns Validates patterns using tolerance and ATR significance Returns numerical score indicating pattern type and strength Minima…
/indicator/simple-pattern-recognizer-19
Pi Cycle Topimage
Pi Cycle Top
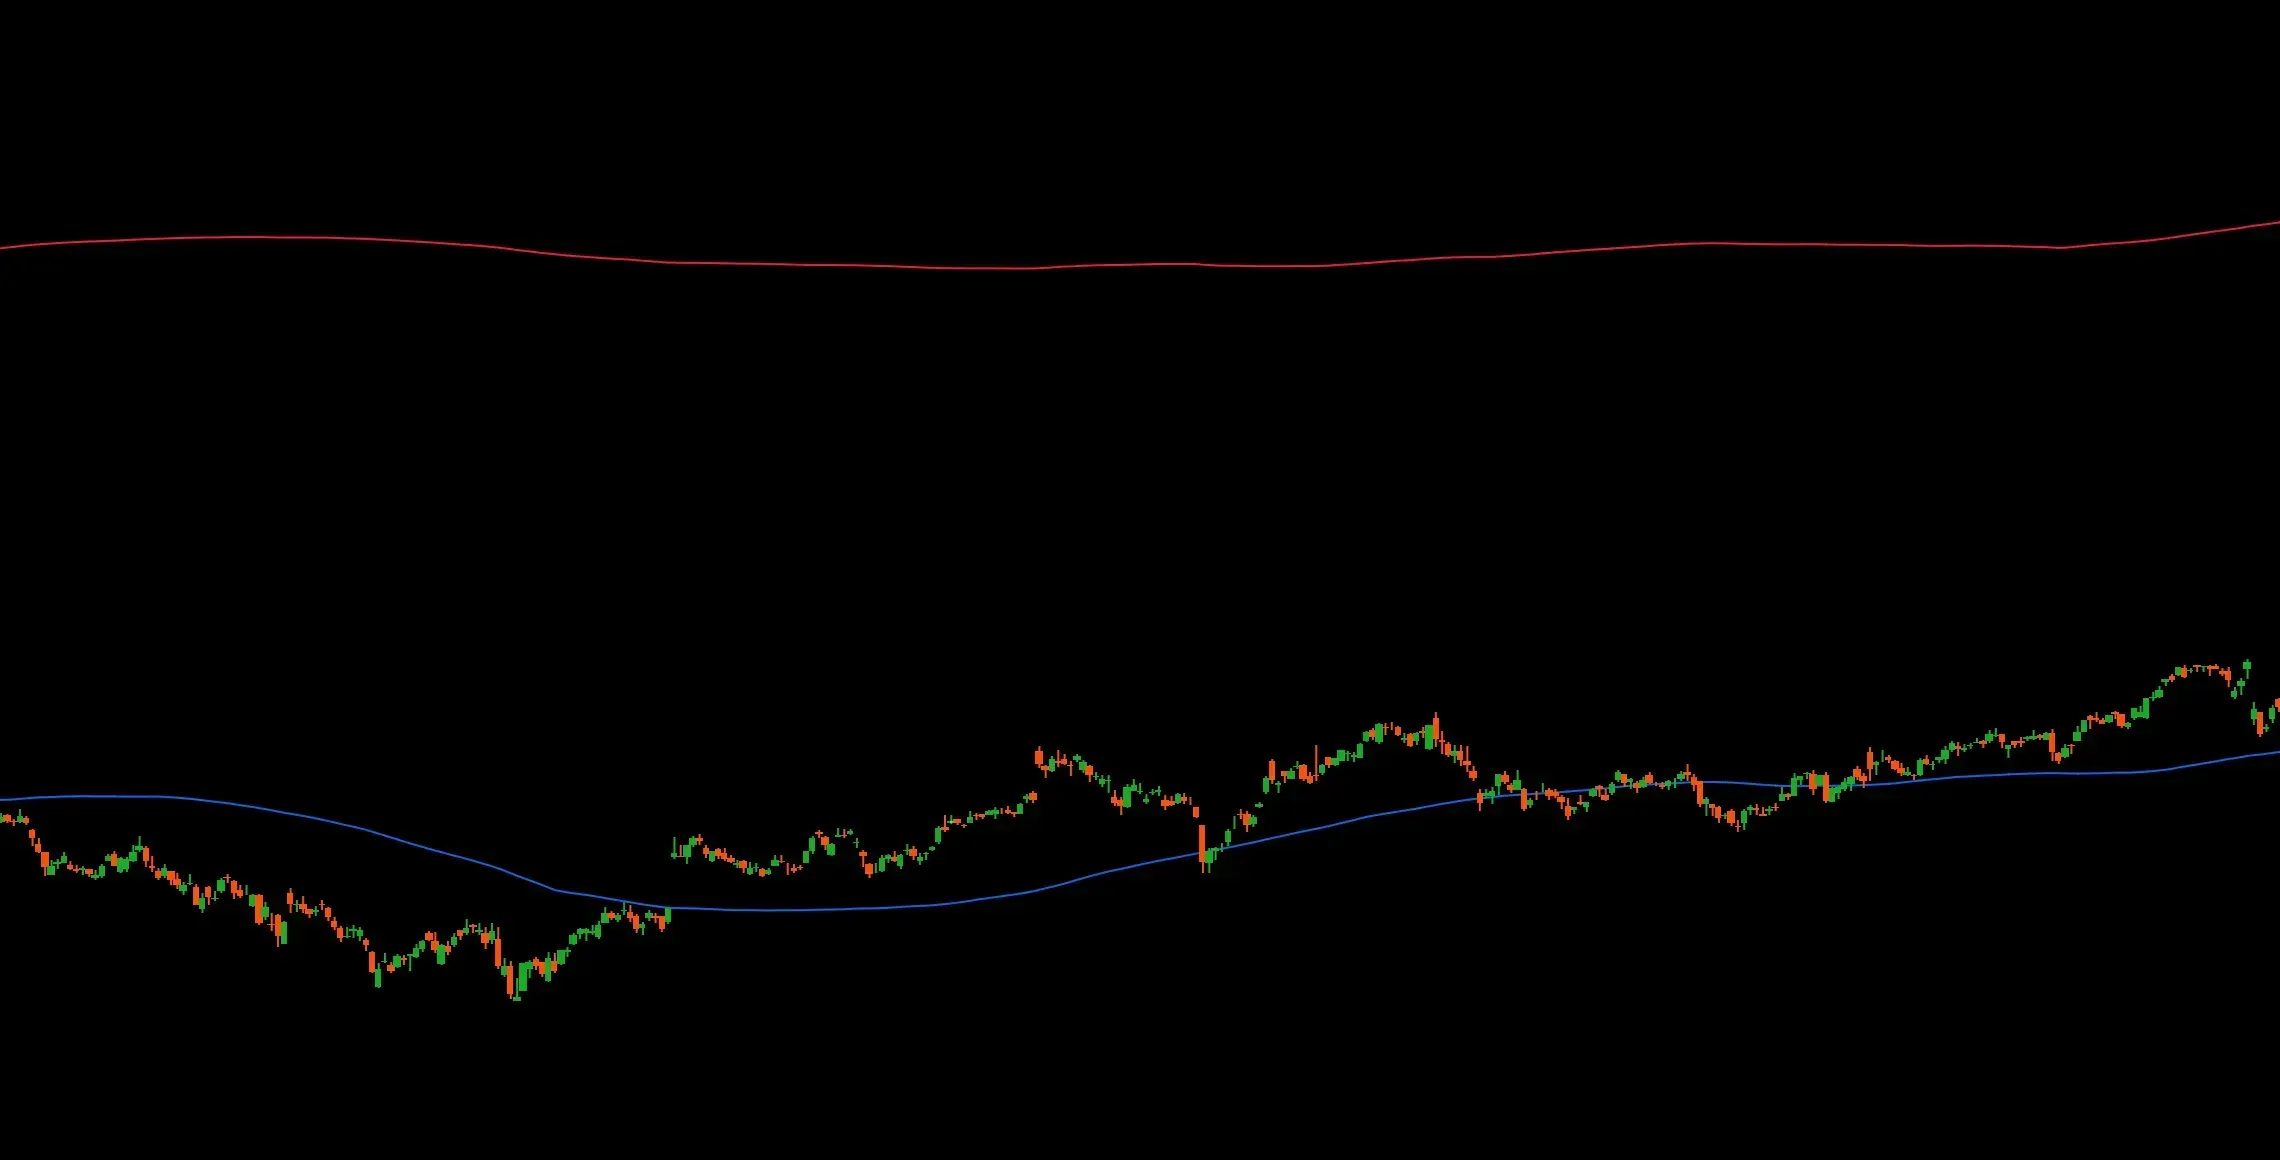
The Pi Cycle Top Indicator is a technical tool designed to identify the potential peak of Bitcoin's major market cycles. Its signal is based on the crossover of two specific Day Moving Averages (DMAs): the 111DMA and the 350DMA multiplied by two. Histori…
/indicator/pi-cycle-top-7
Pivot Ribbon {BLC}image
Pivot Ribbon {BLC}
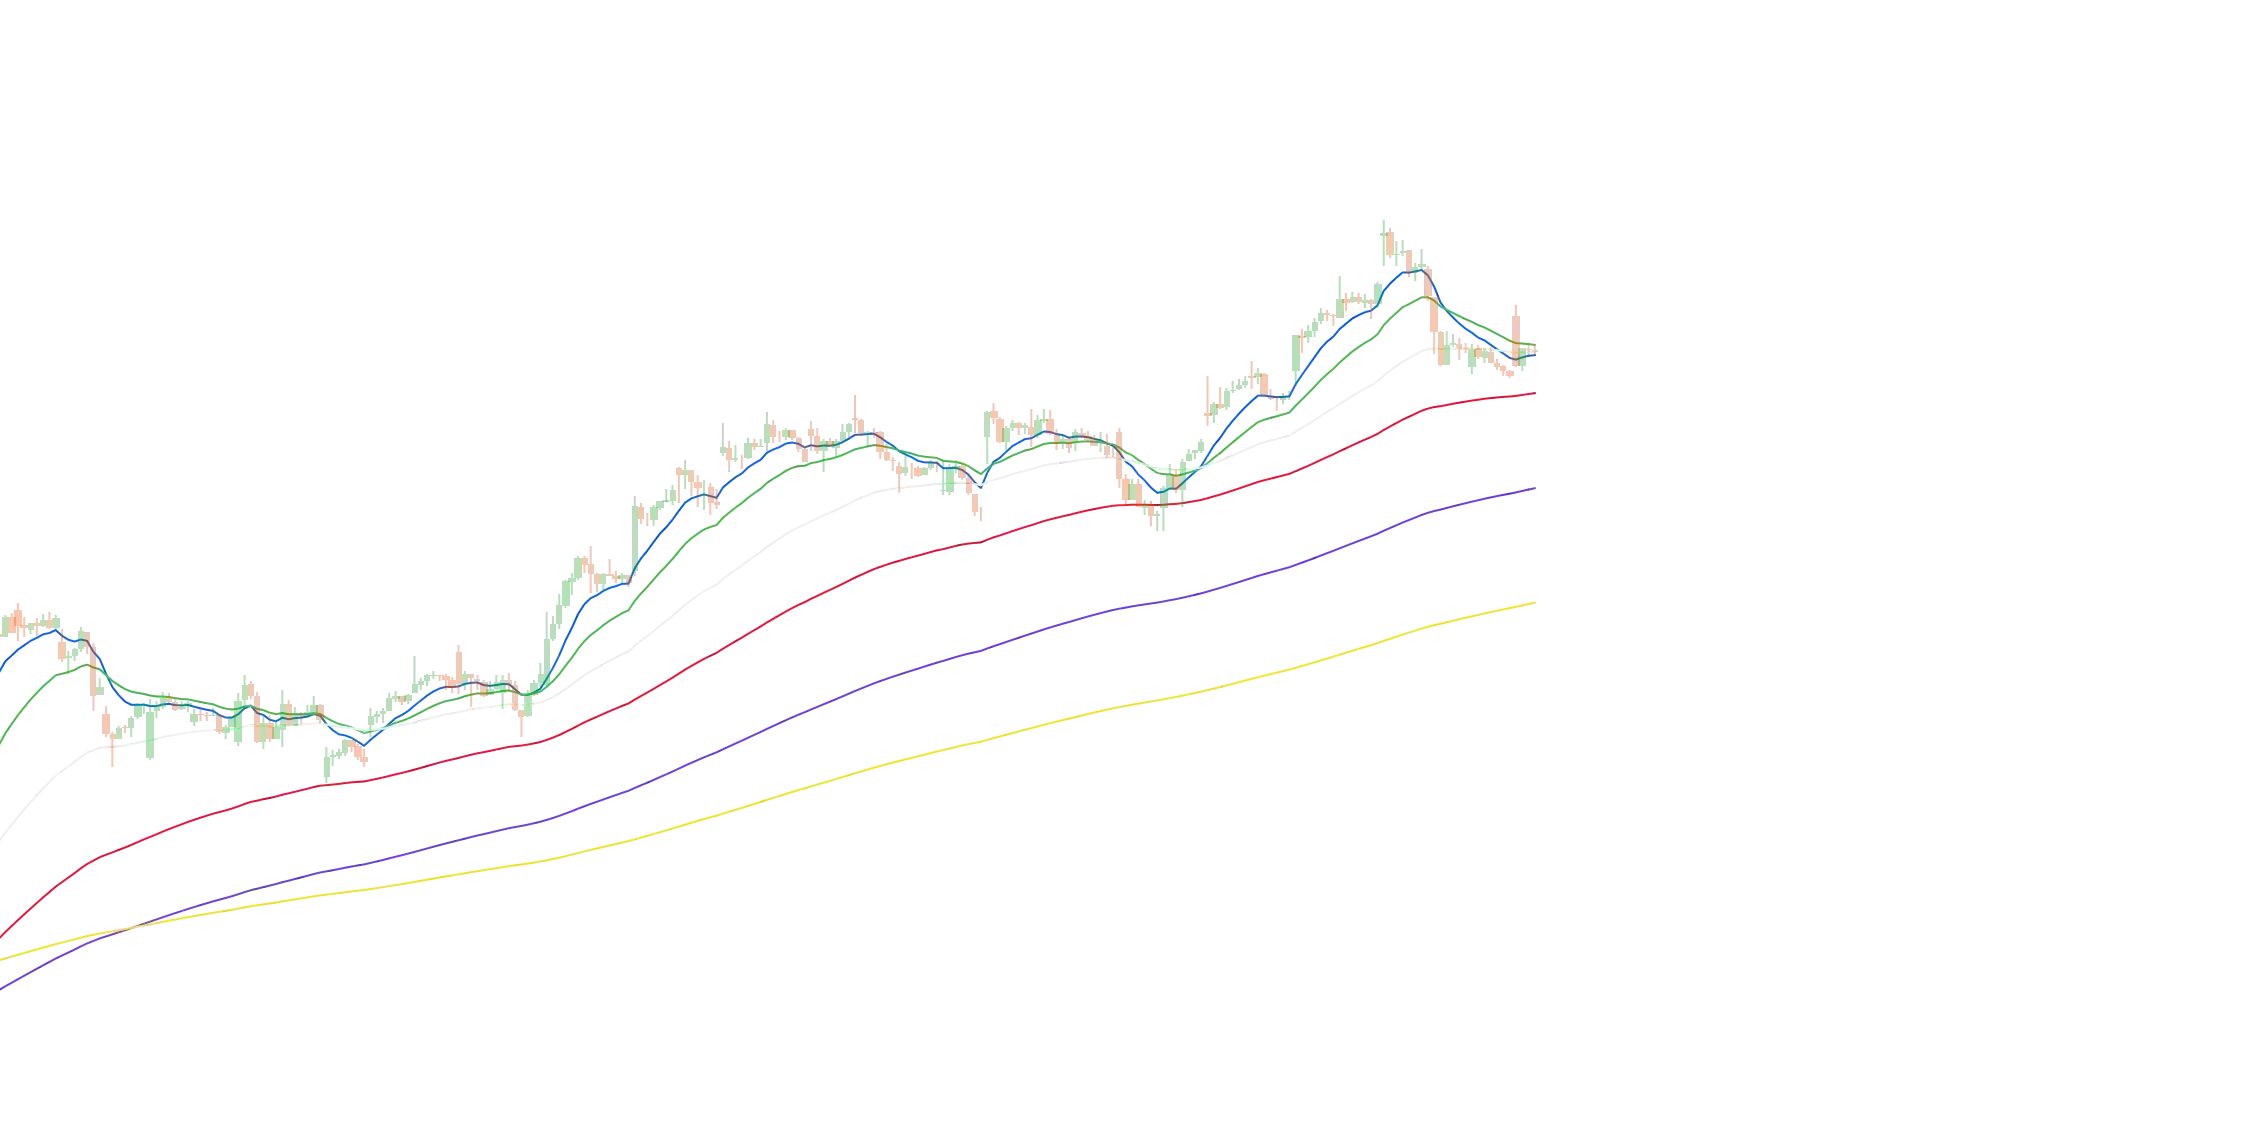
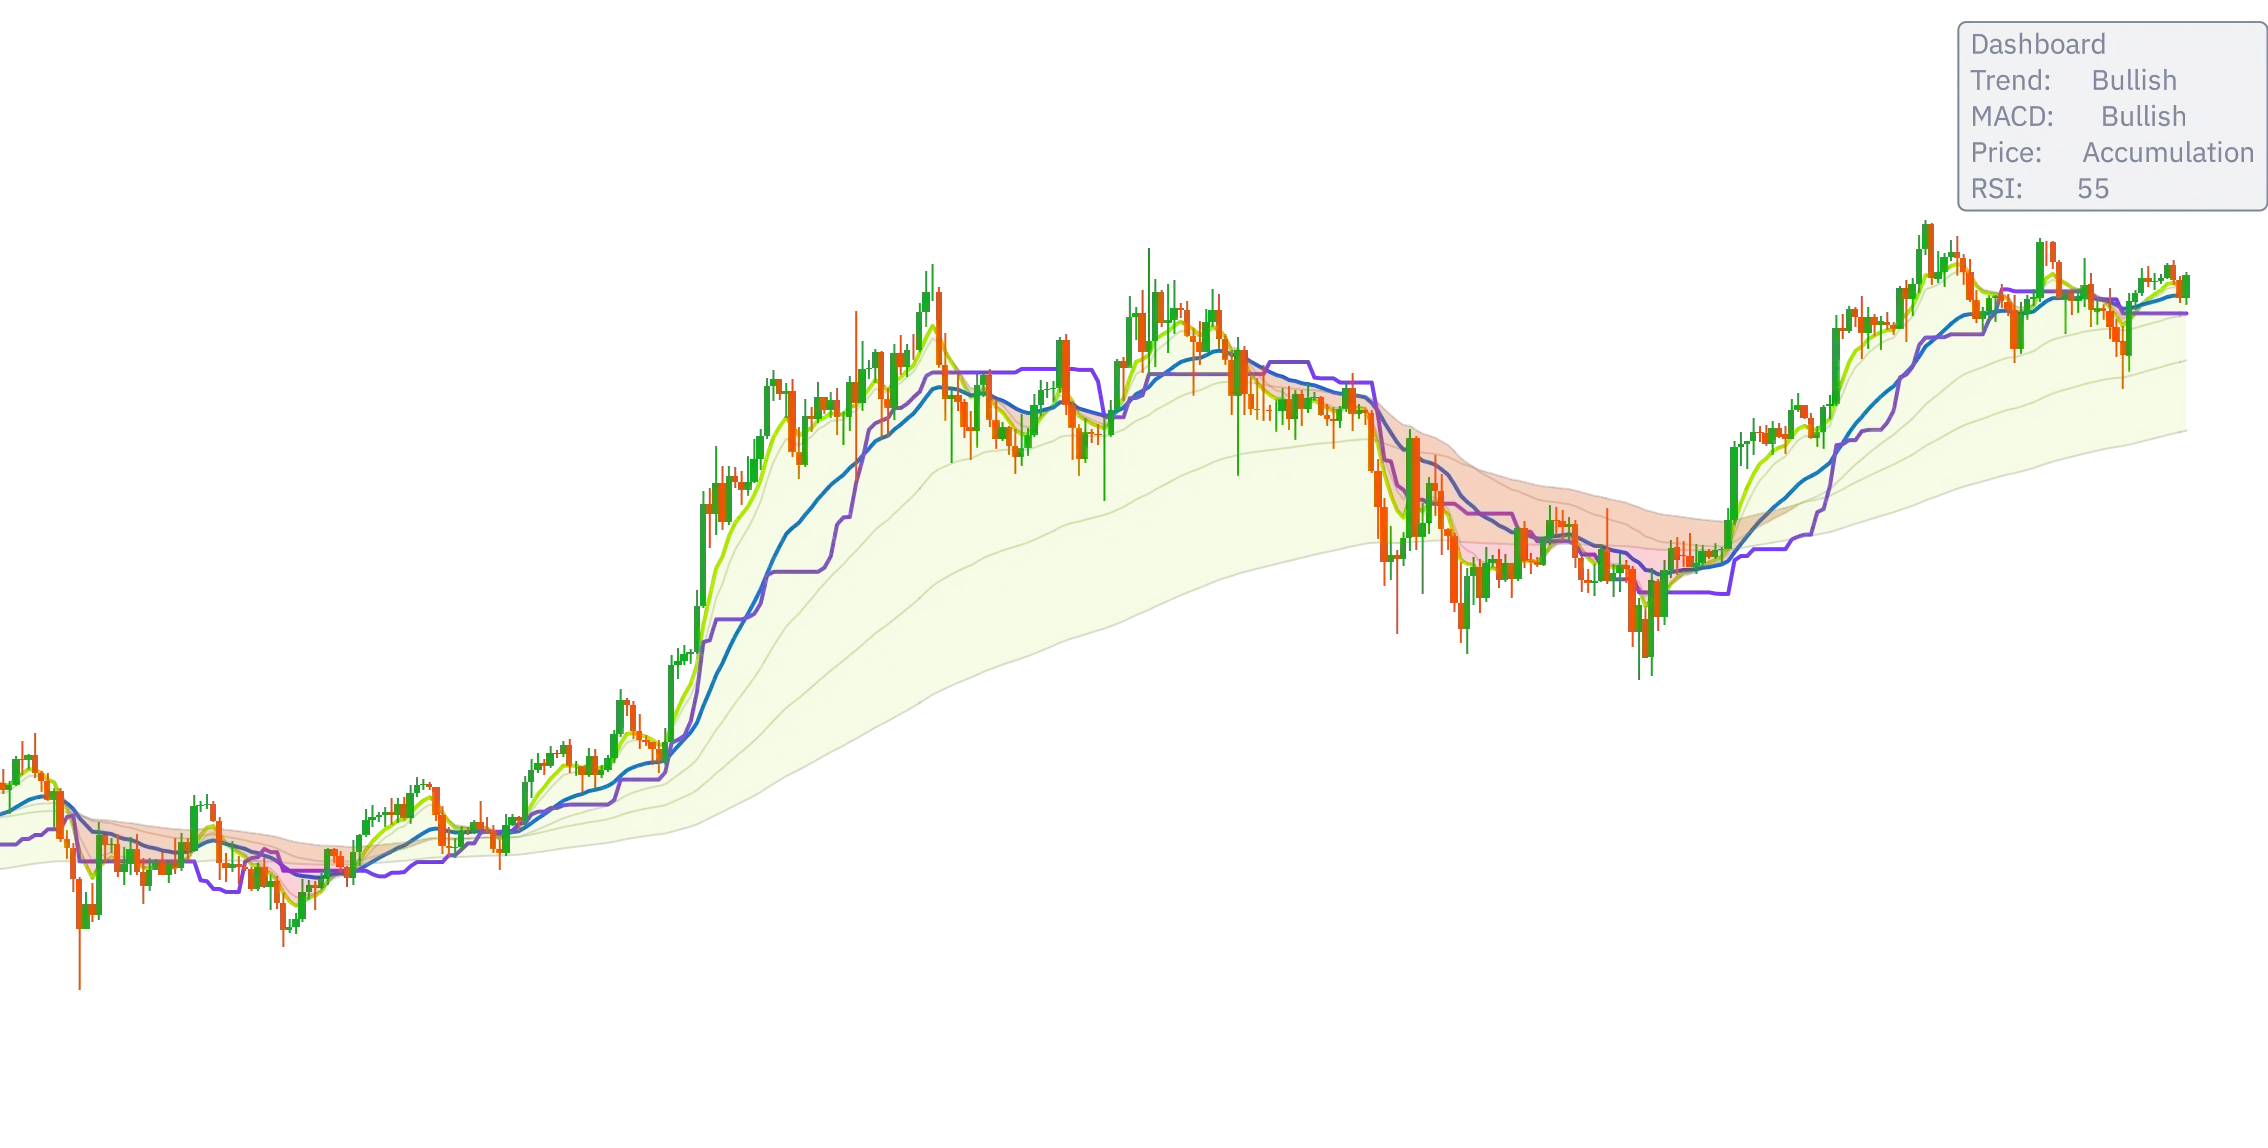
Ported from Saty Mahajan "Saty Pivot Ribbon" on TV.  A 3 EMA Ribbon + Conviction EMAs system that simplifies measuring and using EMAs for trend and support/resistance . If you are familiar with using a faster EMA (8 or 9) with a pivot EMA (21) you should…
/indicator/pivot-ribbon-blc-46
TTM Squeeze Pro [BLC]image
TTM Squeeze Pro [BLC]
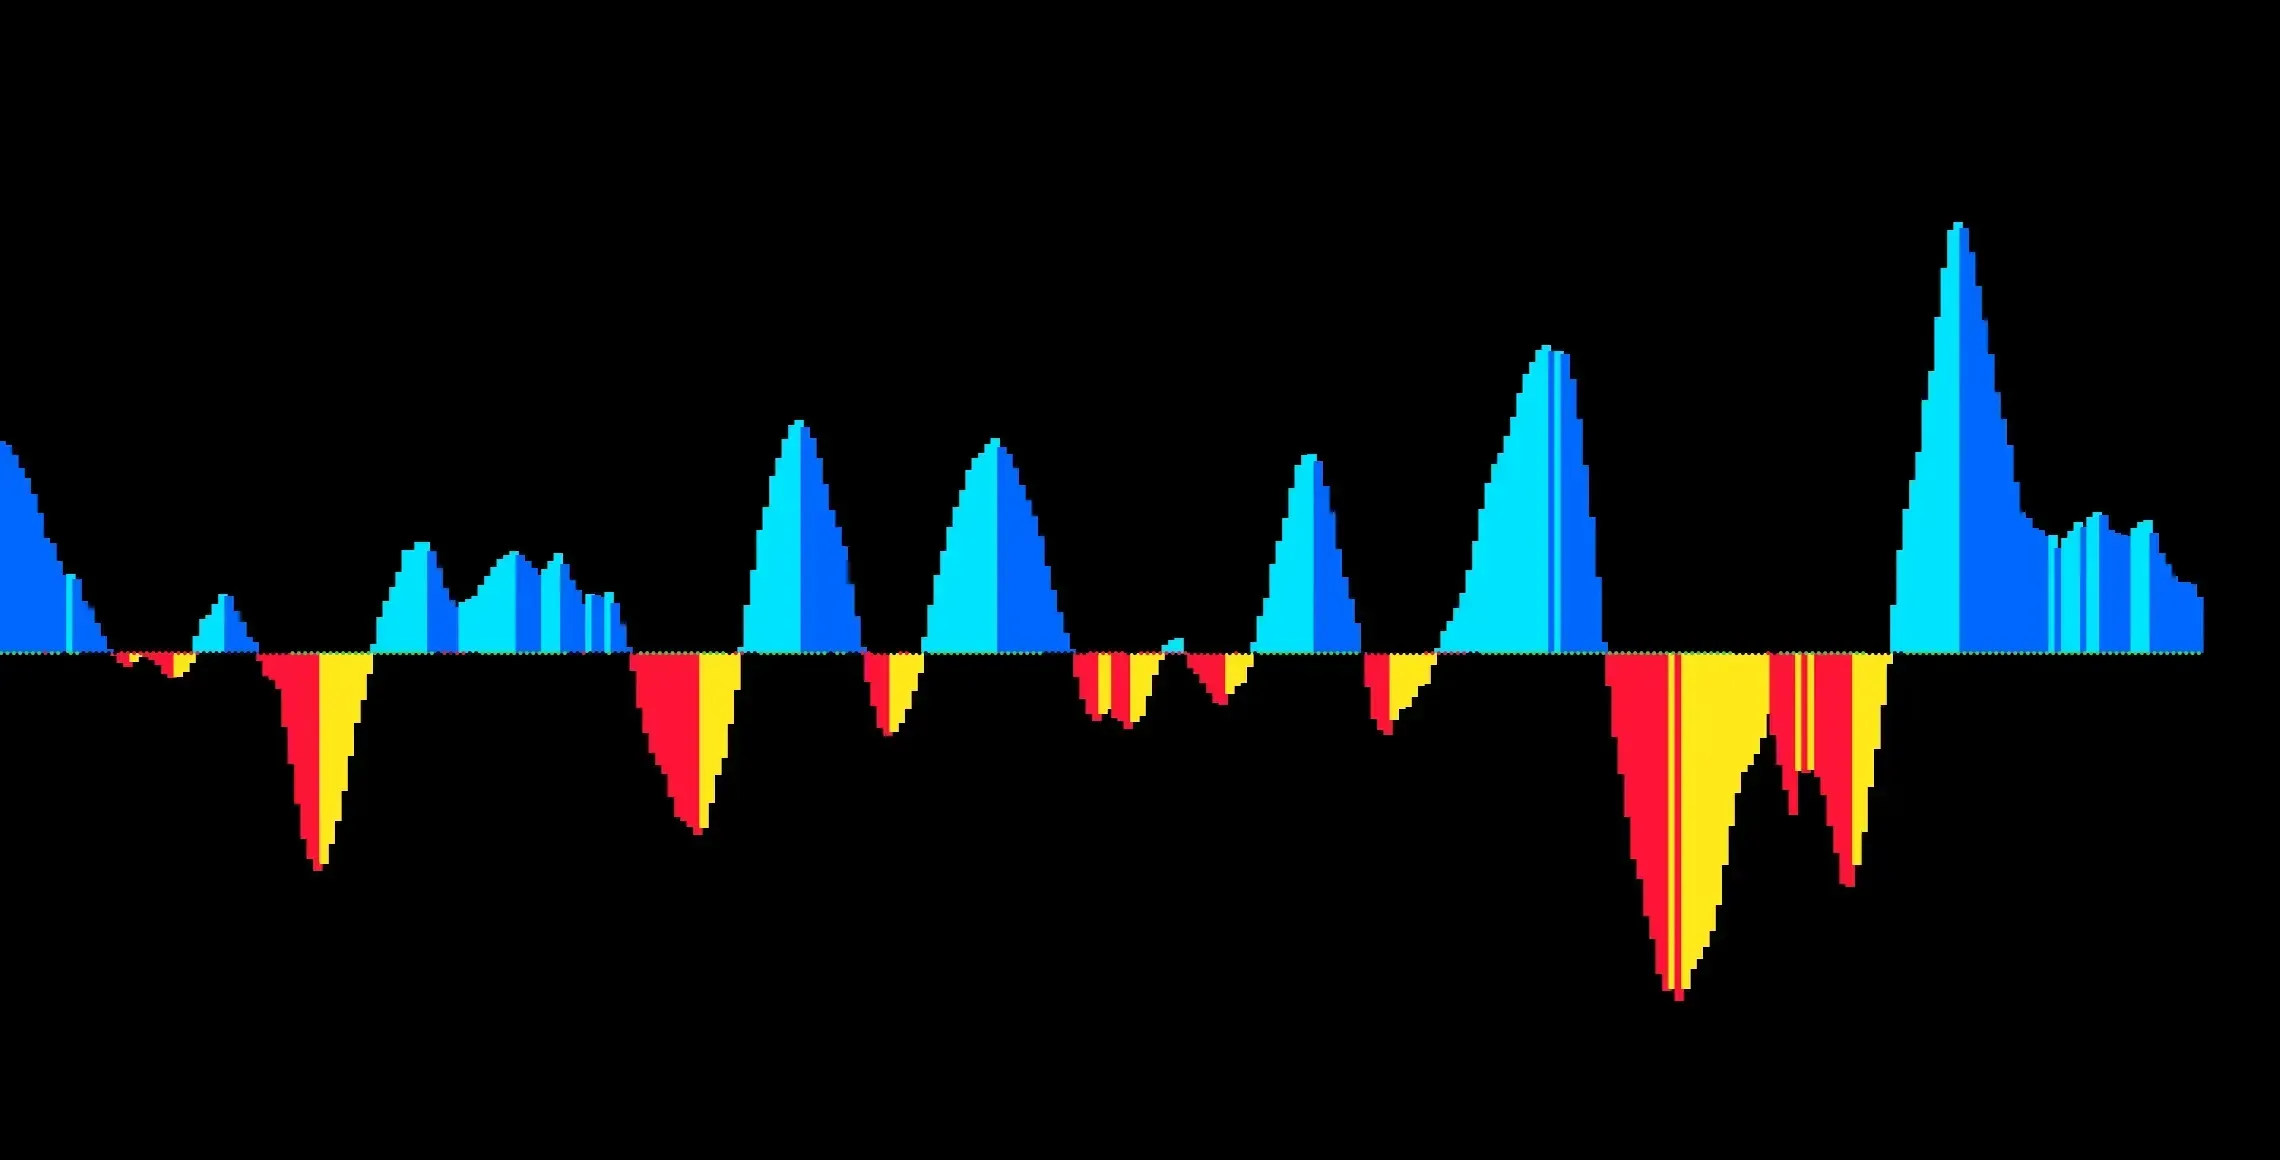
Developed by Simpler Trading's John Carter. I noticed there wasn't a pro version of this on takeprofit yet, and wanted to contribute to the community. This is my most used indicator on other platforms.
/indicator/ttm-squeeze-pro-blc-90
Multi-indicator Signal Builder [Skyrexio]image
Multi-indicator Signal Builder [Skyrexio]
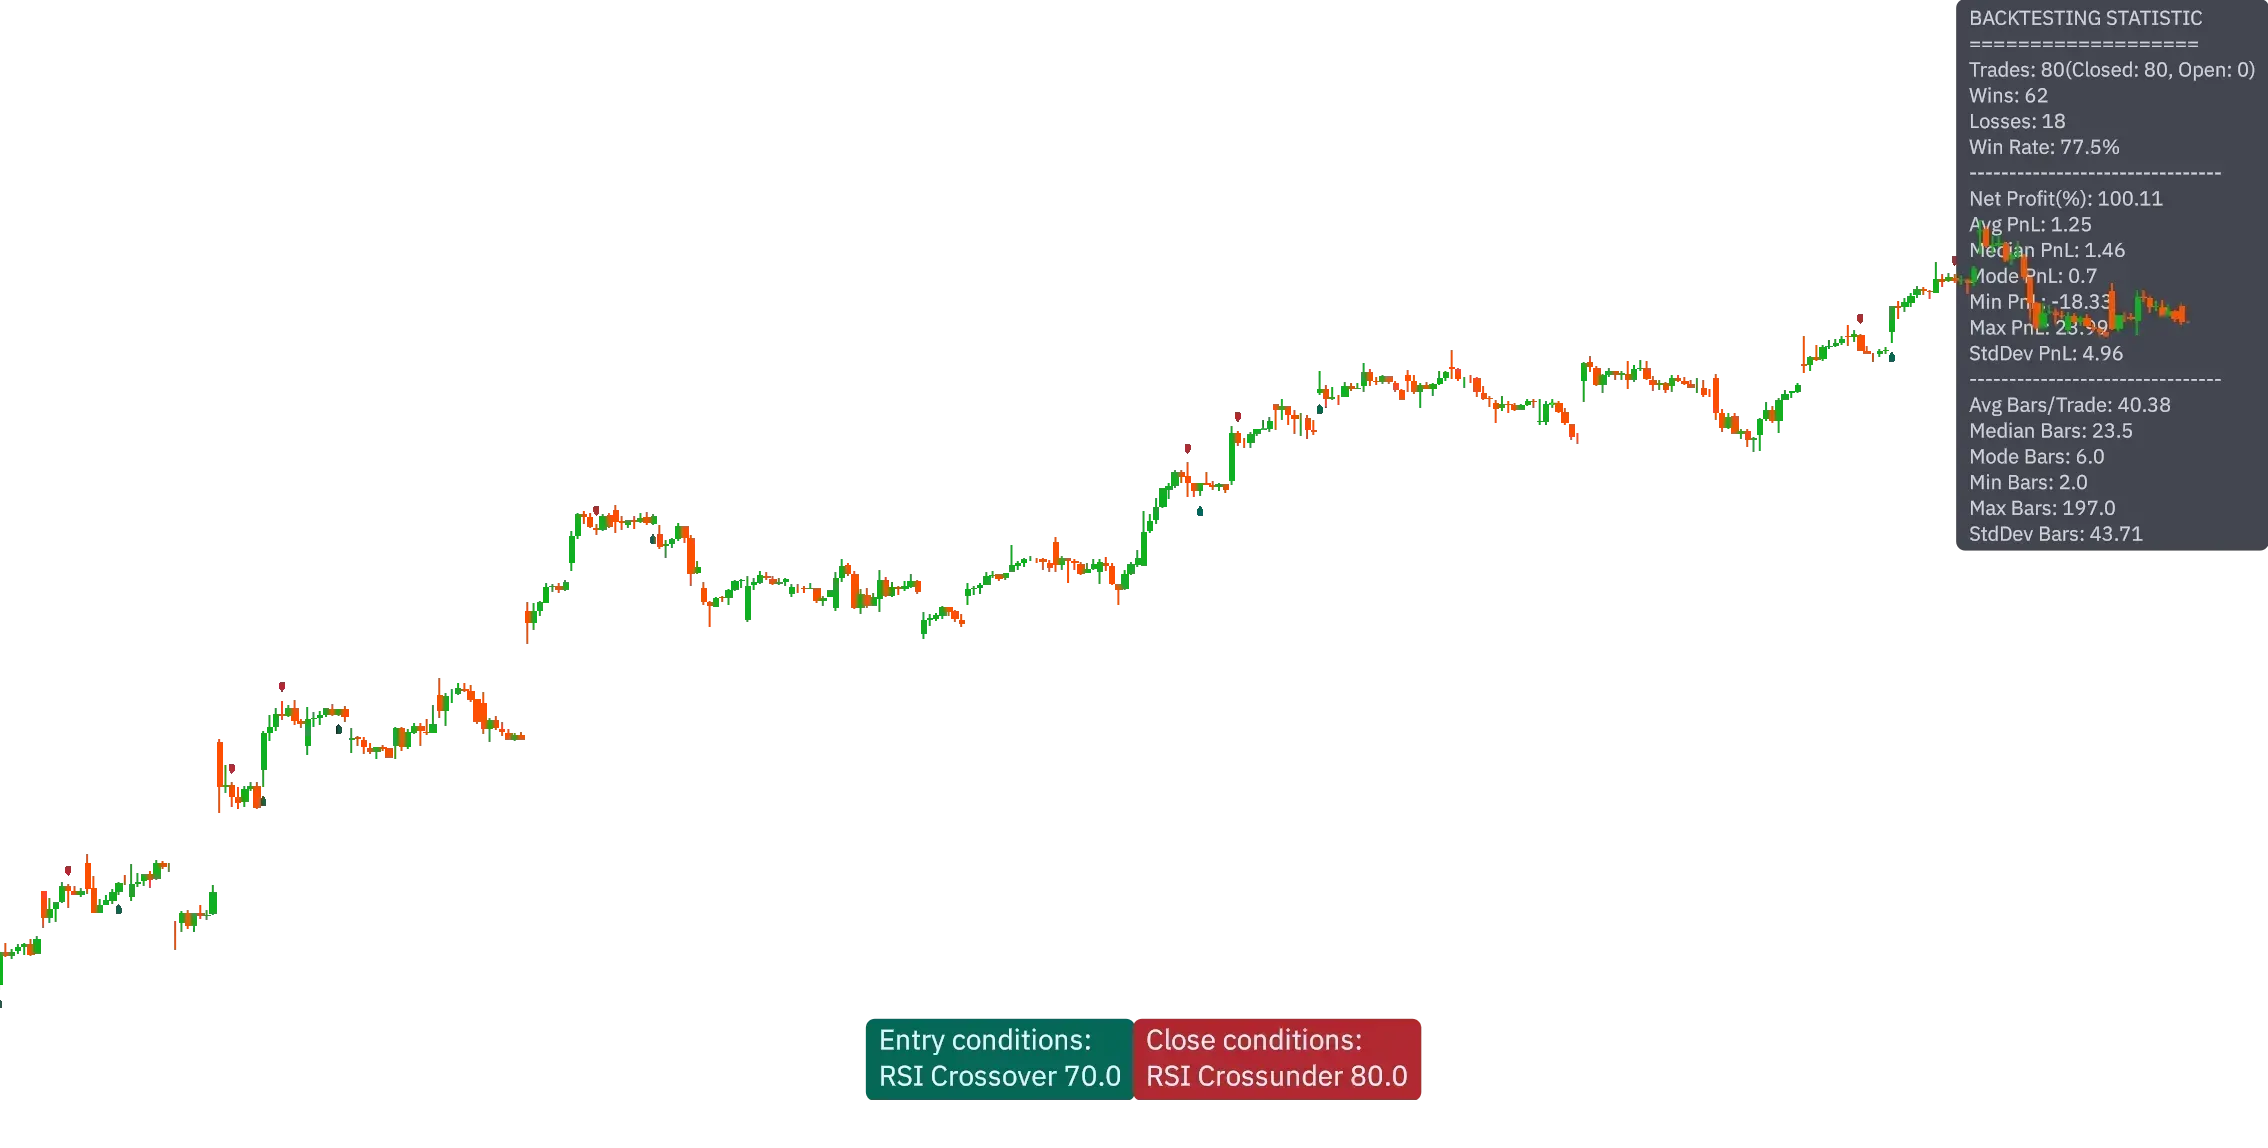
Overview Multi-Indicator Signal Builder  is a versatile, all-in-one script designed to streamline your trading workflow by combining multiple popular technical indicators under a single roof. It features a single-entry, single-exit logic, intrabar stop-l…
/indicator/multi-indicator-signal-builder-skyrexio-25
6EMAimage
6EMA
6EMA - Multiple Exponential Moving Averages 6 configurable EMA periods Features 6 fully configurable EMA periods (default: 9, 21, 50, 100, 200, 365) Individual toggle controls to show/hide each EMA Customizable source data (close, open, high, low, etc.)
/indicator/6ema-65
Nights Edgeimage
Nights Edge
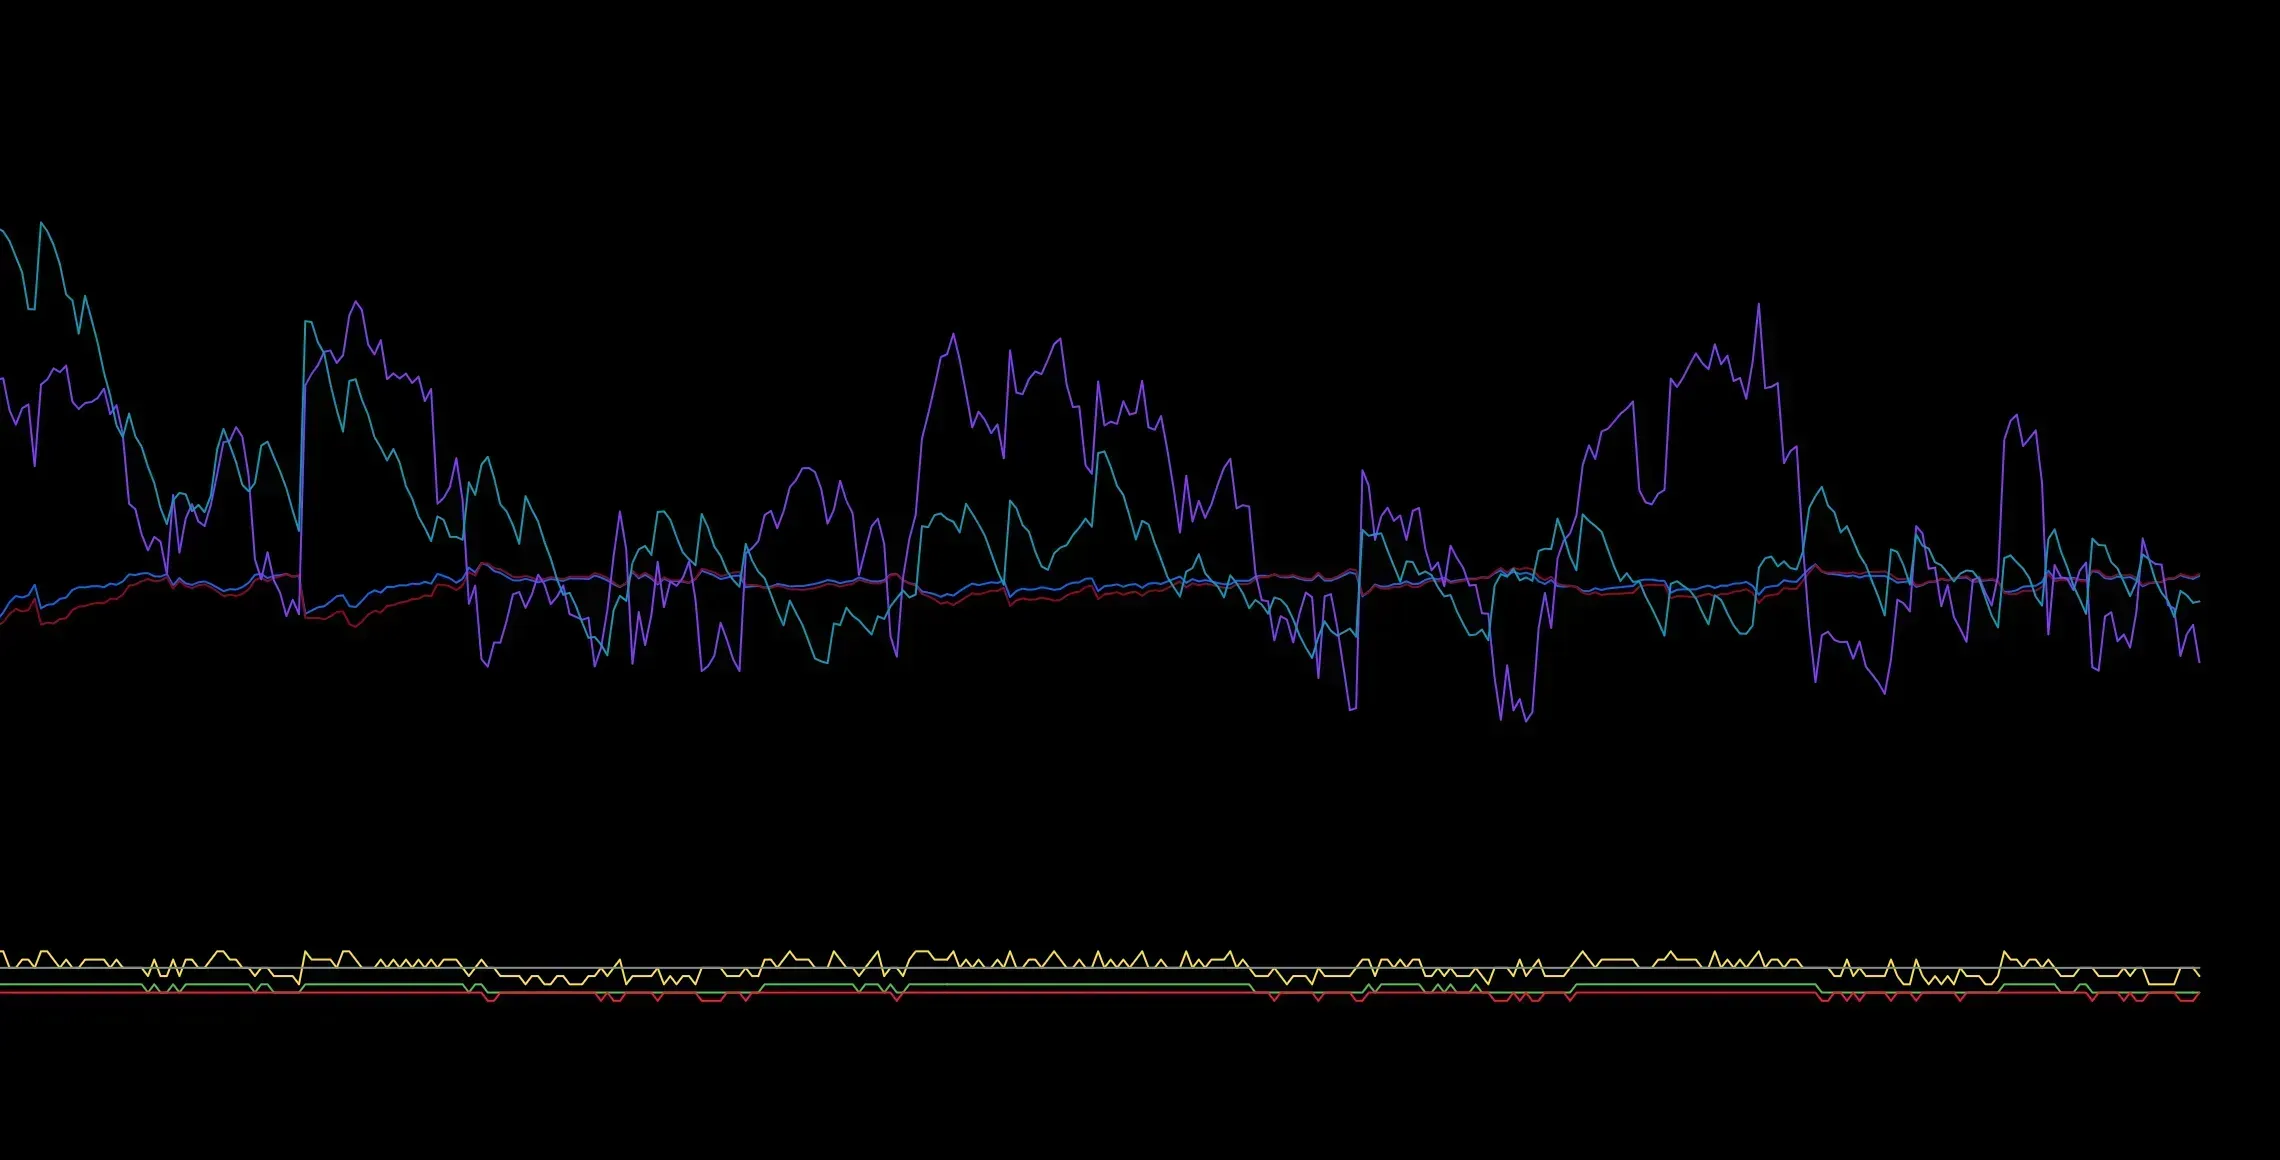
Nights Edge: The All-In-One Trend & Momentum System. Trade with clarity, not clutter. Nights Edge is a comprehensive trading suite that consolidates trend analysis, momentum signals, and volume context into a single, high-performance interface. After 18…
/indicator/nights-edge-99
Klinger Oscillator For Crypto Enhanced by Ze4everimage
Klinger Oscillator For Crypto Enhanced by Ze4ever
This script is an enhanced version of the classic Klinger Oscillator, specially optimised for scalping in the crypto markets. Developed by Ze4ever, it improves trend detection by adjusting EMA parameters and volume calculations to better capture short-te…
/indicator/klinger-oscillator-for-crypto-enhanced-by-ze4ever-98
Pivot Points High/Low (Simplified)image
Pivot Points High/Low (Simplified)
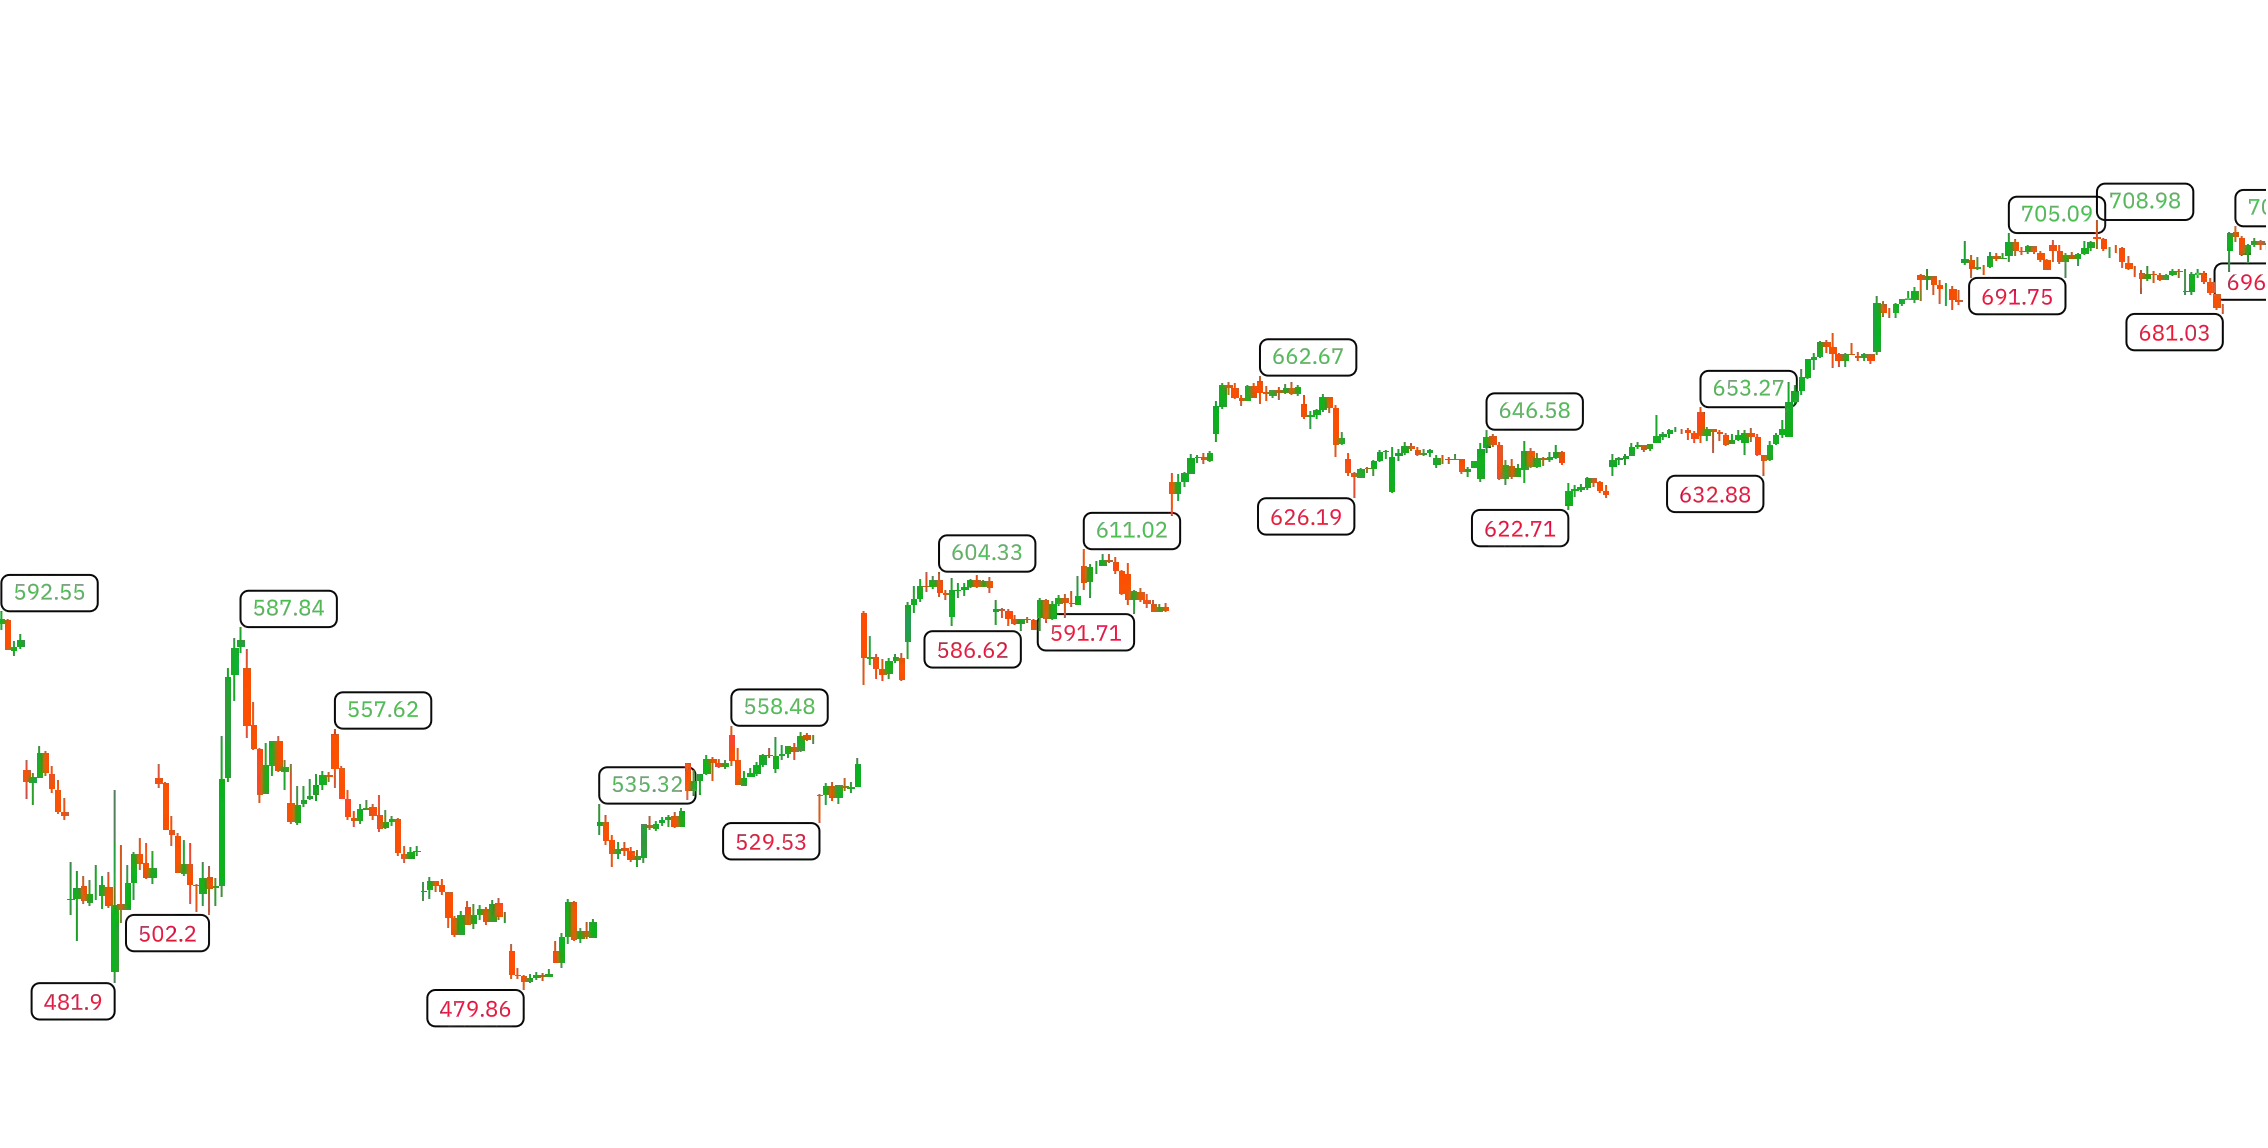
How to Create a Pivot Points High/Low Indicator Using Drawings Indie  5.4.0  introduced powerful drawings  functionality — the ability to draw objects on charts that are not tied to time series. Let's step-by-step create an indicator to find local extre…
/indicator/pivot-points-high-low-simplified-46
Bitcoin Sine Wave Power Law Modelimage
Bitcoin Sine Wave Power Law Model
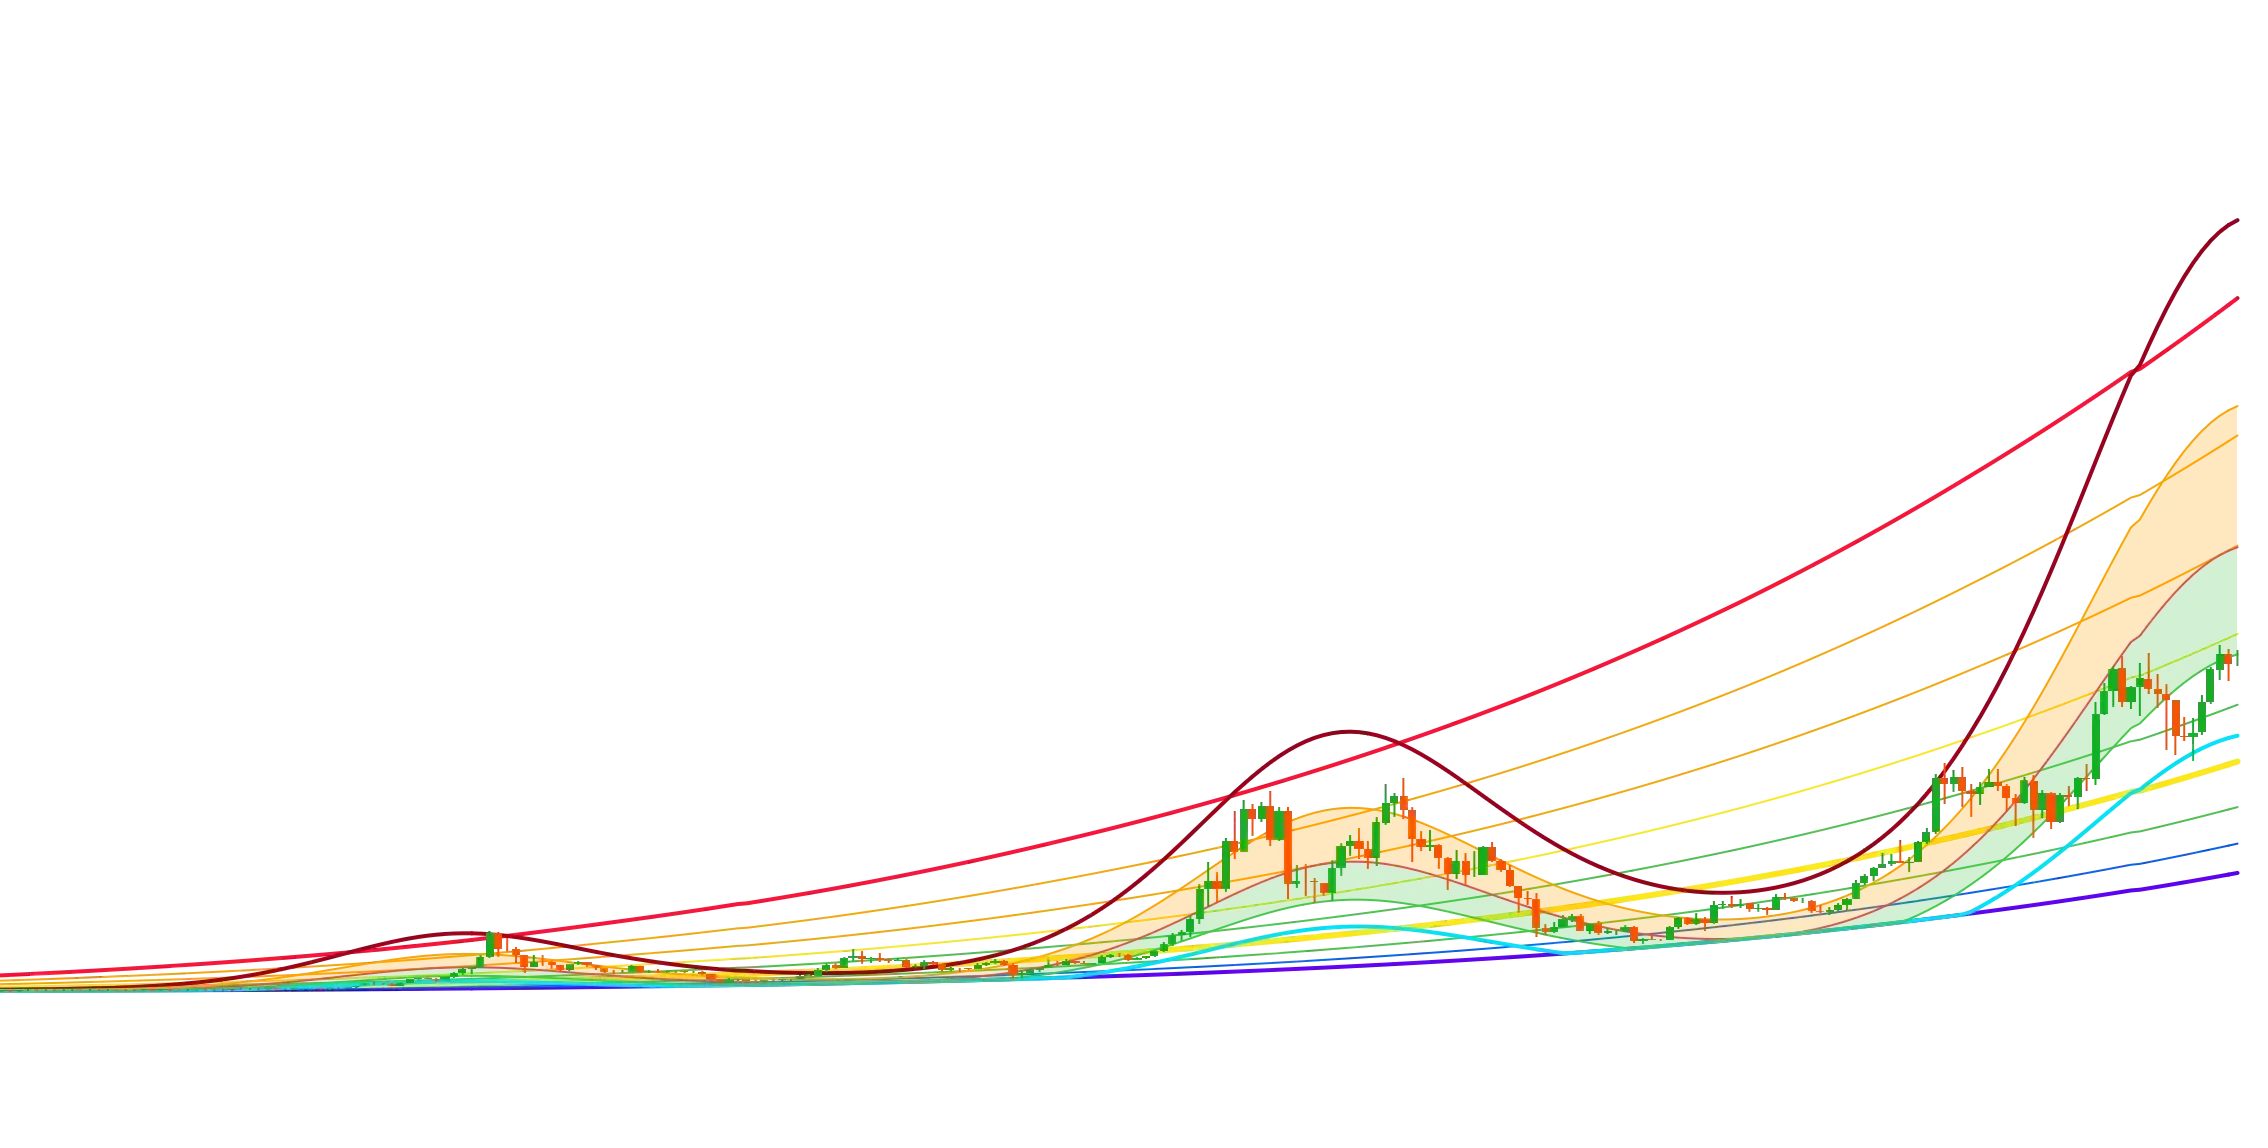
Based on the " Bitcoin Rainbow Wave" indicator by leoum on Tradingview ( https://www.tradingview.com/script/v0nW85bF-Bitcoin-Rainbow-Wave/ ). Intended for medium to long term use on the log scale BTCUSD chart.  The indicator displays the power law model …
/indicator/bitcoin-sine-wave-power-law-model-53