The Active Traders
Community

Explore custom indicators, screeners, and insights from traders who trade the
markets every day

Community Indicators image

Community Indicators

Indicator sessionsimage
Indicator sessions
Arrêtez de deviner quelle session de marché est actuellement active. Trading Sessions Indicator vous permet de visualiser directement sur votre graphique les principales sessions Forex : Sydney, Tokyo, Londres et New York . L’indicateur colore automat…
/indicator/indicator-sessions-7
Zalen WaveTrend Overlayimage
Zalen WaveTrend Overlay
Zalen WaveTrend Overlay is a clean momentum and trend visualization tool designed to bring WaveTrend-style market structure directly onto the price chart. Instead of relying on a separate oscillator pane, the indicator translates momentum and trend cond…
/indicator/zalen-wavetrend-overlay-53
Zalen EMA Trend Cloudimage
Zalen EMA Trend Cloud
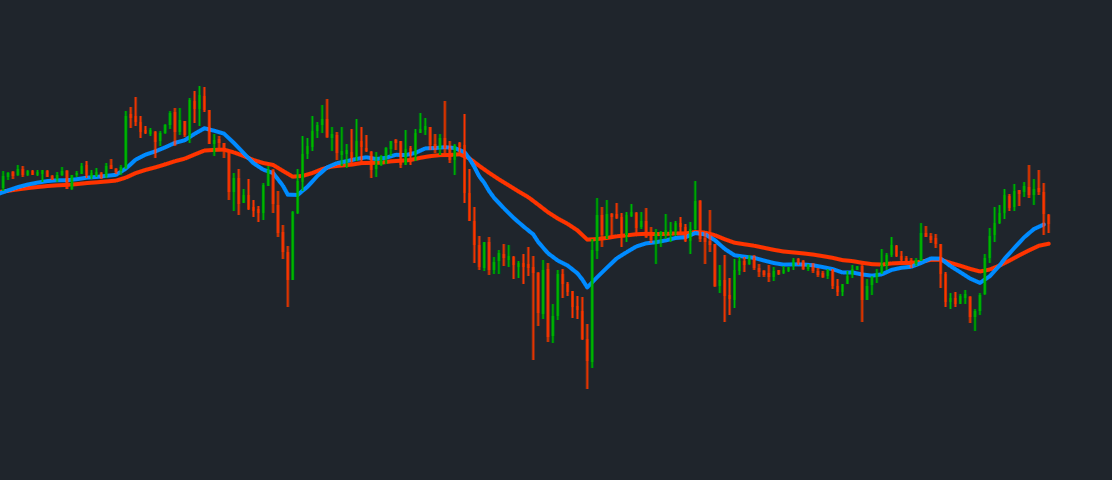
Zalen EMA Trend Cloud is a clean trend-following overlay designed to make market direction instantly readable without cluttering your chart. The indicator combines three configurable exponential moving averages — 50, 100 and 200 EMA by default — into a …
/indicator/zalen-ema-trend-cloud-59
Lawrence Horizon Trackerimage
Lawrence Horizon Tracker
Lawrence Horizon Tracker is a dynamic trend-following indicator designed to spot high-probability entries. It combines Fast (9) and Slow (21) Simple Moving Average crossovers with a 200 Exponential Moving Average trend filter. Bullish BUY and Bearish SE…
/indicator/lawrence-horizon-tracker-45
SMC-by-atif-bhaiimage
SMC-by-atif-bhai
Smart Money Concepts, Order block, FVG, Liquidity Sweeps, BoS, CHoCh, Premium and discount zones, Notifications. Here's how it all works: Detection logic ("perfect" OB) Bullish OB  — triggers when a strong bullish candle (body > avg_body × multiplier) br…
/indicator/smc-by-atif-bhai-78
ATR Adaptive ZigZagimage
ATR Adaptive ZigZag
ATR Adaptive ZigZag is a chart-overlay indicator for reading market structure across changing volatility conditions. It reduces small price fluctuations into a sequence of meaningful swing legs while preserving a live view of the move that is still devel…
/indicator/atr-adaptive-zigzag-20
Average True Range Stop Loss Finderimage
Average True Range Stop Loss Finder
This is a volatility-based stop-loss indicator that plots two dynamic price levels using the Average True Range (ATR): a High Stop above the market and a Low Stop below it. Instead of a fixed pip or point distance, the stop level automatically widens whe…
/indicator/average-true-range-stop-loss-finder-18
Struct Edge v1image
Struct Edge v1
Struct Edge [InsightEdge]  Market Structure is one of the core concepts in price action analysis, helping traders understand the underlying trend and identify potential shifts in market direction. This indicator automatically detects significant swing hi…
/indicator/struct-edge-v1-70
ICT Smart Money POI & Entry Suiteimage
ICT Smart Money POI & Entry Suite
ICT Smart Money POI & Entry Suite ICT Smart Money POI & Entry SuiteICT Smart Money POI & Entry Suite is an all-in-one chart overlay designed for traders who use ICT and Smart Money Concepts. It automatically maps market structure, liquidity, institutiona…
/indicator/ict-smart-money-poi-entry-suite-97
Confluence Power Scoreimage
Confluence Power Score
Confluence Power Score A confluence-based technical indicator that combines three complementary analysis factors into a single, easy-to-read score — so you don't have to watch multiple separate indicators on your chart. 📈 Trend — via a fast/slow EMA c…
/indicator/confluence-power-score-6
Session Assist v1image
Session Assist v1
Session Assist Session Assist is a lightweight trading session indicator designed to help traders visualize the three major forex trading sessions—Asia, London, and New York—directly on the chart. As each session unfolds, the indicator continuously track…
/indicator/session-assist-v1-72
Strong Entry Signal 1 min Bouhzilaimage
Strong Entry Signal 1 min Bouhzila
Strong Entry Signal: A Multi-Filter Approach to Trend-Based Entries Most traders' first encounter with technical analysis is a simple moving average crossover — when a fast average crosses a slow one, buy; when it crosses back, sell. It's intuitive, easy…
/indicator/strong-entry-signal-1-min-bouhzila-30
Community Screeners image

Community Screeners

Simple penniesimage
Simple pennies
Testing the platform out and will probably keep adding to the filters
simple-pennies-86
Undervalued Stocksimage
Undervalued Stocks
One more variation of screener with undervalued stocks
undervalued-stocks-33
High-Growth Companies with Strong Fundamentalsimage
High-Growth Companies with Strong Fundamentals
Screen for rapidly growing companies (15%+ revenue growth) with healthy financials and reasonable valuations.
high-growth-companies-with-strong-fundamentals-57
Peter Lynch Growth at Fair Priceimage
Peter Lynch Growth at Fair Price
A variation of Lynch's strategy focusing on profitable growing companies with strong financials.
peter-lynch-growth-at-fair-price-80
Magic Formula: Finding Quality Companies at Bargain Pricesimage
Magic Formula: Finding Quality Companies at Bargain Prices
Discover undervalued, high-quality stocks using Greenblatt's proven combination of strong ROIC and high earnings yield.
magic-formula-finding-quality-companies-at-bargain-prices-96
Community Posts image

Community Posts

Key Signal for Gold
On the 4-hour chart, the market is exhibiting a pattern of weak oscillation, indicating that it has not yet reached a state of severe oversold conditions and that further adjustment remains possible. If the price breaks above $4,077 and stabilizes, it could attract a return of buying interest, shifting focus to the overhead resistance zone between $4,195 and $4,135; conversely, a drop below $4,030 could open the way for a pullback toward the $3,950 or even the $3,920 level.
Key Signal for Gold
Federal Reserve Monetary Policy and U.S. Treasury Real Yields
Gold is a non-interest-bearing asset; holding it generates no fixed interest. Consequently, the real yield on U.S. Treasury bonds directly determines the opportunity cost of holding gold and serves as a key driver—either suppressing or boosting—gold prices in the short term.
Federal Reserve Monetary Policy and U.S. Treasury Real Yields
The pricing dynamics of the gold market are undergoing a structural shift.
The pricing dynamics of the gold market are undergoing a structural shift. The impact of the US-Iran conflict on gold prices is no longer a simple case of "safe-haven buying" driving up values; instead, it operates through a complex transmission chain: oil prices → inflation → Federal Reserve policy.
The pricing dynamics of the gold market are undergoing a structural shift.
$64,700 Remains Overhead Resistance for BTCimage
$64,700 Remains Overhead Resistance for BTC
In terms of price range, Bitcoin has fluctuated intraday between $61,794 and $63,063, yet the strength of the rebound remains limited. Previously, the price faced selling pressure above $64,200, subsequently pulling back rapidly toward the lower bound of the July trading range.
$64,700 Remains Overhead Resistance for BTC
Key Upcoming Events and Trading Signals for Goldimage
Key Upcoming Events and Trading Signals for Gold
Attention should focus on this week's CPI inflation data and whether shipping disruptions in the Strait of Hormuz escalate. Gold has a chance to reclaim the $4,091–$4,123 resistance zone only if CPI data falls short of expectations, driving real yields lower; conversely, if oil prices surge again, the market will remain focused on inflation concerns and the Federal Reserve's future policy moves.
Key Upcoming Events and Trading Signals for Gold
Key Signal Analysis
Gold prices have held the $4,000–$4,021 support zone and reclaimed positions above both the 50-period moving average ($4,021.55) and the 100-period moving average ($4,038.93), allowing the bulls to regain the short-term technical advantage.
Key Signal Analysis
The pricing logic of the gold market is undergoing a structural shift.
The pricing logic of the gold market is undergoing a structural shift. The impact of the US-Iran conflict on gold prices is no longer a simple case of "safe-haven buying driving up prices"; instead, it operates through a complex transmission chain: oil prices → inflation → Federal Reserve policy.
The pricing logic of the gold market is undergoing a structural shift.
The downward trend in the market is unlikely to change.image
The downward trend in the market is unlikely to change.
Overall, the cooling of CPI has temporarily brought about a short-term technical rebound in gold prices. However, the hawkish stance of the Federal Reserve and the dual pressure of inflation risks in the Middle East remain, so gold has not yet entered a sustained bullish trend. In the short term, it should be viewed as a range-bound market.
The downward trend in the market is unlikely to change.
Do not blindly bet on a decline going forward.image
Do not blindly bet on a decline going forward.
Monday's short-term trend continued its downward trend. We can consider shorting again when the price rebounds and encounters resistance. The key resistance level to watch is around 4080-4090. The first support level to watch is the 4000 level, and the stronger support level is the 3950 level.Tomorrow, Tuesday, the CPI will be the key turning point this week. If inflation is higher than expected, gold prices will likely continue to test the support level of 3950. However, once inflation cools down significantly, the bulls are expected to rebound and retest the 4120 level.Currently, gold is experiencing a weak and volatile market dominated by negative interest rate factors and escalating geopolitical tensions. It is unlikely that the bulls will be able to completely reverse the trend in the short term. Therefore, the direction of the trend will need to be confirmed after the release of US inflation data this week.
Do not blindly bet on a decline going forward.
Continue to short gold on rebounds
In terms of trends: Gold is more likely to fall than rise, the downward trend remains unchanged, and the price is well below the 200-day moving average, indicating that short-term bearish forces are in control.
Continue to short gold on rebounds
SMC SNIPER 5
# indie:lang_version = 5 from math import nan, isnan from indie import indicator, param, color, plot, MainContext, Optional, line_style, Color, Var from indie.algorithms import Atr, PivotHighLow from indie.drawings import LabelAbs, LineSegment, Rectangle, AbsolutePosition, callout_position from indie.color import rgba
SMC SNIPER 5
Crosshair lock
I ask this to your ai if you have this feature and it suggested me to suggest it to the takeprofit team.
Crosshair lock
The daily chart structure indicates that gold remains in a state of weak rebalancing.image
The daily chart structure indicates that gold remains in a state of weak rebalancing.
From a technical perspective, following the pullback from the high of $4,382, the subsequent rebound peaked at $4,202, marking a clear pattern of lower highs. The current price sits below the Bollinger Bands' middle rail at $4,122; with the middle rail itself trending downward, this signals a continuing decline in the medium-term equilibrium price. The lower Bollinger Band lies at $3,932, while recent lows have appeared near $3,944 and $3,984, establishing the $3,950–$4,000 range as a zone of high price activity frequently tested by the market.
The daily chart structure indicates that gold remains in a state of weak rebalancing.
Geopolitical Conflict and the Indirect Bearish Transmission to Crude Oil Prices
An escalation in geopolitical conflict does not necessarily lead to a rise in gold prices. When Middle East tensions directly drive up crude oil prices, a chain reaction bearish for gold is triggered: escalation of US-Iran conflict → disruption of shipping in the Strait of Hormuz and a surge in crude oil prices → a rebound in energy inflation expectations → strengthened expectations of Federal Reserve rate hikes → a rise in US Treasury real yields → increased holding costs for gold → institutional reduction of long positions in gold.
Geopolitical Conflict and the Indirect Bearish Transmission to Crude Oil Prices
Gold Trend Analysis and Trading Signalsimage
Gold Trend Analysis and Trading Signals
Based on the 4-hour chart, the short-term downward momentum in gold may pause, leading to a rebound as the market battles around the $4,000 level. To sustain this, the price needs to hold the support zone near $4,023–$4,045, while the trend line area of ​​$4,097–$4,126 remains a zone of strong resistance.
Gold Trend Analysis and Trading Signals
SMC SNIPER 5
# indie:lang_version = 5 from math import nan, isnan from indie import indicator, param, color, plot, MainContext, Optional, line_style, Color, Var from indie.algorithms import Atr, PivotHighLow from indie.drawings import LabelAbs, LineSegment, Rectangle, AbsolutePosition, callout_position from indie.color import rgba
SMC SNIPER 5
Crosshair lock
I ask this to your ai if you have this feature and it suggested me to suggest it to the takeprofit team.
Crosshair lock
Key Signal for Gold
On the 4-hour chart, the market is exhibiting a pattern of weak oscillation, indicating that it has not yet reached a state of severe oversold conditions and that further adjustment remains possible. If the price breaks above $4,077 and stabilizes, it could attract a return of buying interest, shifting focus to the overhead resistance zone between $4,195 and $4,135; conversely, a drop below $4,030 could open the way for a pullback toward the $3,950 or even the $3,920 level.
Key Signal for Gold
Key Signal Analysis
Gold prices have held the $4,000–$4,021 support zone and reclaimed positions above both the 50-period moving average ($4,021.55) and the 100-period moving average ($4,038.93), allowing the bulls to regain the short-term technical advantage.
Key Signal Analysis
The daily chart structure indicates that gold remains in a state of weak rebalancing.image
The daily chart structure indicates that gold remains in a state of weak rebalancing.
From a technical perspective, following the pullback from the high of $4,382, the subsequent rebound peaked at $4,202, marking a clear pattern of lower highs. The current price sits below the Bollinger Bands' middle rail at $4,122; with the middle rail itself trending downward, this signals a continuing decline in the medium-term equilibrium price. The lower Bollinger Band lies at $3,932, while recent lows have appeared near $3,944 and $3,984, establishing the $3,950–$4,000 range as a zone of high price activity frequently tested by the market.
The daily chart structure indicates that gold remains in a state of weak rebalancing.
Federal Reserve Monetary Policy and U.S. Treasury Real Yields
Gold is a non-interest-bearing asset; holding it generates no fixed interest. Consequently, the real yield on U.S. Treasury bonds directly determines the opportunity cost of holding gold and serves as a key driver—either suppressing or boosting—gold prices in the short term.
Federal Reserve Monetary Policy and U.S. Treasury Real Yields
The pricing logic of the gold market is undergoing a structural shift.
The pricing logic of the gold market is undergoing a structural shift. The impact of the US-Iran conflict on gold prices is no longer a simple case of "safe-haven buying driving up prices"; instead, it operates through a complex transmission chain: oil prices → inflation → Federal Reserve policy.
The pricing logic of the gold market is undergoing a structural shift.
Geopolitical Conflict and the Indirect Bearish Transmission to Crude Oil Prices
An escalation in geopolitical conflict does not necessarily lead to a rise in gold prices. When Middle East tensions directly drive up crude oil prices, a chain reaction bearish for gold is triggered: escalation of US-Iran conflict → disruption of shipping in the Strait of Hormuz and a surge in crude oil prices → a rebound in energy inflation expectations → strengthened expectations of Federal Reserve rate hikes → a rise in US Treasury real yields → increased holding costs for gold → institutional reduction of long positions in gold.
Geopolitical Conflict and the Indirect Bearish Transmission to Crude Oil Prices
The pricing dynamics of the gold market are undergoing a structural shift.
The pricing dynamics of the gold market are undergoing a structural shift. The impact of the US-Iran conflict on gold prices is no longer a simple case of "safe-haven buying" driving up values; instead, it operates through a complex transmission chain: oil prices → inflation → Federal Reserve policy.
The pricing dynamics of the gold market are undergoing a structural shift.
The downward trend in the market is unlikely to change.image
The downward trend in the market is unlikely to change.
Overall, the cooling of CPI has temporarily brought about a short-term technical rebound in gold prices. However, the hawkish stance of the Federal Reserve and the dual pressure of inflation risks in the Middle East remain, so gold has not yet entered a sustained bullish trend. In the short term, it should be viewed as a range-bound market.
The downward trend in the market is unlikely to change.
Gold Trend Analysis and Trading Signalsimage
Gold Trend Analysis and Trading Signals
Based on the 4-hour chart, the short-term downward momentum in gold may pause, leading to a rebound as the market battles around the $4,000 level. To sustain this, the price needs to hold the support zone near $4,023–$4,045, while the trend line area of ​​$4,097–$4,126 remains a zone of strong resistance.
Gold Trend Analysis and Trading Signals
$64,700 Remains Overhead Resistance for BTCimage
$64,700 Remains Overhead Resistance for BTC
In terms of price range, Bitcoin has fluctuated intraday between $61,794 and $63,063, yet the strength of the rebound remains limited. Previously, the price faced selling pressure above $64,200, subsequently pulling back rapidly toward the lower bound of the July trading range.
$64,700 Remains Overhead Resistance for BTC
Do not blindly bet on a decline going forward.image
Do not blindly bet on a decline going forward.
Monday's short-term trend continued its downward trend. We can consider shorting again when the price rebounds and encounters resistance. The key resistance level to watch is around 4080-4090. The first support level to watch is the 4000 level, and the stronger support level is the 3950 level.Tomorrow, Tuesday, the CPI will be the key turning point this week. If inflation is higher than expected, gold prices will likely continue to test the support level of 3950. However, once inflation cools down significantly, the bulls are expected to rebound and retest the 4120 level.Currently, gold is experiencing a weak and volatile market dominated by negative interest rate factors and escalating geopolitical tensions. It is unlikely that the bulls will be able to completely reverse the trend in the short term. Therefore, the direction of the trend will need to be confirmed after the release of US inflation data this week.
Do not blindly bet on a decline going forward.
Key Upcoming Events and Trading Signals for Goldimage
Key Upcoming Events and Trading Signals for Gold
Attention should focus on this week's CPI inflation data and whether shipping disruptions in the Strait of Hormuz escalate. Gold has a chance to reclaim the $4,091–$4,123 resistance zone only if CPI data falls short of expectations, driving real yields lower; conversely, if oil prices surge again, the market will remain focused on inflation concerns and the Federal Reserve's future policy moves.
Key Upcoming Events and Trading Signals for Gold
Continue to short gold on rebounds
In terms of trends: Gold is more likely to fall than rise, the downward trend remains unchanged, and the price is well below the 200-day moving average, indicating that short-term bearish forces are in control.
Continue to short gold on rebounds