Advanced
Trading Charts
The charting tool for consistent real-time technical analysis — engineered for speed, stability, and heavy setups.


GPU-Accelerated
Experience near-zero rendering delay even under extreme market volatility. Maintain a smooth, stable charting experience — no matter how many indicators you stack.
Full Control
Analyze the market with a centralized object tree. Group, lock, or hide indicators and drawings to maintain focus on the setups that actually matter.
Multicharts
Sync symbols, timeframes, and indicators across multiple advanced charts simultaneously. Maintain a unified market perspective without manual switching.
Analysis to Trading
The gap between analysis and execution is where trades are lost. Your charts, indicators, alerts, and risk management now live in a single, high-performance terminal.
Explore Trading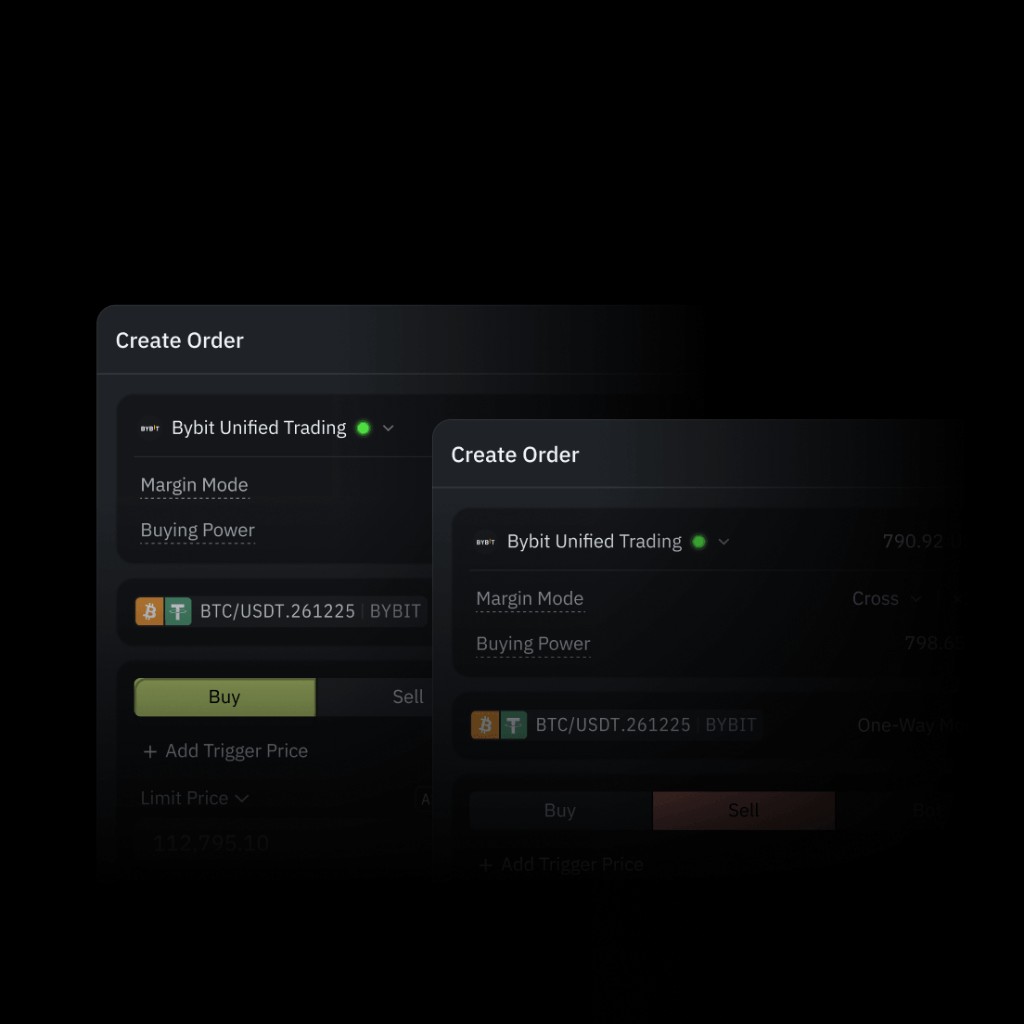
Unified Order Execution
Route your exchange API directly into the terminal. Execute and manage live structural order flow from a single, low-latency execution workspace.
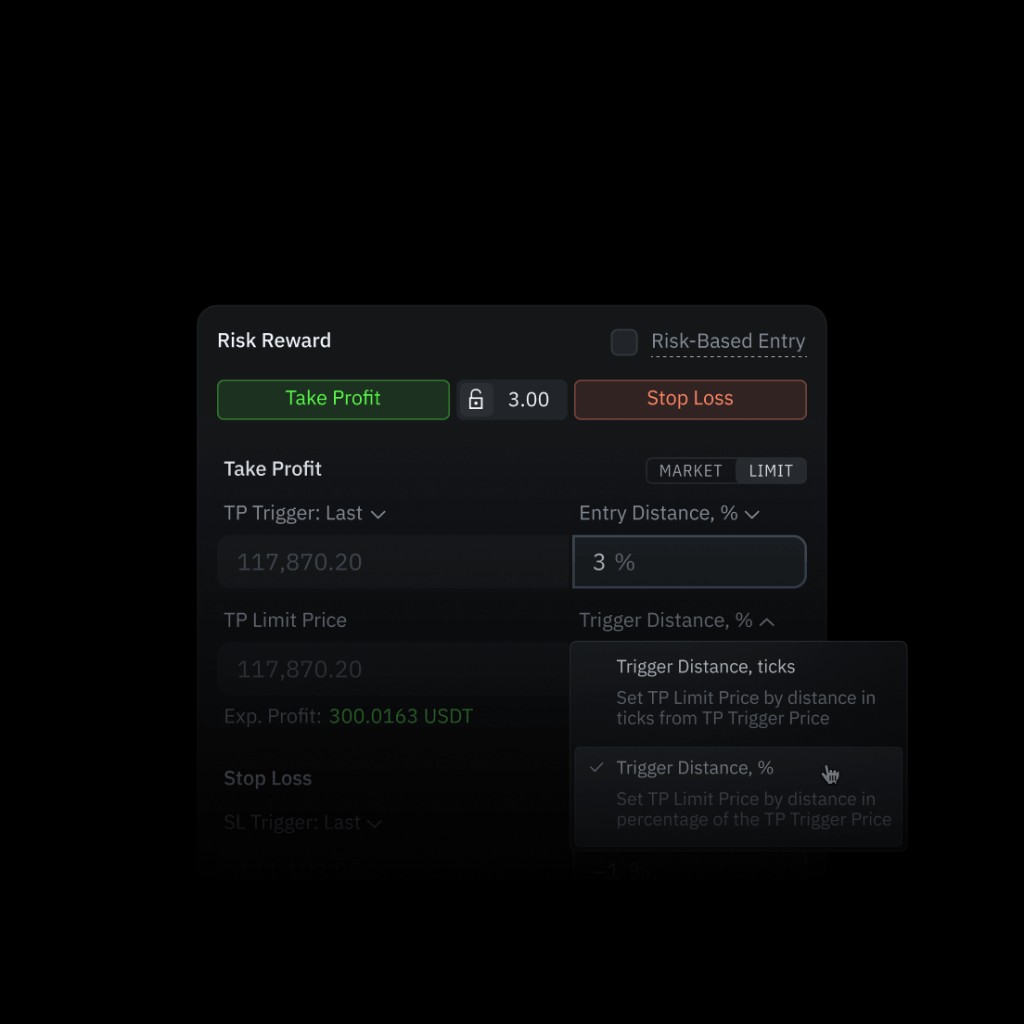
Trade & Get Cashback
Trading rewards paid directly by TakeProfit. The more you trade, the more you earn with up to 50% cashback on your trading fees.
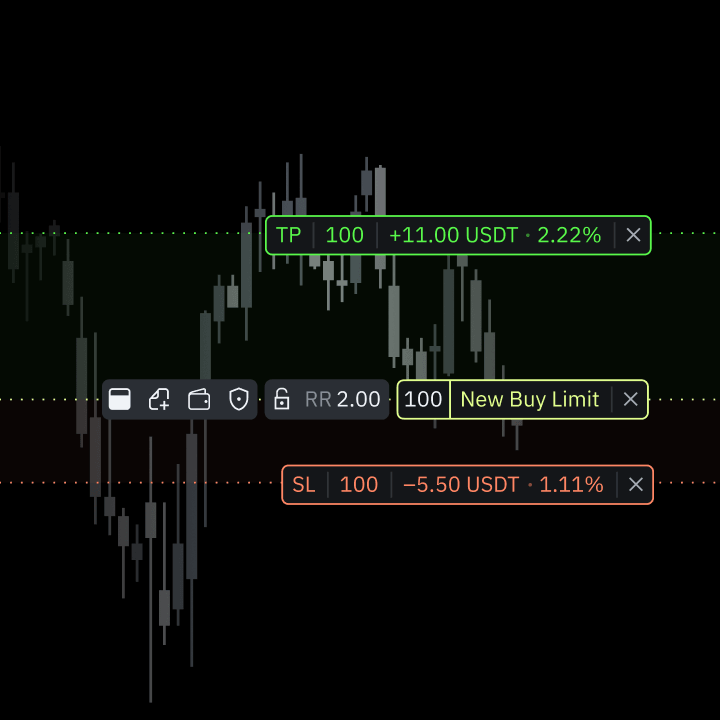
Drag & Drop Orders
Execute directly on the chart. Drag and drop resting limit orders, visually adjust stop parameters, and manage active risk without switching interfaces.
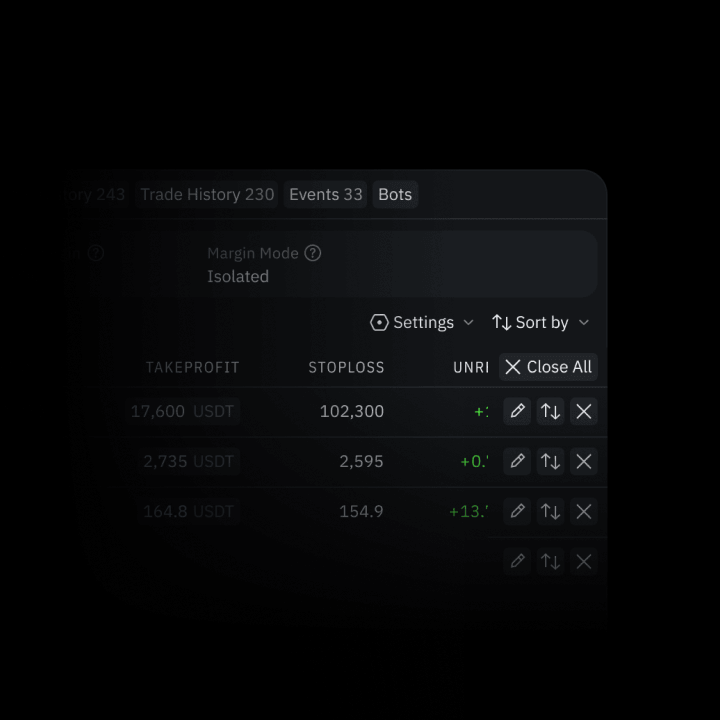
Position Control
Manage active structural risk in real-time. Adjust live orders, scale into existing setups, reduce exposure, or flatten positions without breaking your workflow.
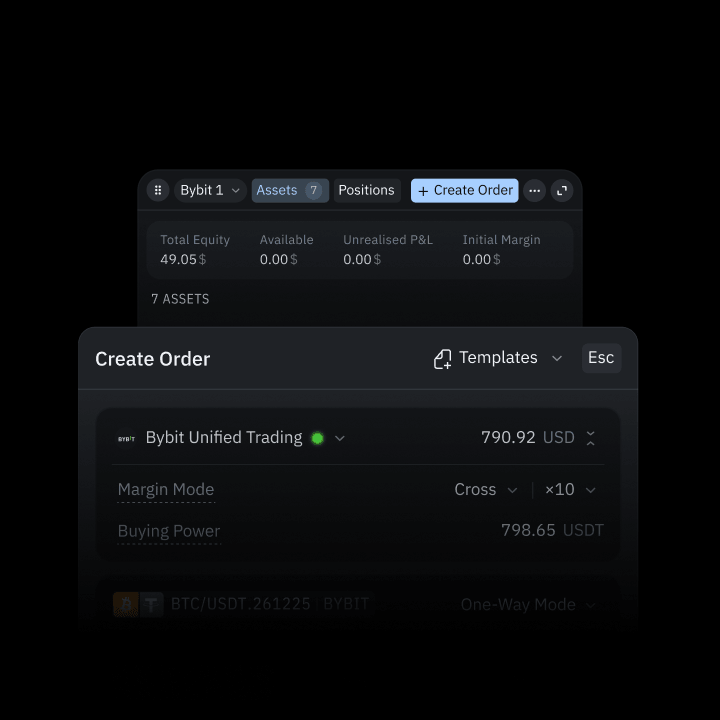
Account & Buying Power
Monitor live margin directly within the execution module. Track available buying power, active leverage limits, and total equity while routing your active orders.
Cloud Indicators
A complete set of built-in indicators, custom Indie® strategies, and automated backtesting — all running in the cloud.
Explore Indicators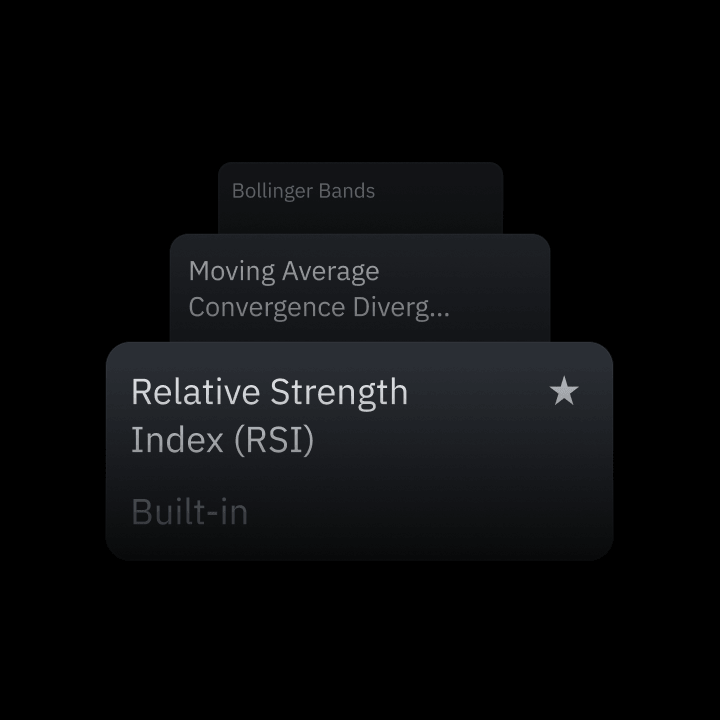
80 Native Indicators
Discover a set of technical indicators covering trend, momentum, volatility, and market structure — ready to use or extend.

Indie® Scripting
Build custom indicators and strategies with Python-based syntax. Fully integrated with the terminal and optimized for cloud execution.
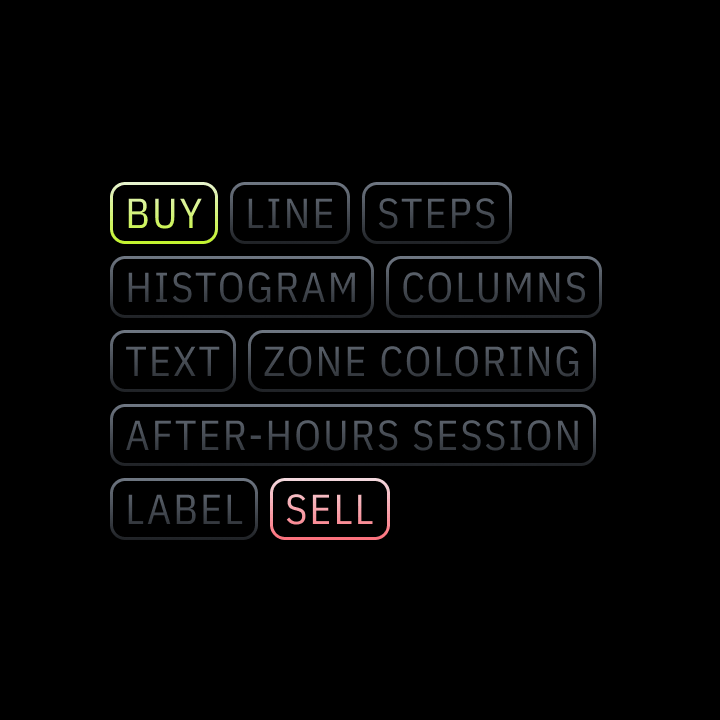
Visualization Tools
Beyond basic plots. Deploy signal markers, background highlights, and automated fills to visualize the market structure as you want.
AI-Powered MCP Integration
Connect Indie® to your AI workflow. Write, convert, and audit logic with AI-powered precision to iterate faster.
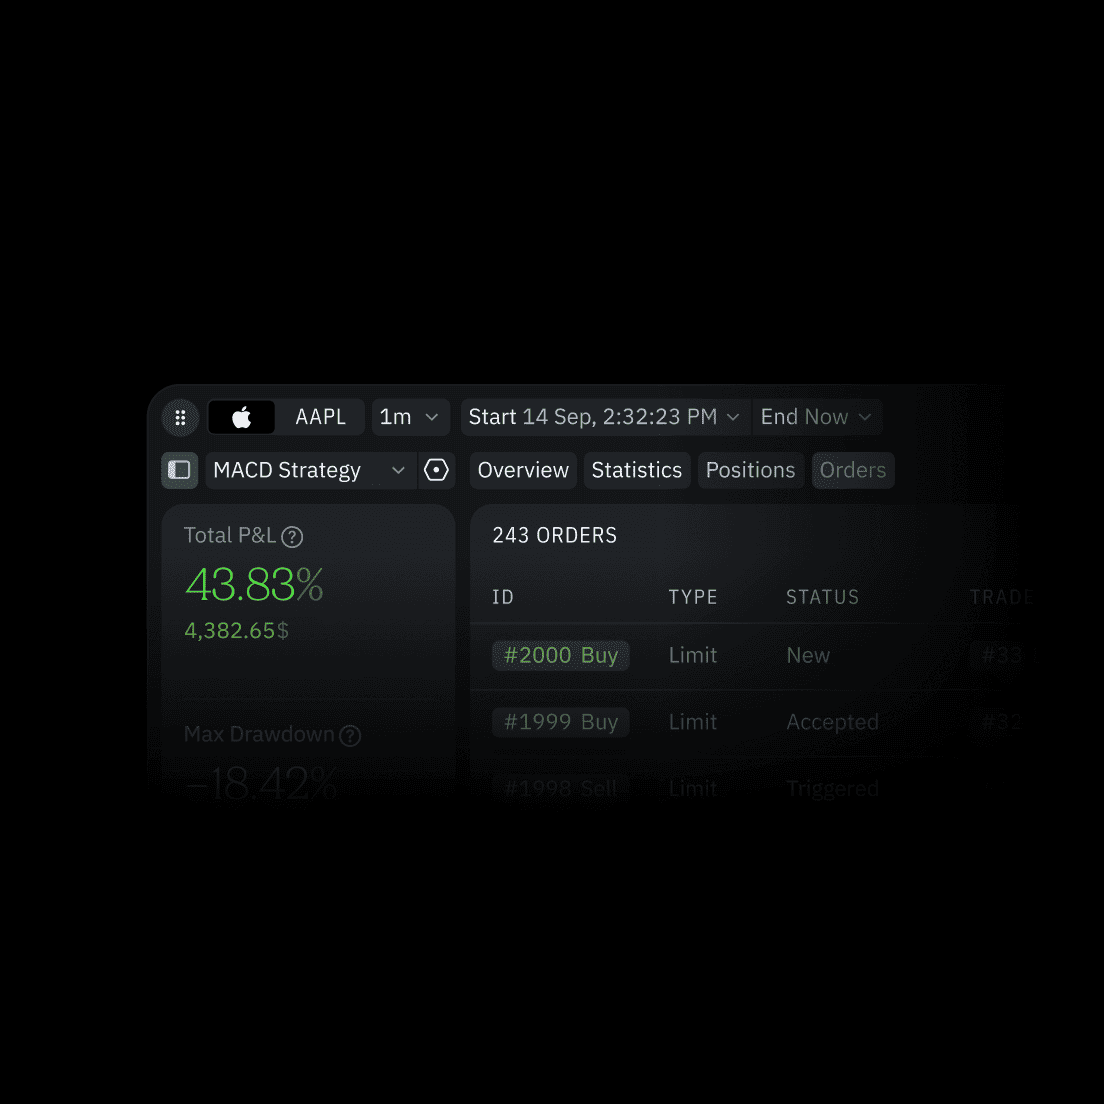
Backtesting
Validate strategies against historical market data. Fine-tune your trading logic and verify performance before going live.
Cloud Trading Alerts
Multi-conditional Trading Alerts. Monitor price action, liquidity shifts, and custom Indie® scripts 24/7 without keeping your browser open.
Explore Alerts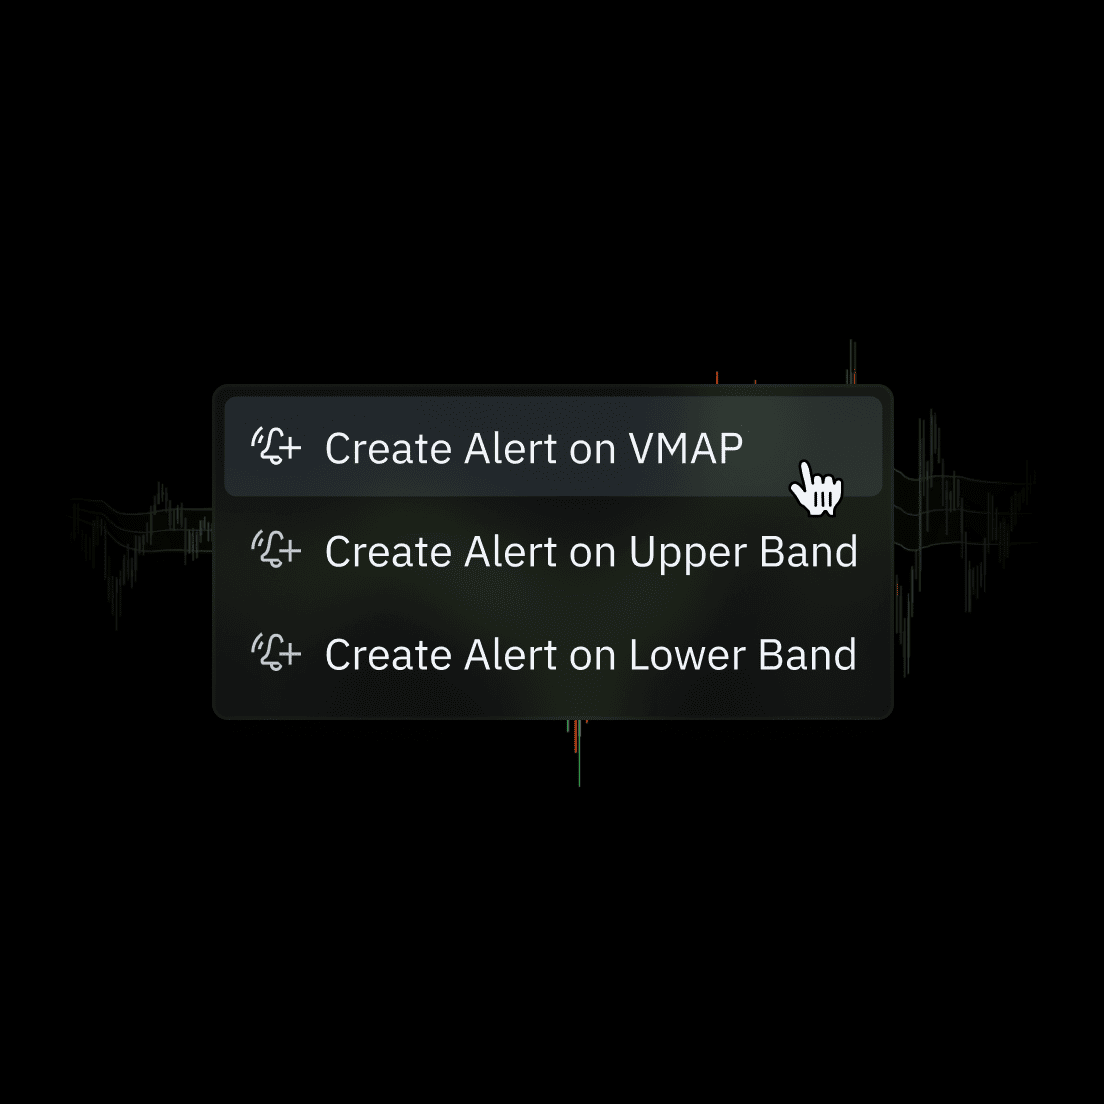
Indicator-Based Alerts
Deploy alerts on both native tools and custom Indie® scripts. Combine multiple indicator plots into a single alert. Supports 80 built-in technical analysis tools.
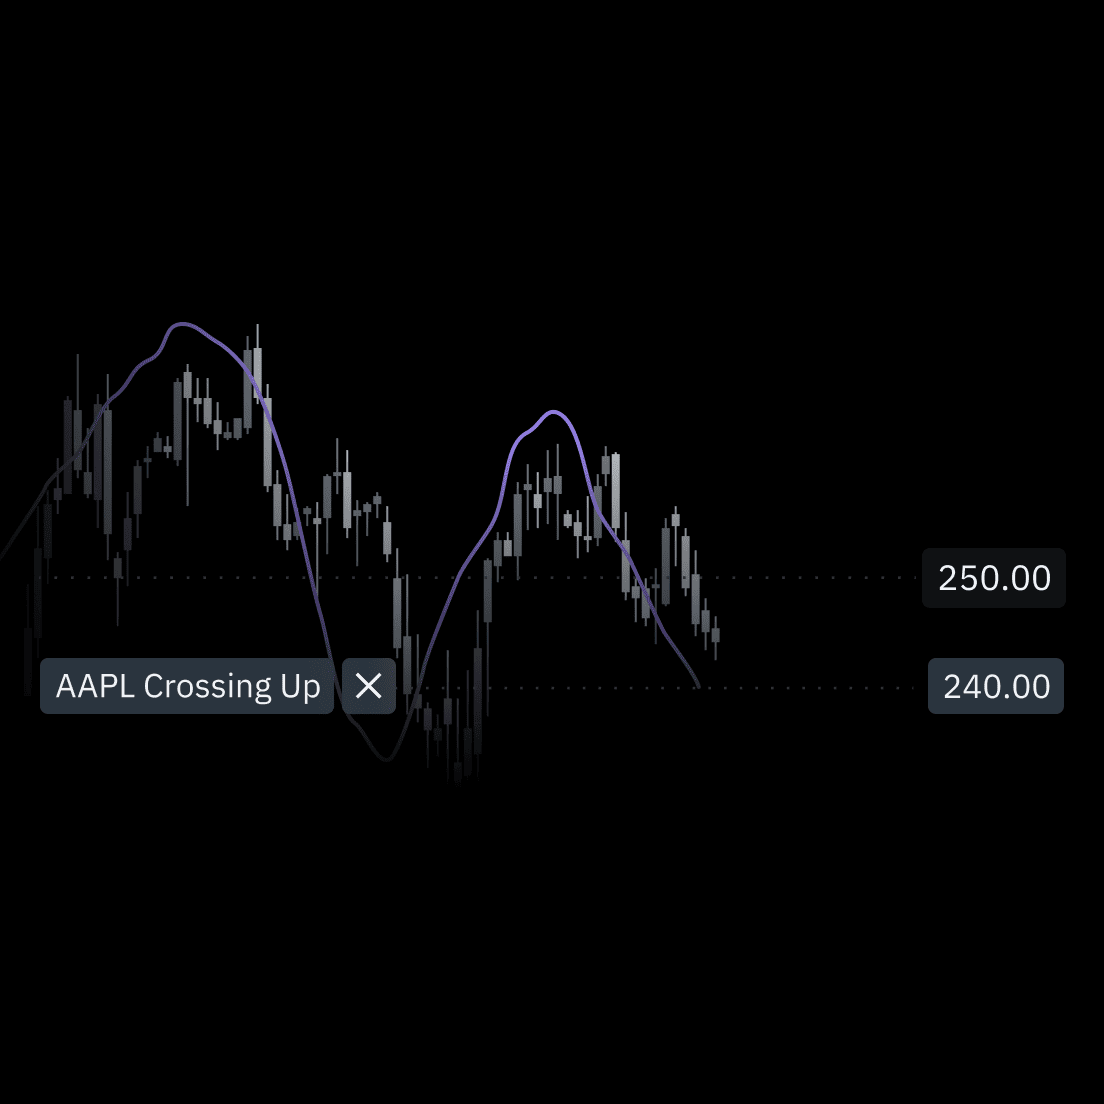
Price-Based Alerts
Trigger on specific price crosses, breakouts, or retests. Monitor percentage moves and volatility spikes in real-time. Detect market activity and liquidity shifts when they happen.
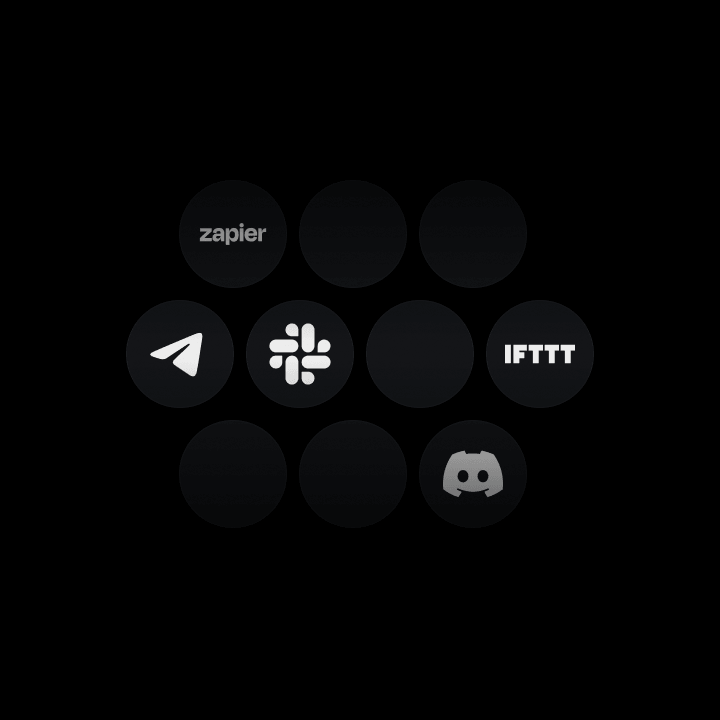
Webhooks
Send alerts to any API. Automate execution, logging, or notifications across your stack.
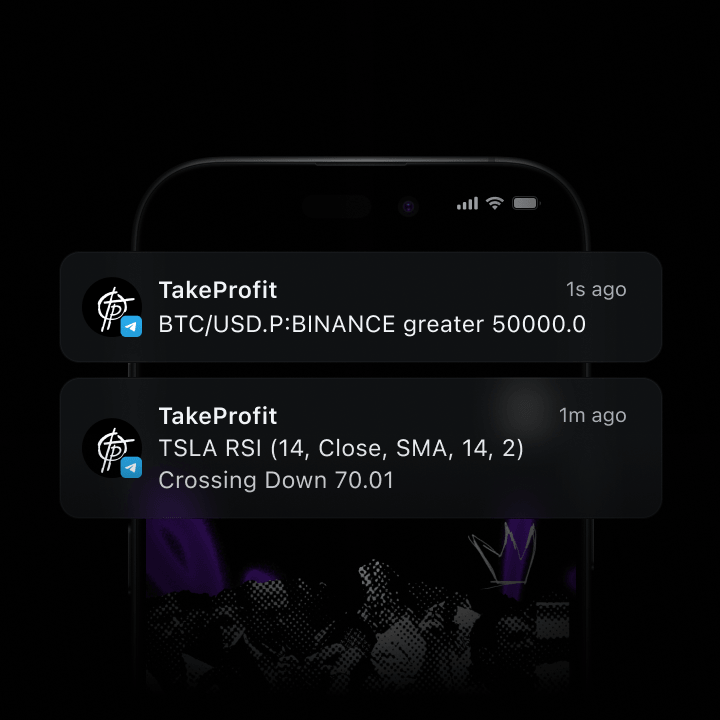
Telegram
Directly to your private channels or bots. Stay on the top of the market, anywhere.
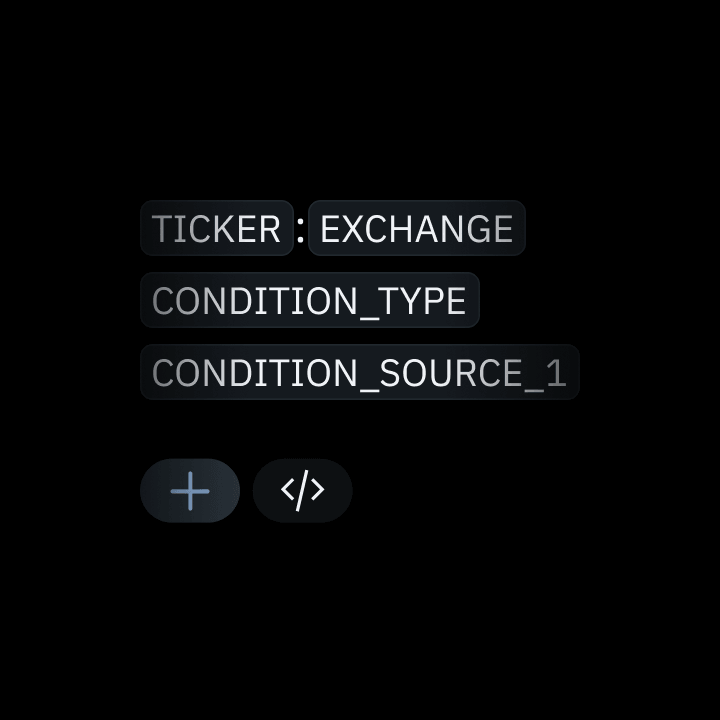
Dynamic Alert Messages
Execution-ready JSON payloads with live variables — ticker, OHLC, triggers, and more.
Drawing Tools
A professional toolkit for every major technical analysis methodology. Deploy everything from Fibonacci to advanced patterns with precision.
Measurement
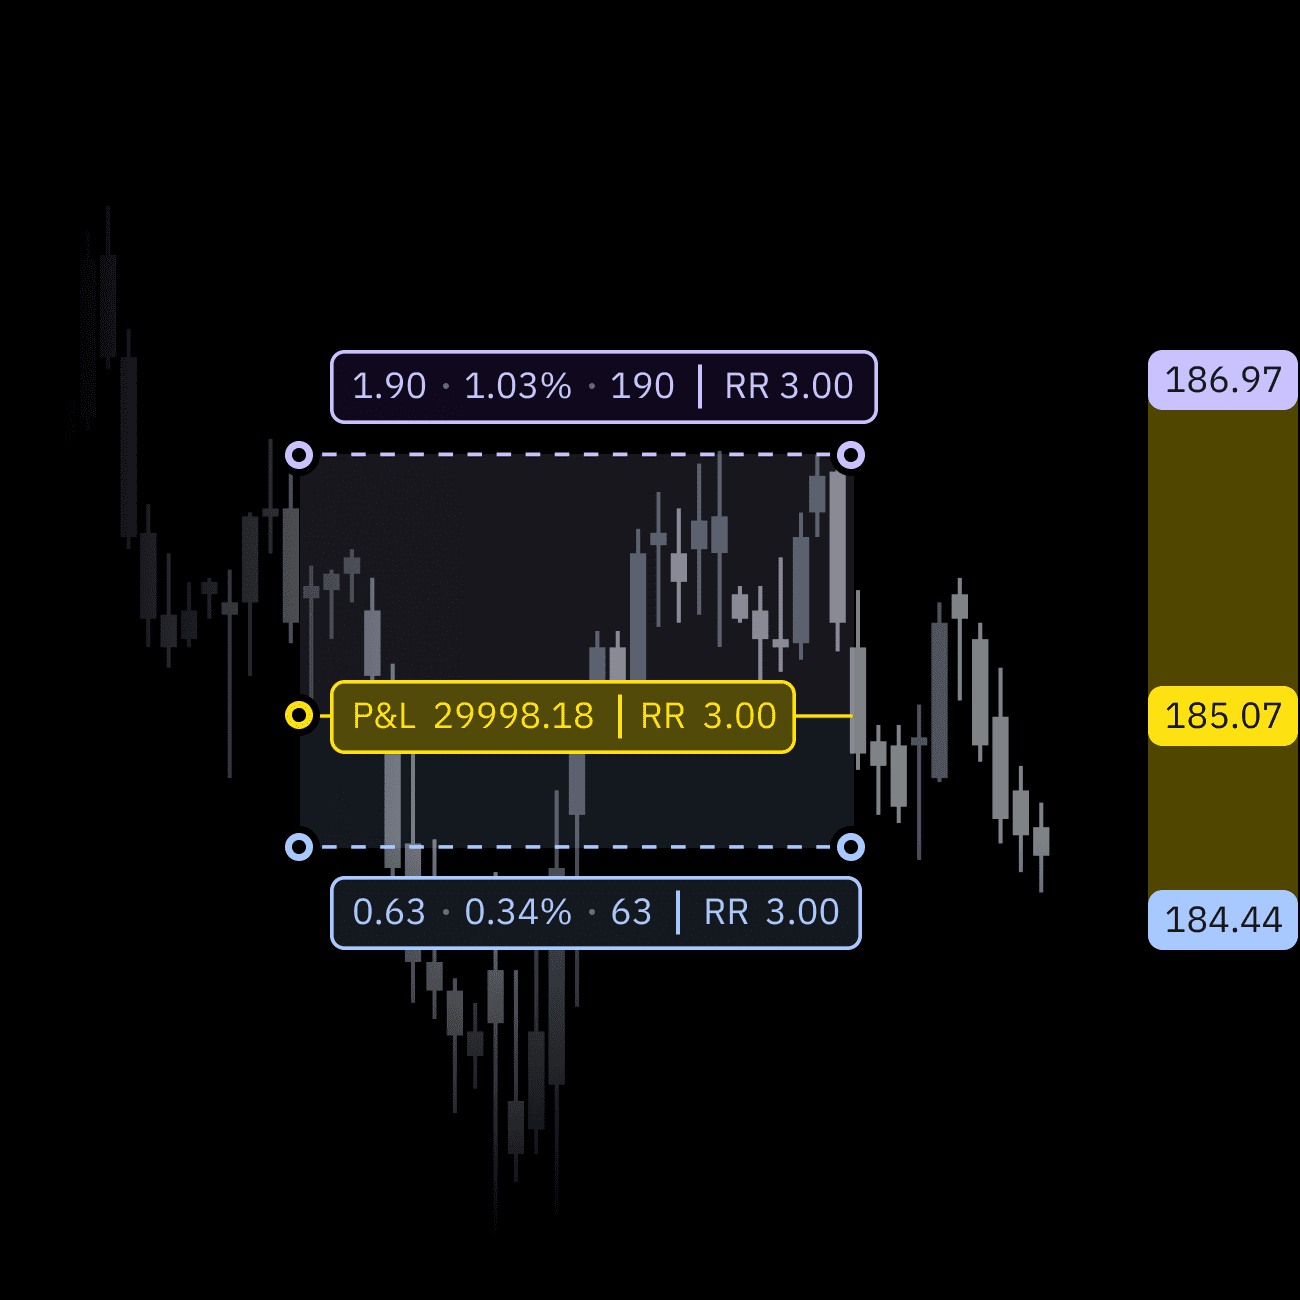
Quantify every candlestick chart move in real-time. Calculate the range of price, time, volume profile, and risk-to-reward ratios without the manual overhead.
- Automate long/short risk management calculations.
- Measure price and time variance.
- Map trading activity across specific price ranges.
Lines
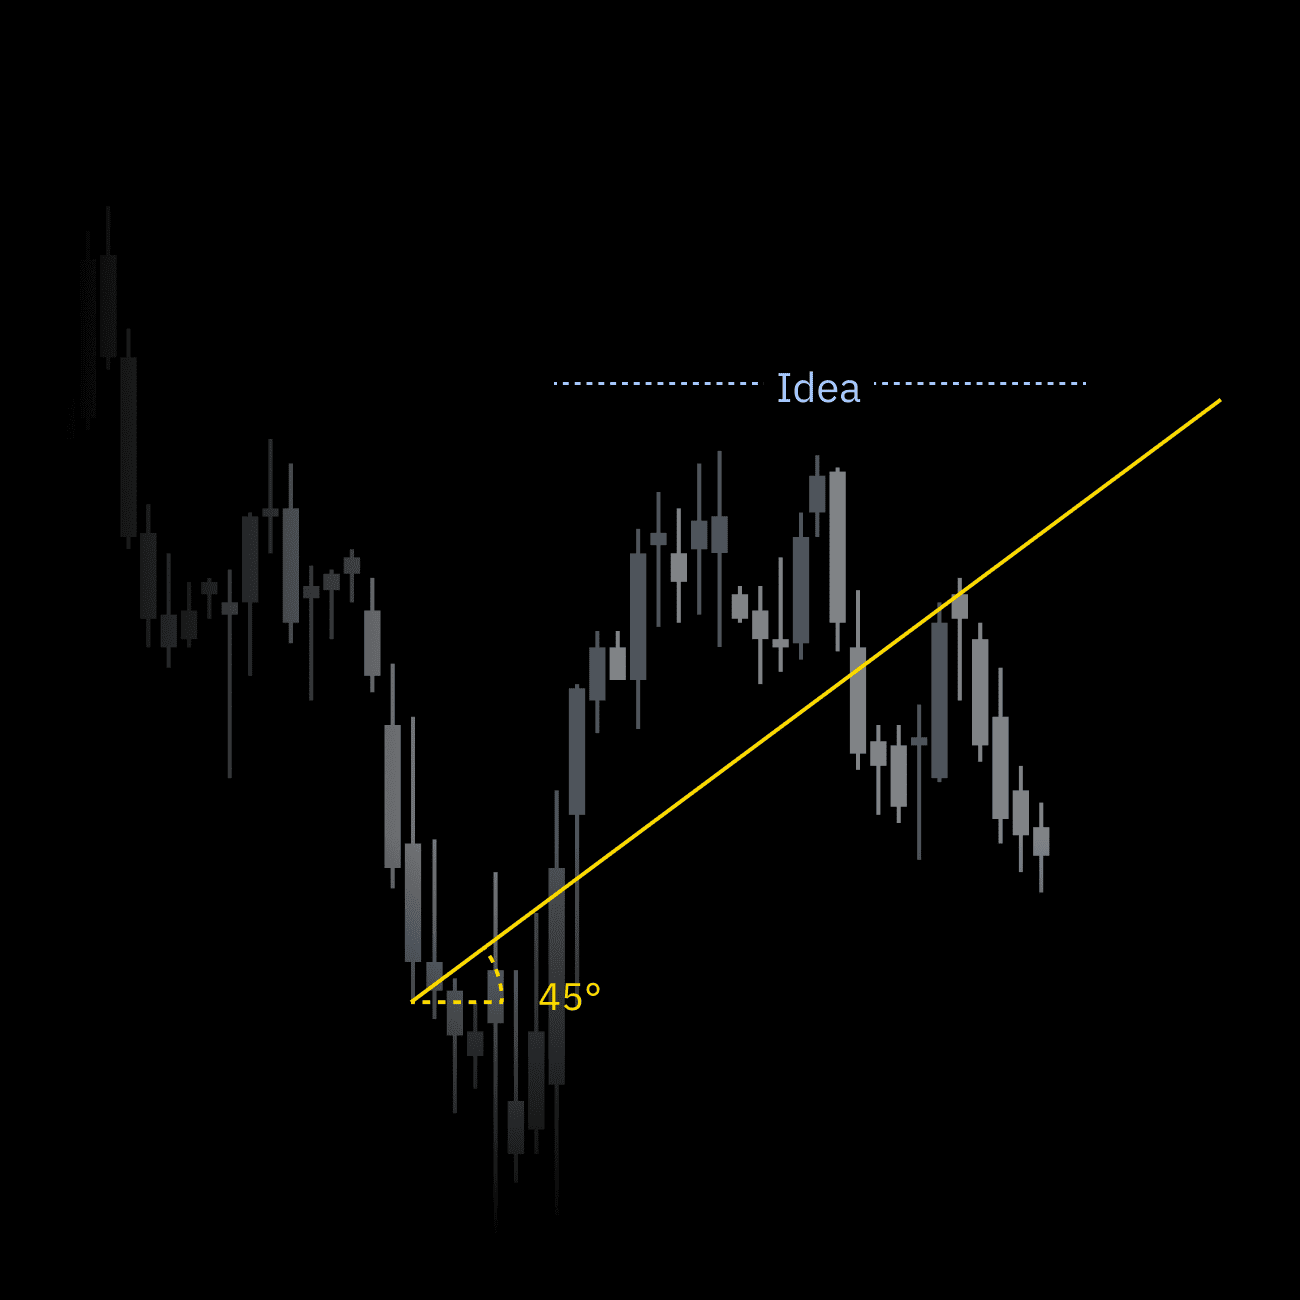
Map market structure in real-time. Identify trends, liquidity levels, and structural breakouts across any timeframe.
- Identify key support and resistance.
- Track high-velocity prices.
- Pinpoint breakout zones.
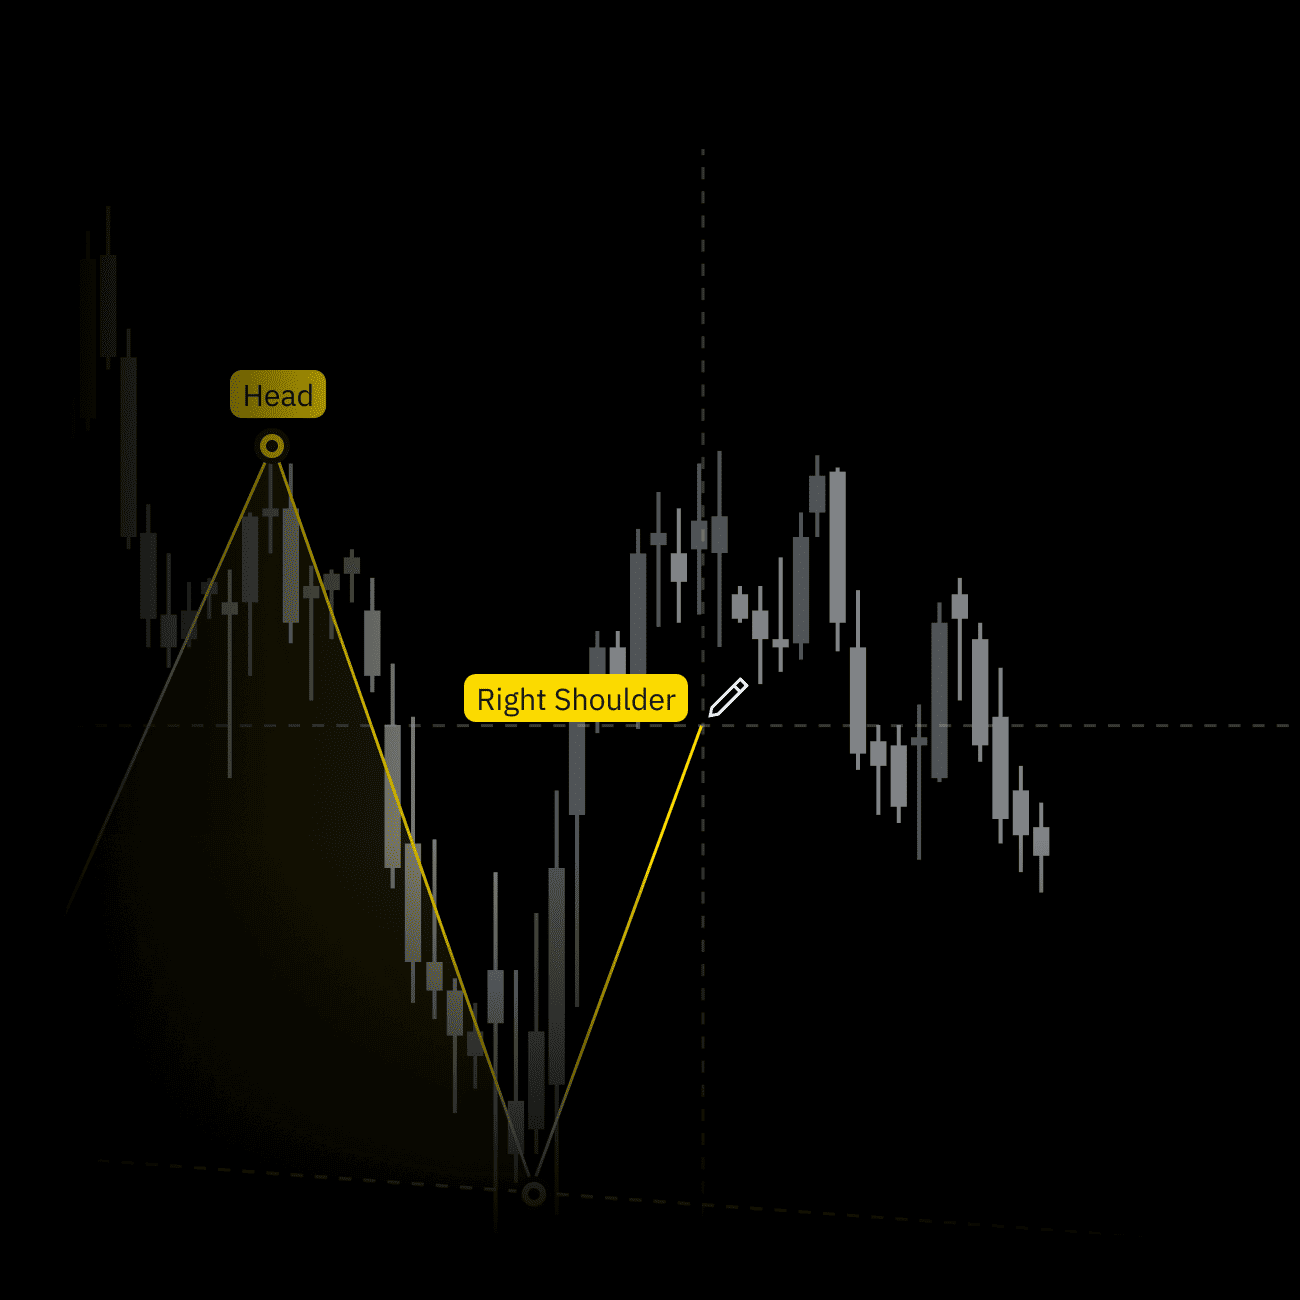
Patterns
Draw complex geometry smoothly. Identify Elliott Wave, Harmonics, and classical formations to confirm high-probability setups.
- Confirm harmonic and geometric moves.
- Detect structural market cycles.
- Validate complex technical formations.
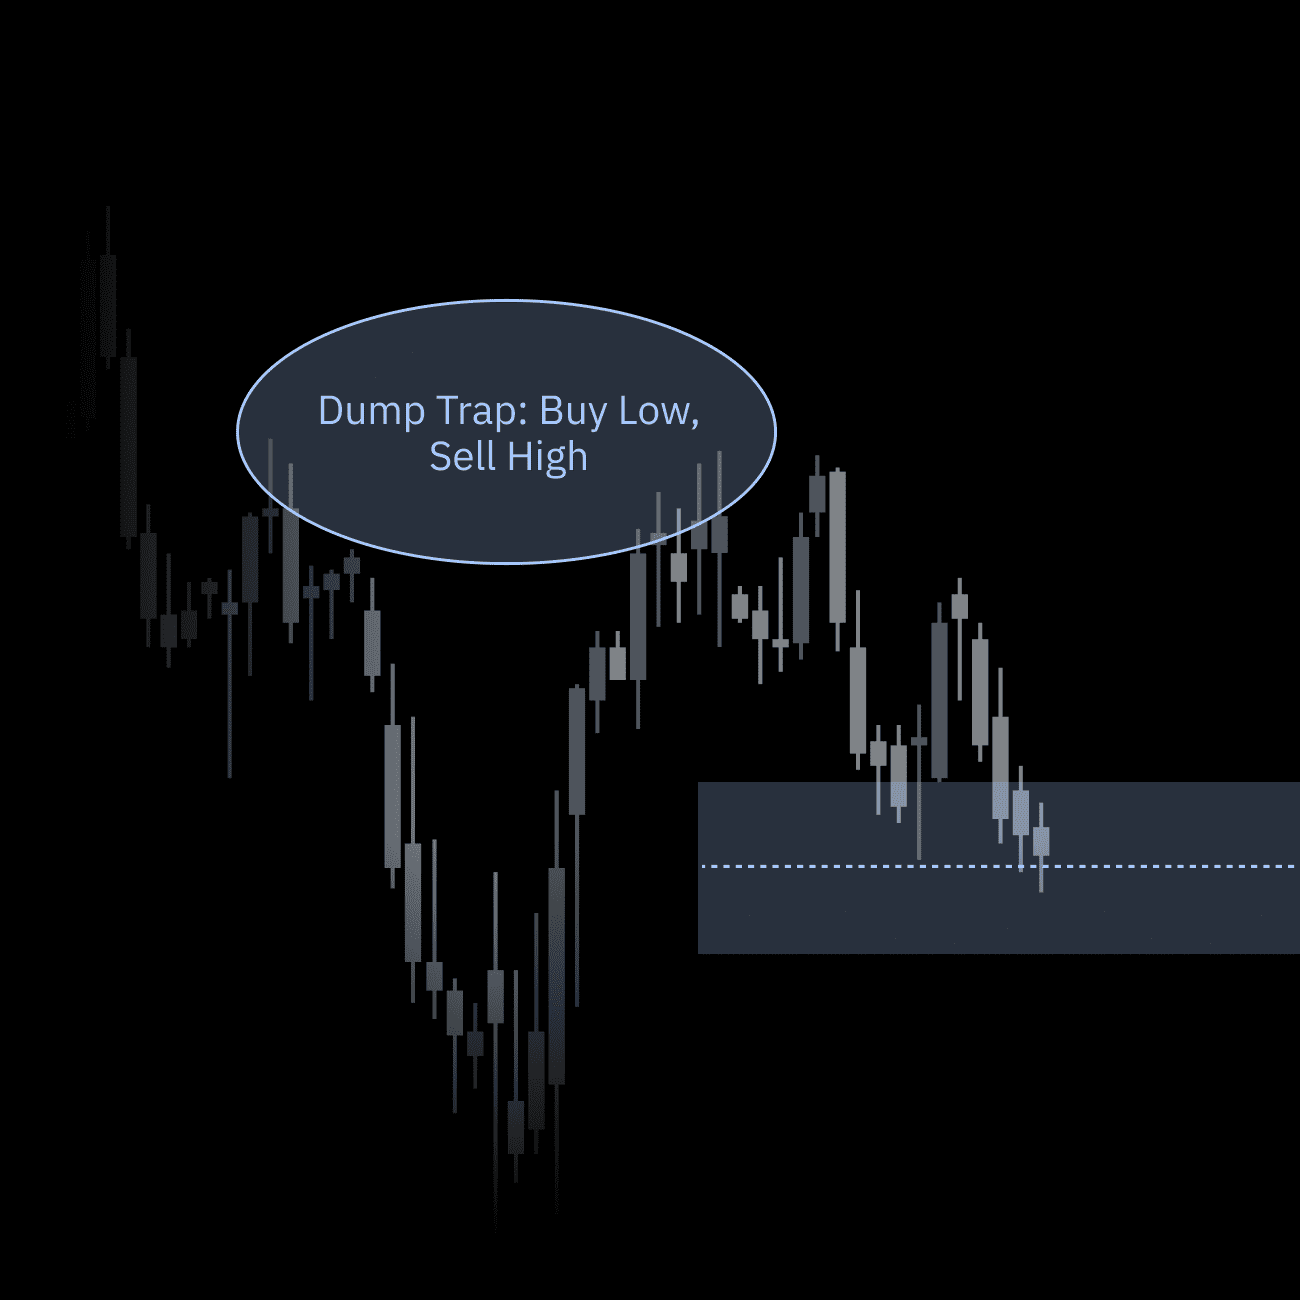
Shapes
Visualize supply and demand zones. Highlight critical areas of interest, consolidation ranges, and structural context with overlays.
- Map high-interest supply zones.
- Highlight price consolidation areas.
- Overlay structural market context.
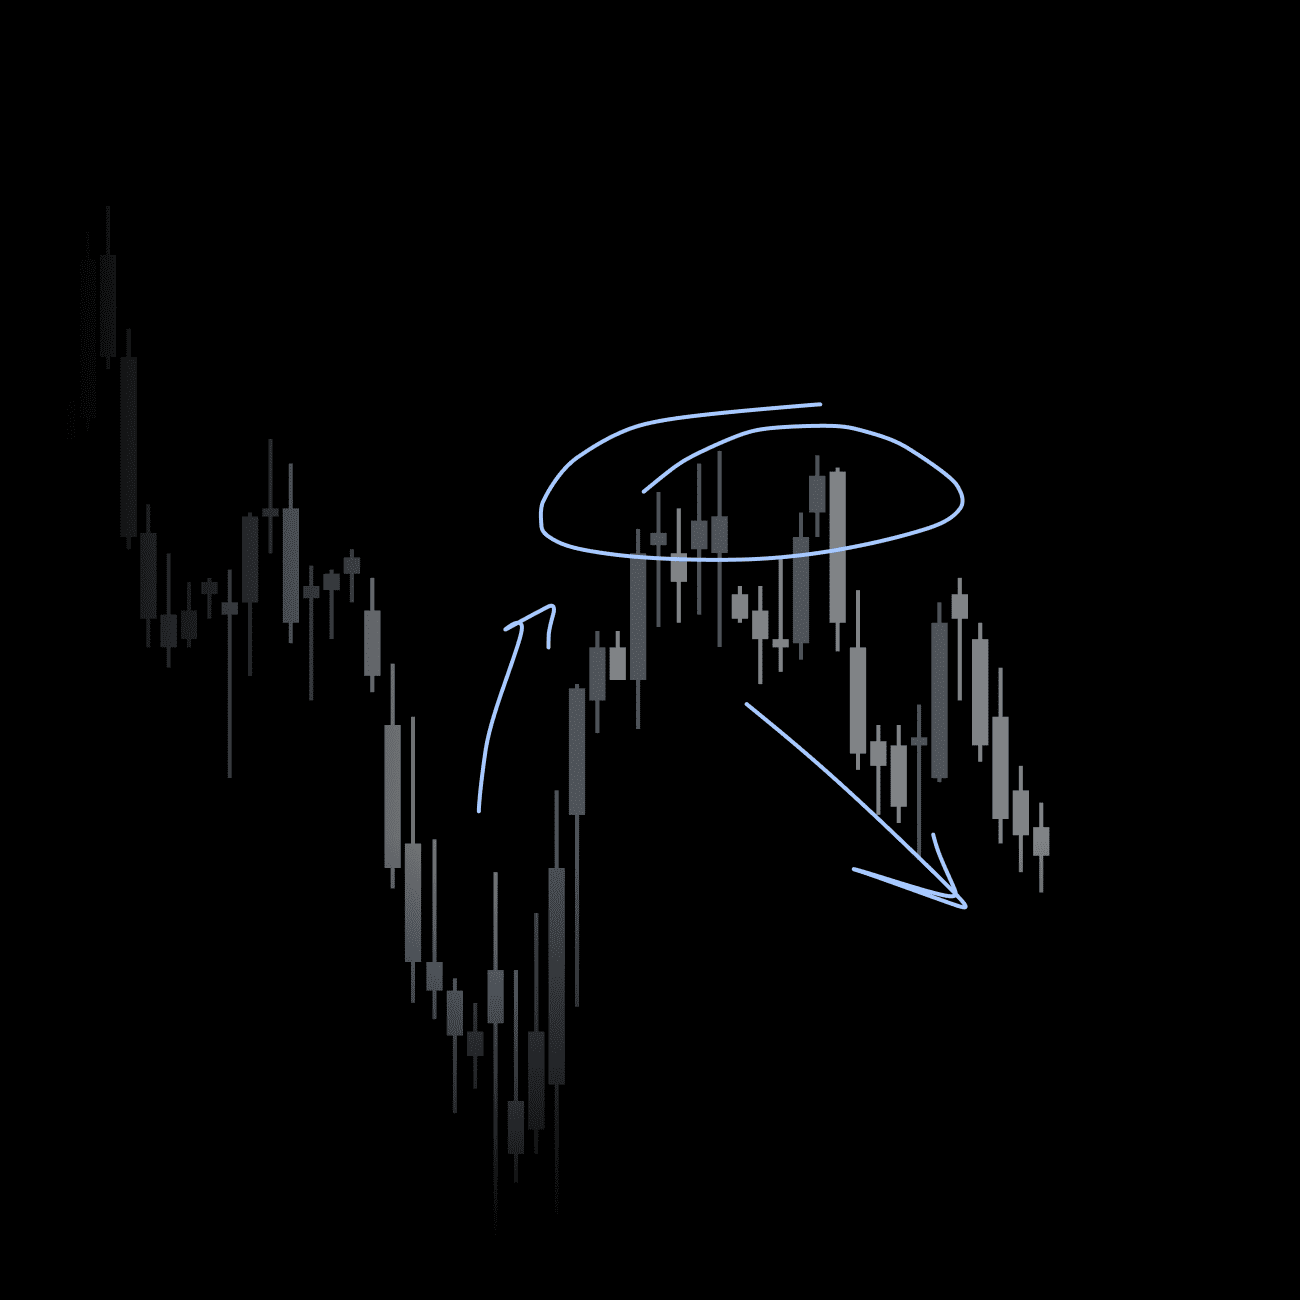
Drawings
Freedom to map your thesis. Use pen, highlighter, path, and polygon tools for rapid visual annotations and price trajectory mapping.
- Annotate price action trajectories.
- Freehand map your trading thesis.
- Rapidly highlight market narratives.
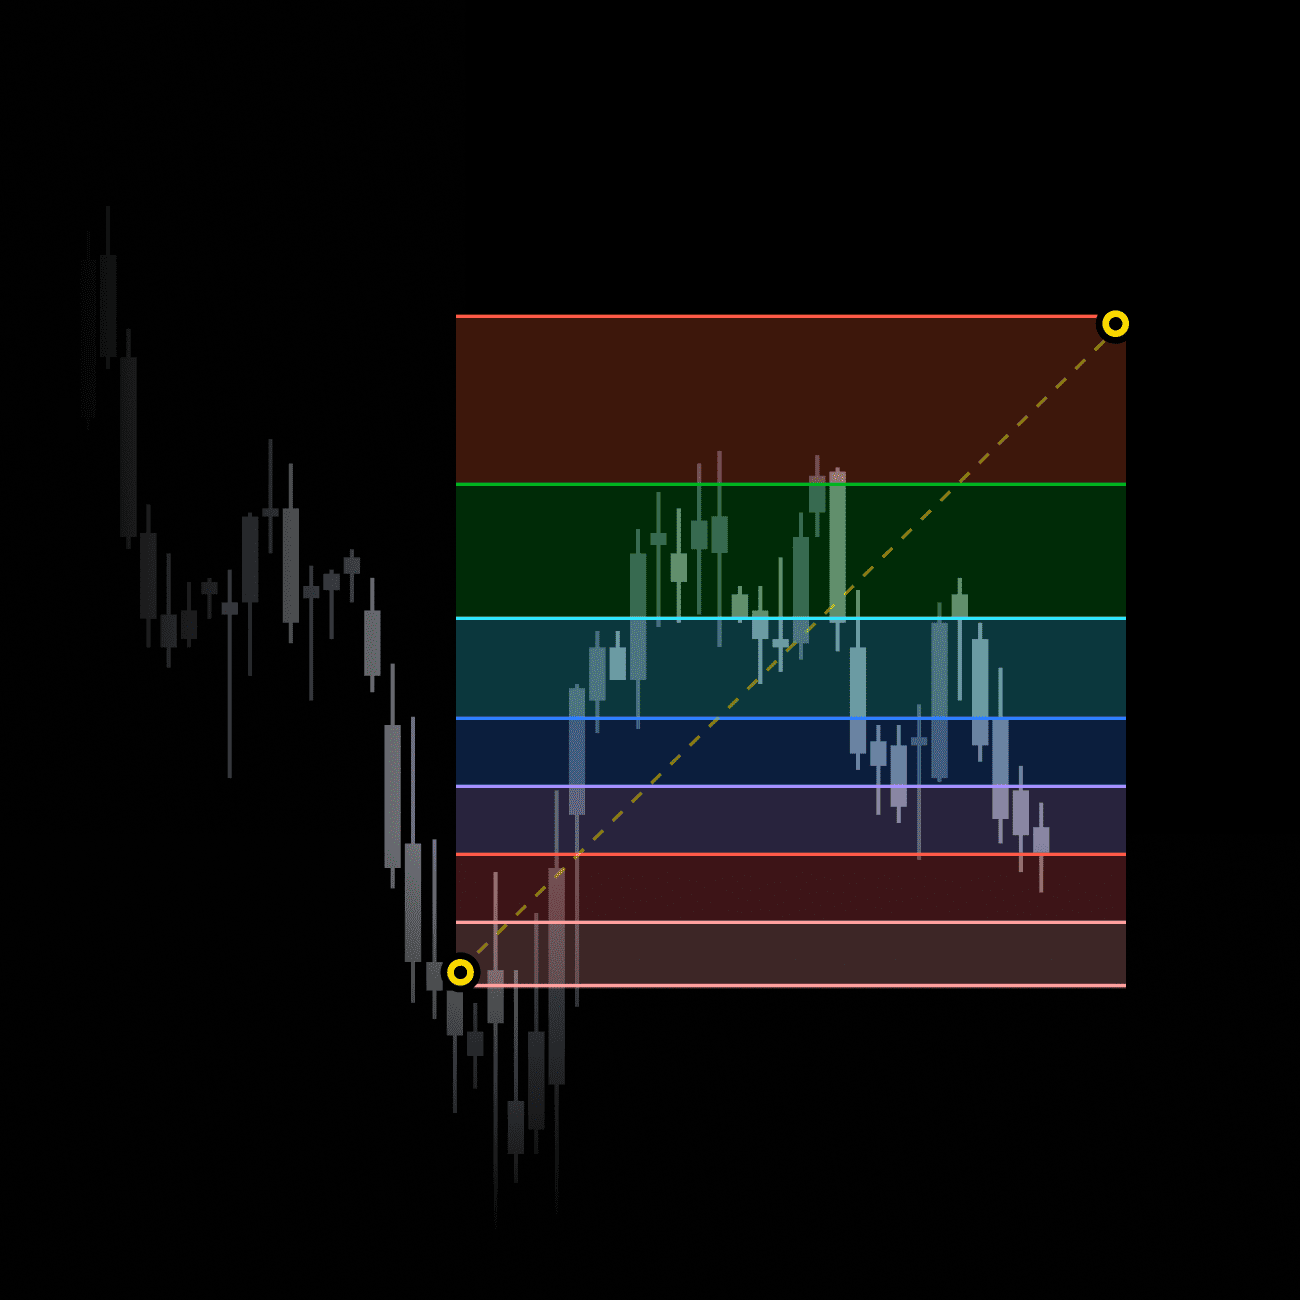
Fibonacci
Math-driven precision for reversals. Deploy retracements, extensions, and temporal zones to pinpoint institutional interest levels.
- Pinpoint retracement and extension.
- Identify temporal reversal zones.
- Align entries with market geometry.
Notes
Document your execution logic. Add professional annotations, labels, and callouts to maintain a clear narrative of your setups.
- Annotate specific execution logic.
- Label critical technical triggers.
- Document strategy for review.
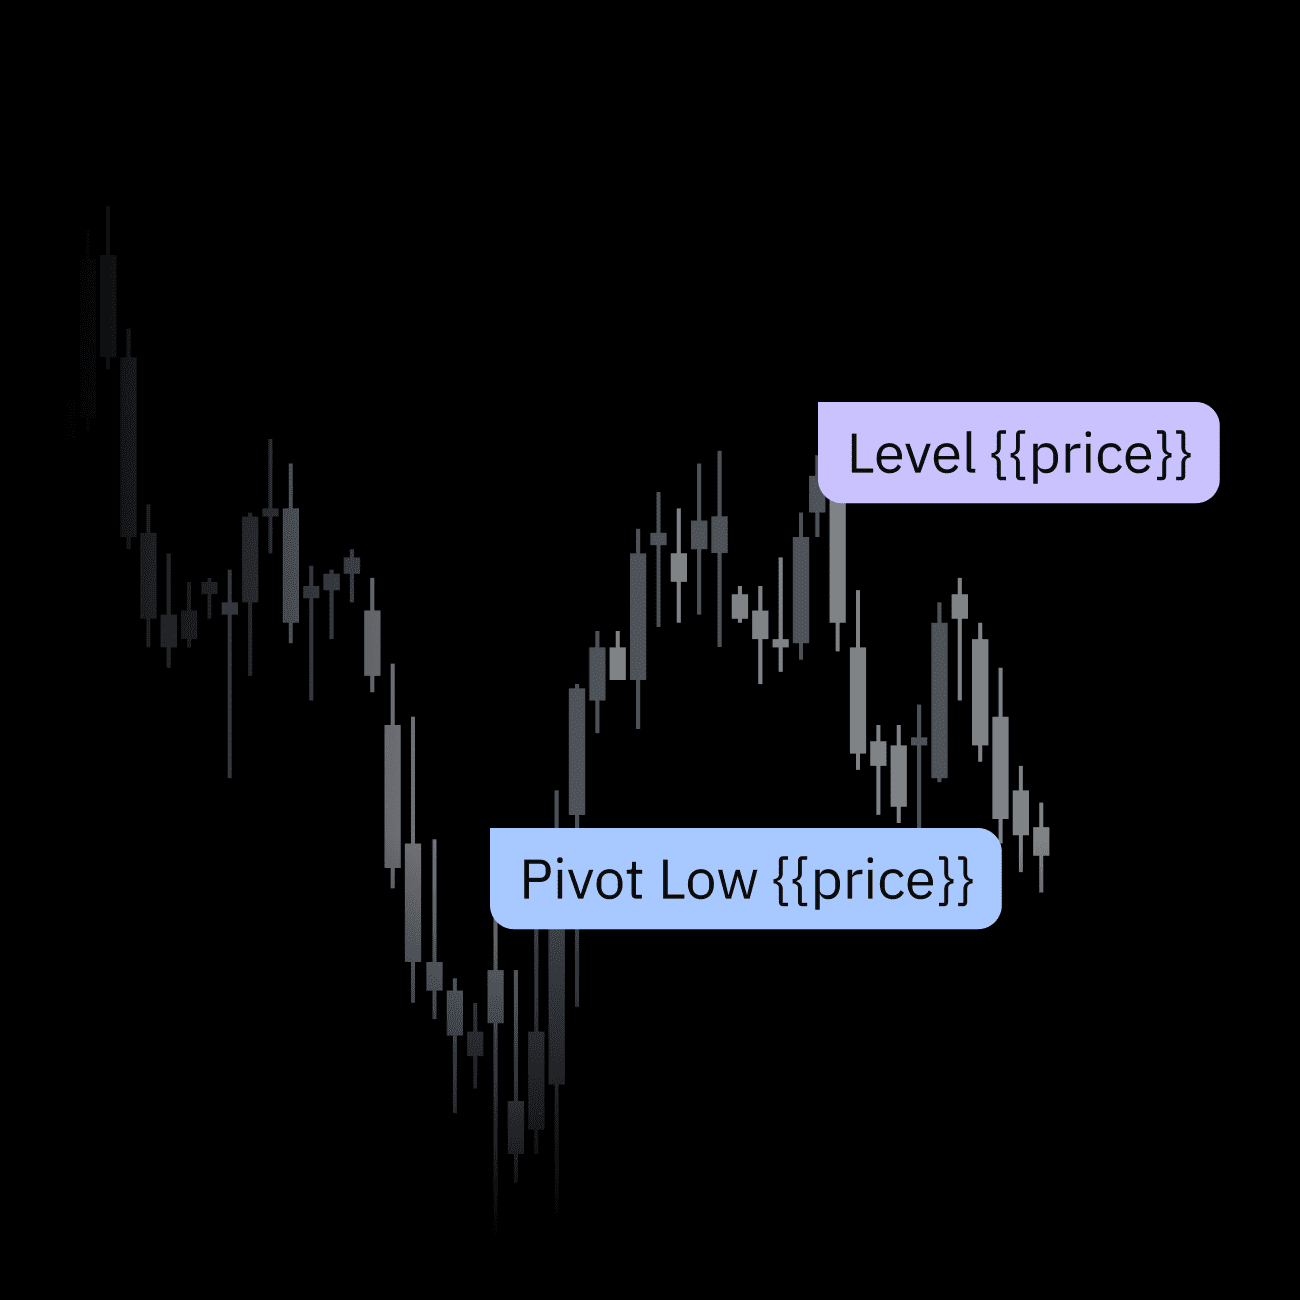
Control Your
Entire Workspace
Create linked chart groups, manage layers across panes, and sync drawings across your global setup, specific workspaces, or local charts.
Sync Your View
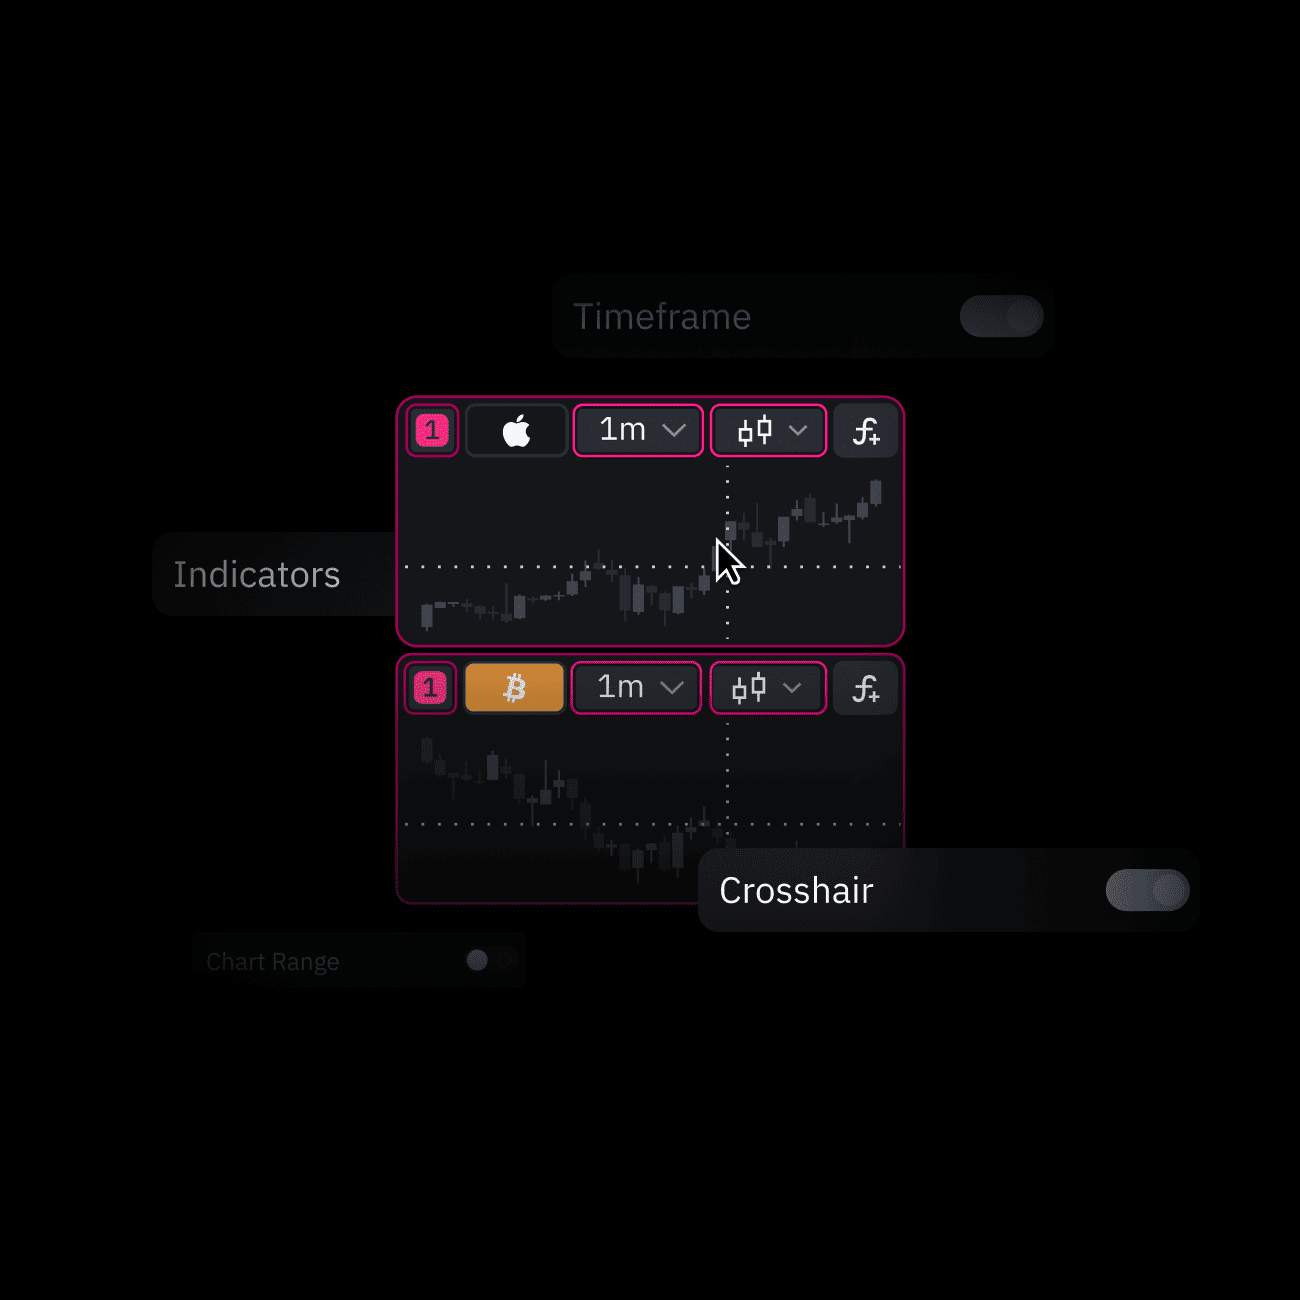
Create independent chart groups to sync symbols, time or tick intervals, and indicators. Compare stocks, commodities, and assets across any date range instantly — without the manual switching.
Drawings Consistency
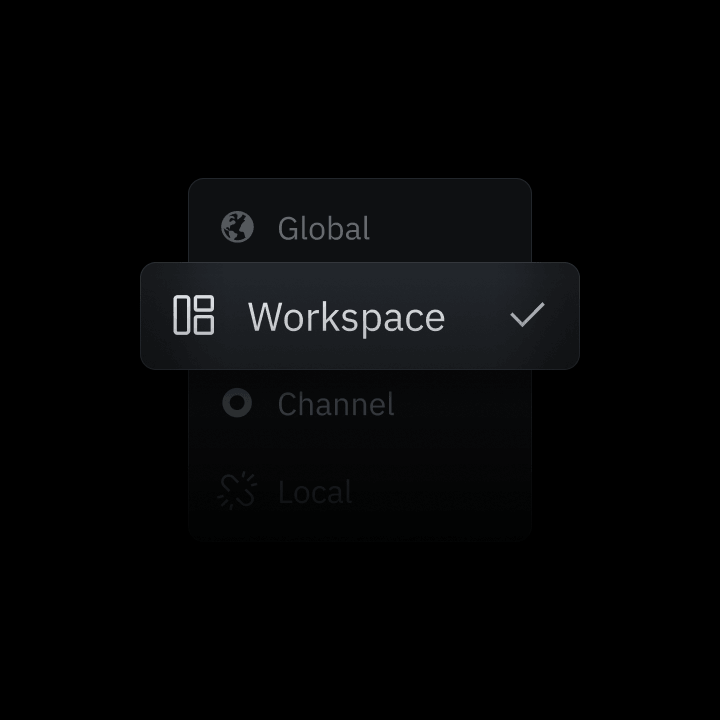
Choose exactly where your analysis appears: Global, Workspace, Channel, or Local. Stop redrawing levels across different charts and timeframes.
Structure Your Setup
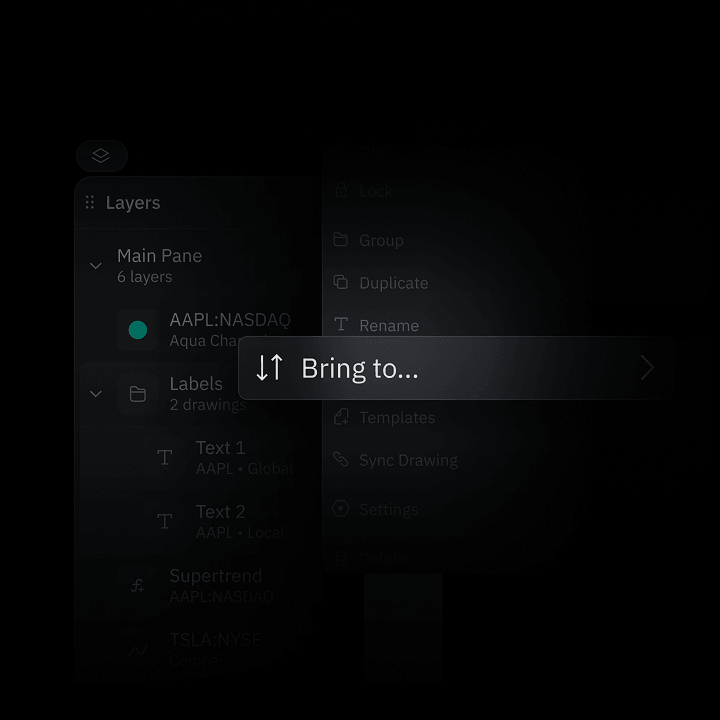
Manage panes, reorder layers, and control object stacking in one place. Engineered for complex, multi-indicator workflows.
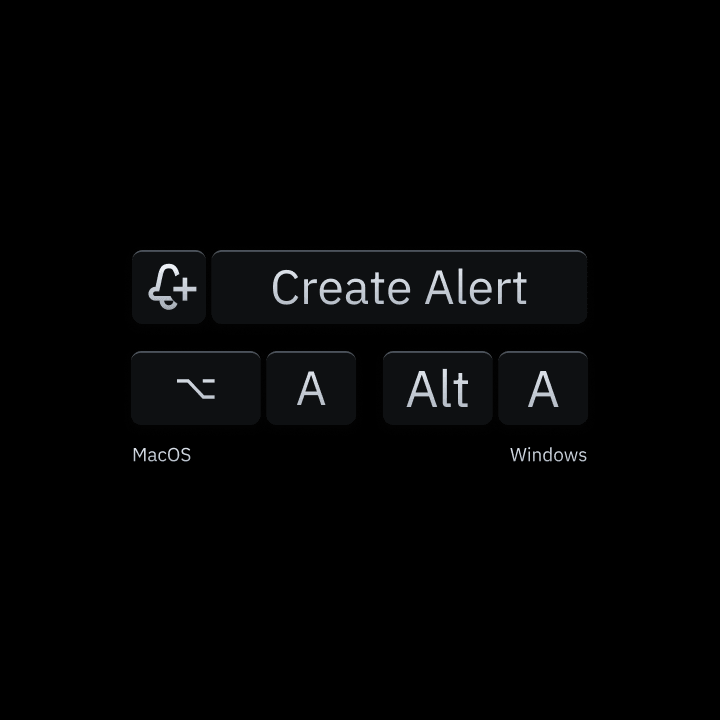
Hotkeys
40+ hotkeys to draw, measure, and annotate at trading speed. A keyboard-centric workflow engineered for high-velocity execution.
Sharing & Forks
Share your analysis with the world. Send live chart links, embed interactive data, or fork public setups to iterate on proven strategies.
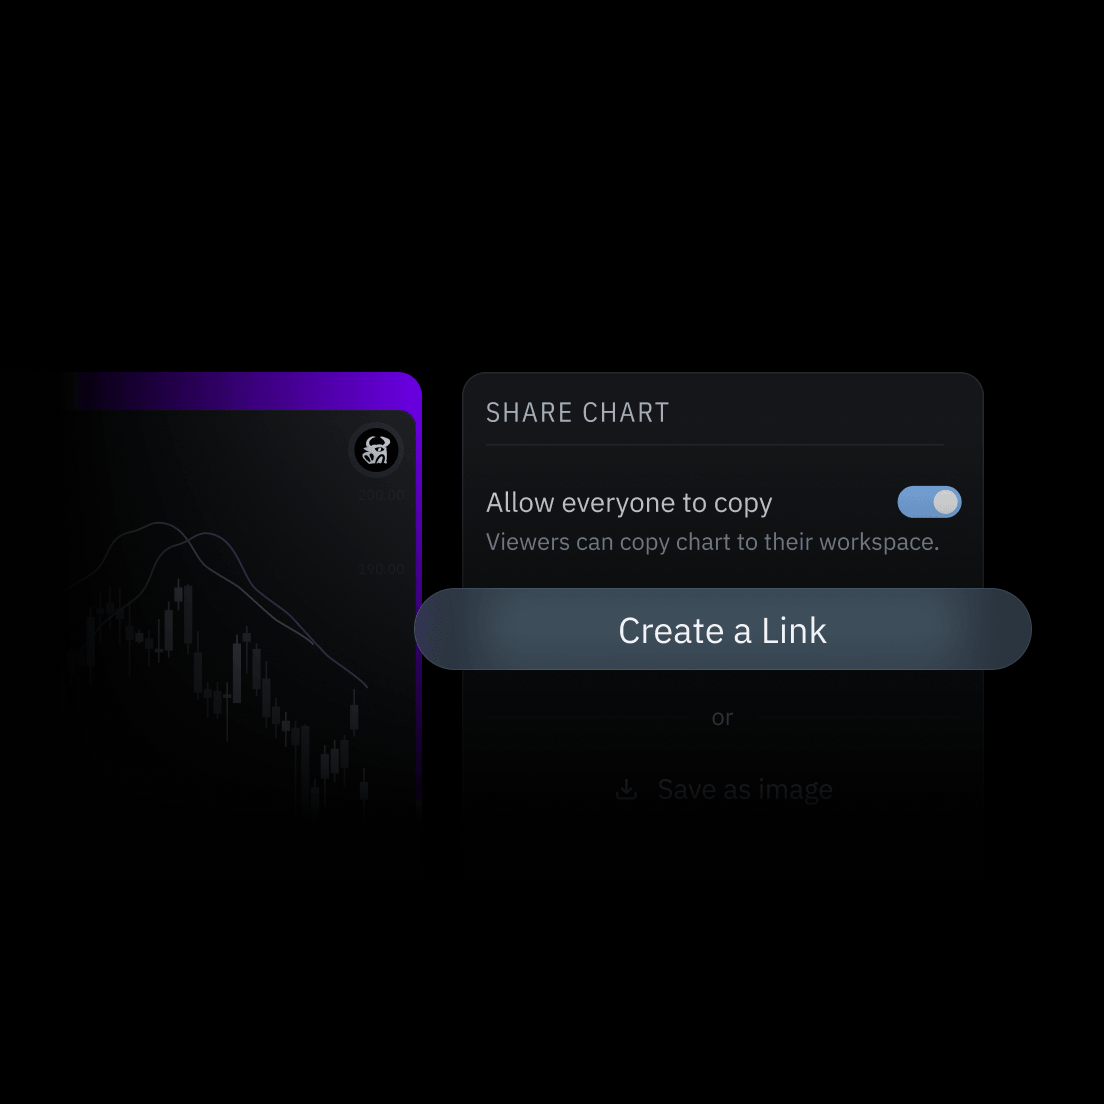
Share Your Thoughts
Establish strategy transparency with live publishing. Move beyond static screenshots with interactive charts that prove your execution process.
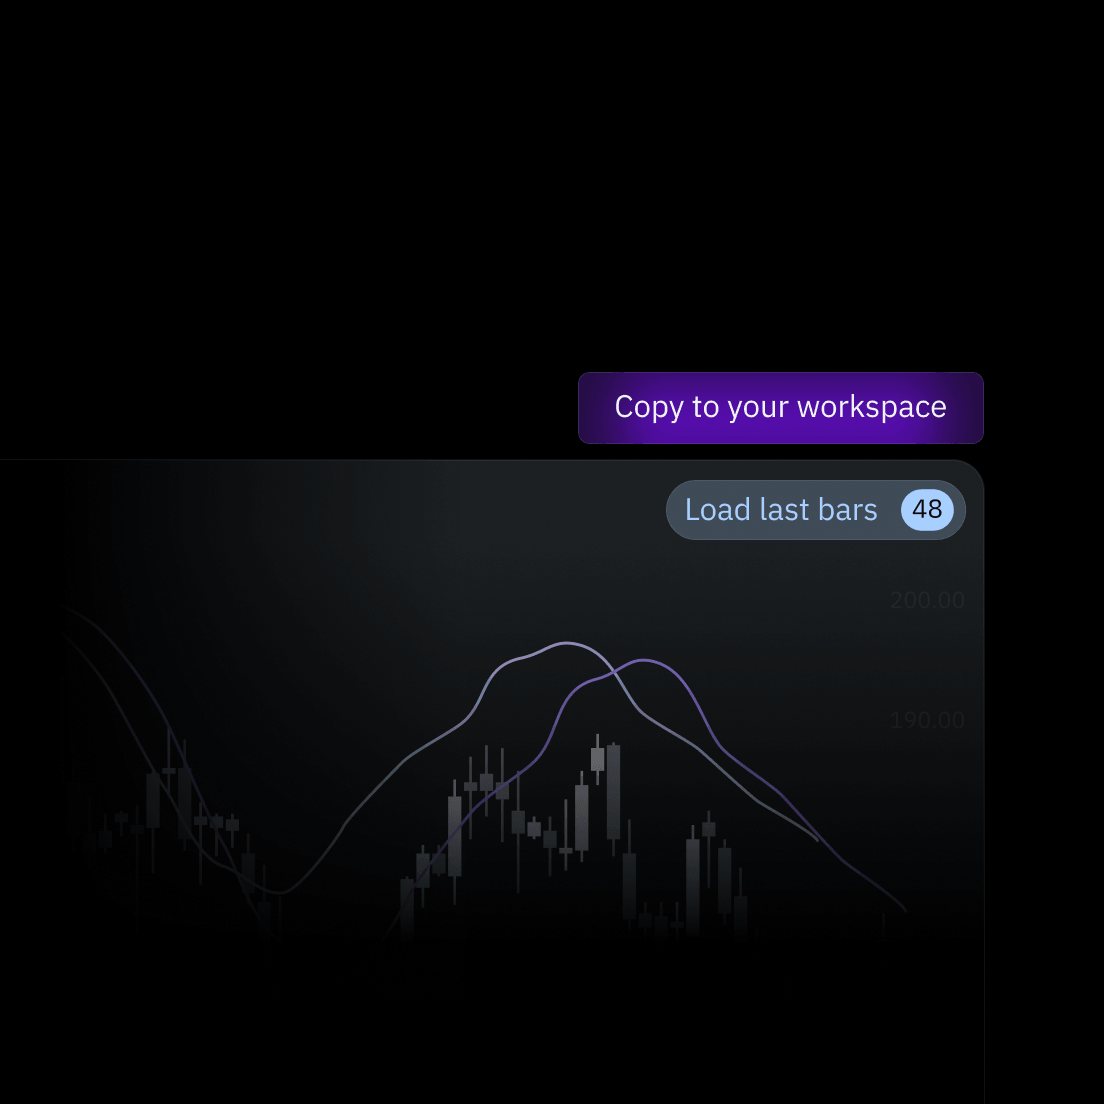
Copy to Your Workspace
Transform public analysis into an actionable playbook. Clone and refine high-conviction setups to build a customized library of proven strategies.
Cash Rewards
for Traders
Turn your trading expertise into recurring revenue — from up 50% cashback on trading fees to selling custom indicators.
Creator Rewards
Monetize posts, premium analysis, and custom Indie® indicators on your own terms.
Invite Friends
Invite your trader friends to cut platform fees and earn 25% lifetime revenue share.
Earn Cashback
The more you trade the more you earn. Get up to 50% cashback on your trading fees.
Explore Rewards
Built for Independent Traders
TakeProfit pays you back on every trade. Experienced traders can earn from their expertise. Newer traders gain access to real insights and ready-to-use tools built by those who trade.
- Earn up to 50% cashback on trading fees.
- Launch premium posts, indicators, and tools.
- Follow traders or build your own audience.

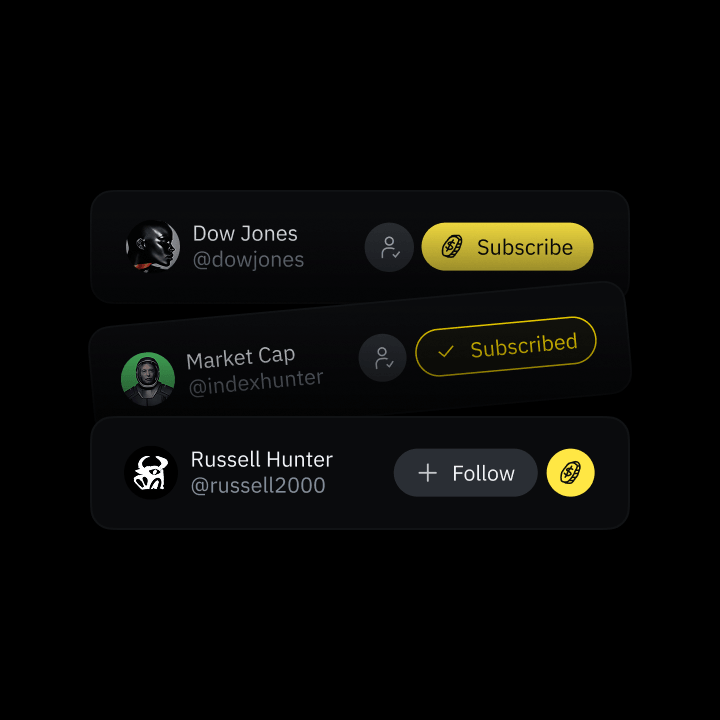
Premium Posts
Publish subscriber-only market analysis and earn recurring revenue from your audience.
Custom Indicators
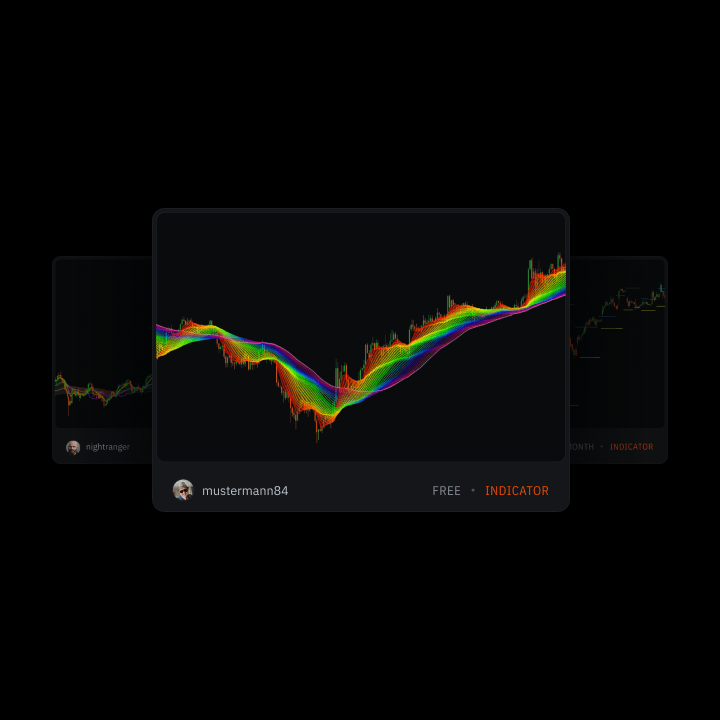
Build Indie-based indicators and monetize your scripts in the marketplace.

Widgets & Tools
Create data-driven widgets and offer them as paid subscriptions.
The Engine Room
The TakeProfit engine features custom rendering — enhanced with proprietary functionalities. Every timeframe gives you precision and stability.