Backtesting is live in Beta, AI-powered strategy refinement via MCP, dynamic bar colors in Indie®, advanced theme customization with HEX support, and Two-Factor Authentication for account security.
We use the Halloween Strategy as a hands-on example to explore Indie’s core tools — from plot backgrounds and Buy/Sell labels to custom parameters and performance stats.
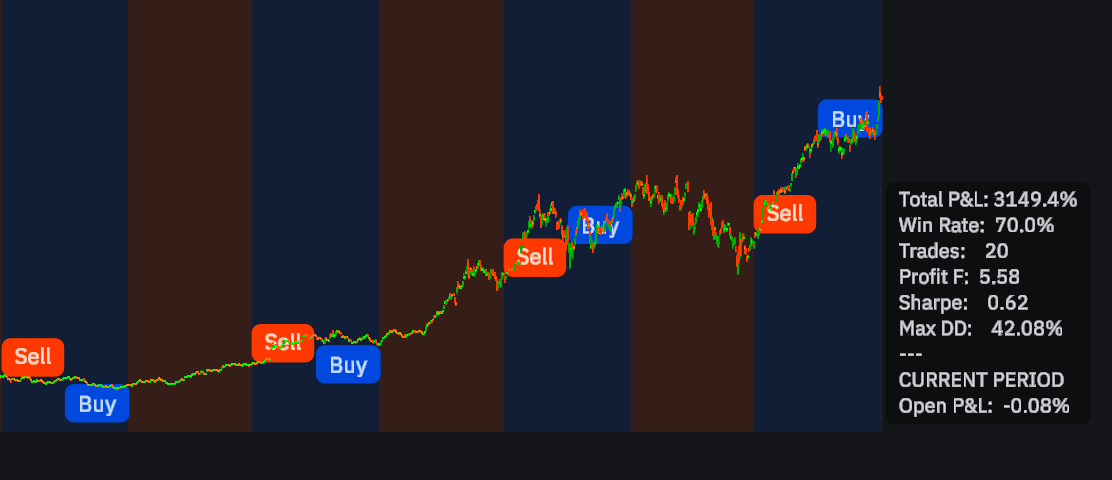
Indie indicator that visualizes the Halloween Effect end-to-start: it shades Oct 31→May 1 as the in-season window, auto-places Buy on Oct 31 and Sell on May 1, and renders a compact performance panel versus buy-and-hold with key stats (total P&L, win rat…
Indie indicator that visualizes the Halloween Effect end-to-start: it shades Oct 31→May 1 as the in-season window, auto-places Buy on Oct 31 and Sell on May 1, and renders a compact performance panel versus buy-and-hold with key stats (total P&L, win rat…
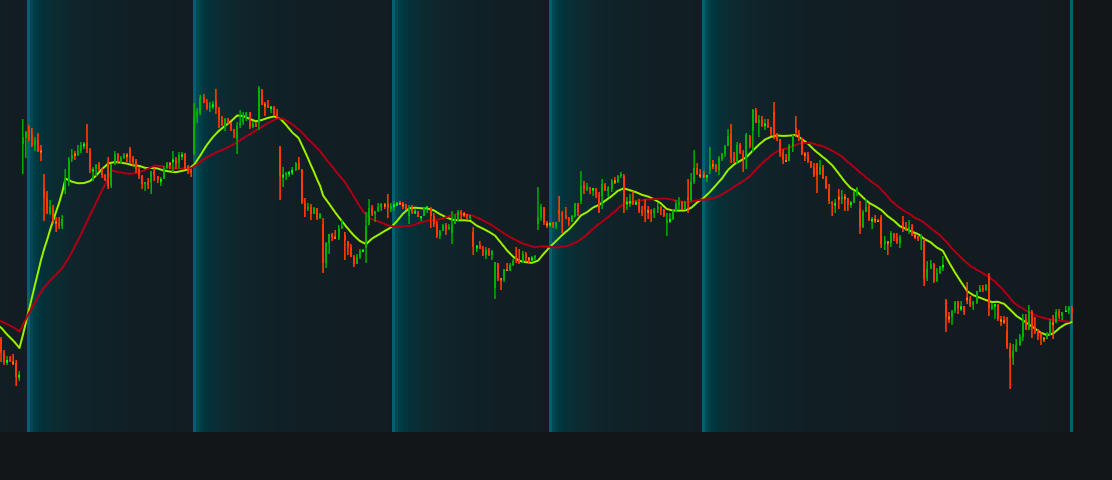
This educational indicator demonstrates how to use the @plot.background() decorator in Indie to visually highlight important market events. The indicator tracks crossovers between 15 and 30-period SMAs. When the fast SMA crosses above the slow SMA, it …
This educational indicator demonstrates how to use the @plot.background() decorator in Indie to visually highlight important market events. The indicator tracks crossovers between 15 and 30-period SMAs. When the fast SMA crosses above the slow SMA, it …