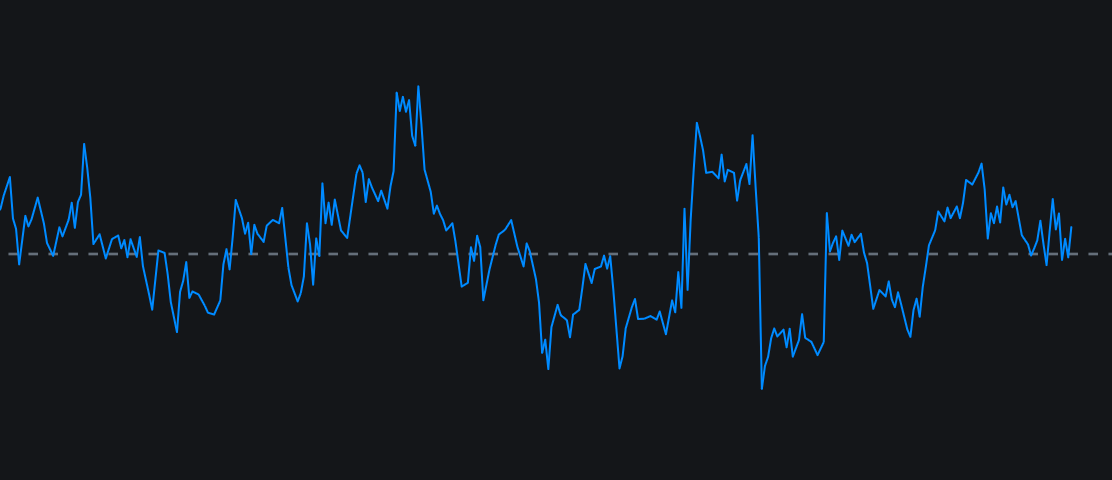
MrktCyphr-like Osc. v3.3image
MrktCyphr-like Osc. v3.3
This is my first indicator on TP. It was inspired by Market Cipher B. Criticism is welcomed!! Please! I'm a far way from being a Developer. I like to fool around. Add to this (or take away) anything you'd like. Let me know what you come up with. Red Dot…
/indicator/mrktcyphr-like-osc-v3-3-63
EME LRC Cross 1m dollar indicatorimage
EME LRC Cross 1m dollar indicator
📈 EMA vs LRC Crossover Signal – Smart, Clean, Actionable Spot high-probability trend reversals with precision using this elegant crossover indicator that blends the smooth responsiveness of EMA with the statistical edge of Linear Regression . Unlik…
/indicator/eme-lrc-cross-1m-dollar-indicator-48
My CVDimage
My CVD
The Cumulative Volume Delta (CVD)  is a powerful  volume-based indicator  that measures the net difference between buying and selling pressure in the market. It calculates the volume attributed to aggressive buyers (when price closes closer to the high) …
/indicator/my-cvd-91
Classic SlingShot Trend Logicimage
Classic SlingShot Trend Logic
SlingShot Trend System  / EMA Pullback SlingShot System SSTS  is a trend-following indicator based on a dual EMA pullback methodology, designed to keep traders aligned with the dominant market direction and identify high-probability continuation entries.
/indicator/classic-slingshot-trend-logic-37
RSI Divergence Indicatorimage
RSI Divergence Indicator
RSI Divergence – Fast vs Slow RSI Momentum Oscillator RSI Divergence is a technical analysis indicator that measures the difference between fast and slow RSI values. Instead of showing RSI directly, it visualizes internal momentum changes through a singl…
/indicator/rsi-divergence-indicator-92
Adaptive Trend Overlay (Enhanced TMA)image
Adaptive Trend Overlay (Enhanced TMA)
Enhanced TMA   Overlay  is a professional multi-purpose market overlay designed to help traders identify trend regimes, market structure, price-action patterns, and active trading sessions within a single, clean, non-repainting indicator. This indicator …
/indicator/adaptive-trend-overlay-enhanced-tma-19