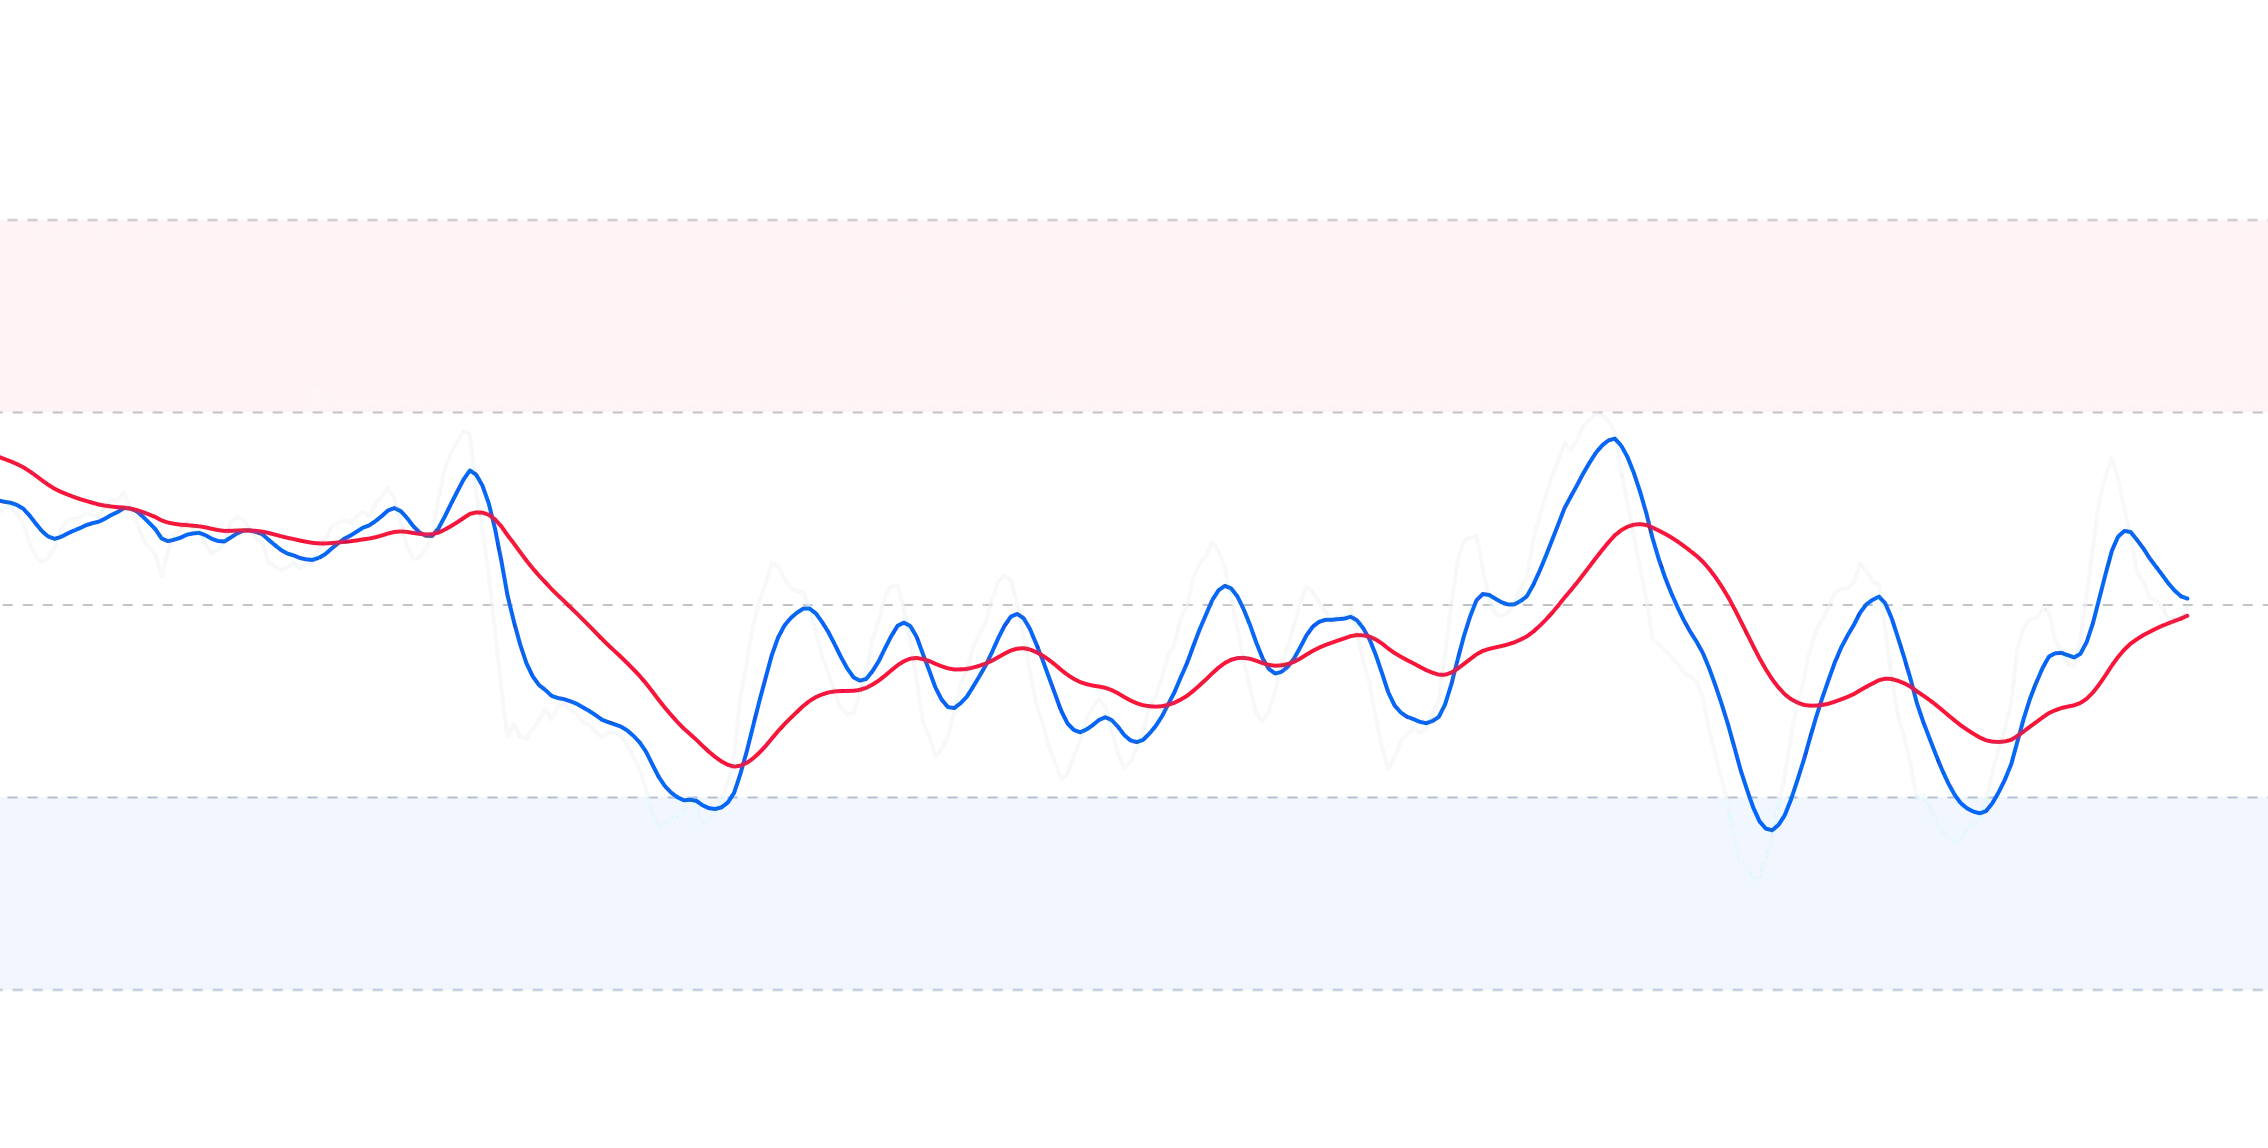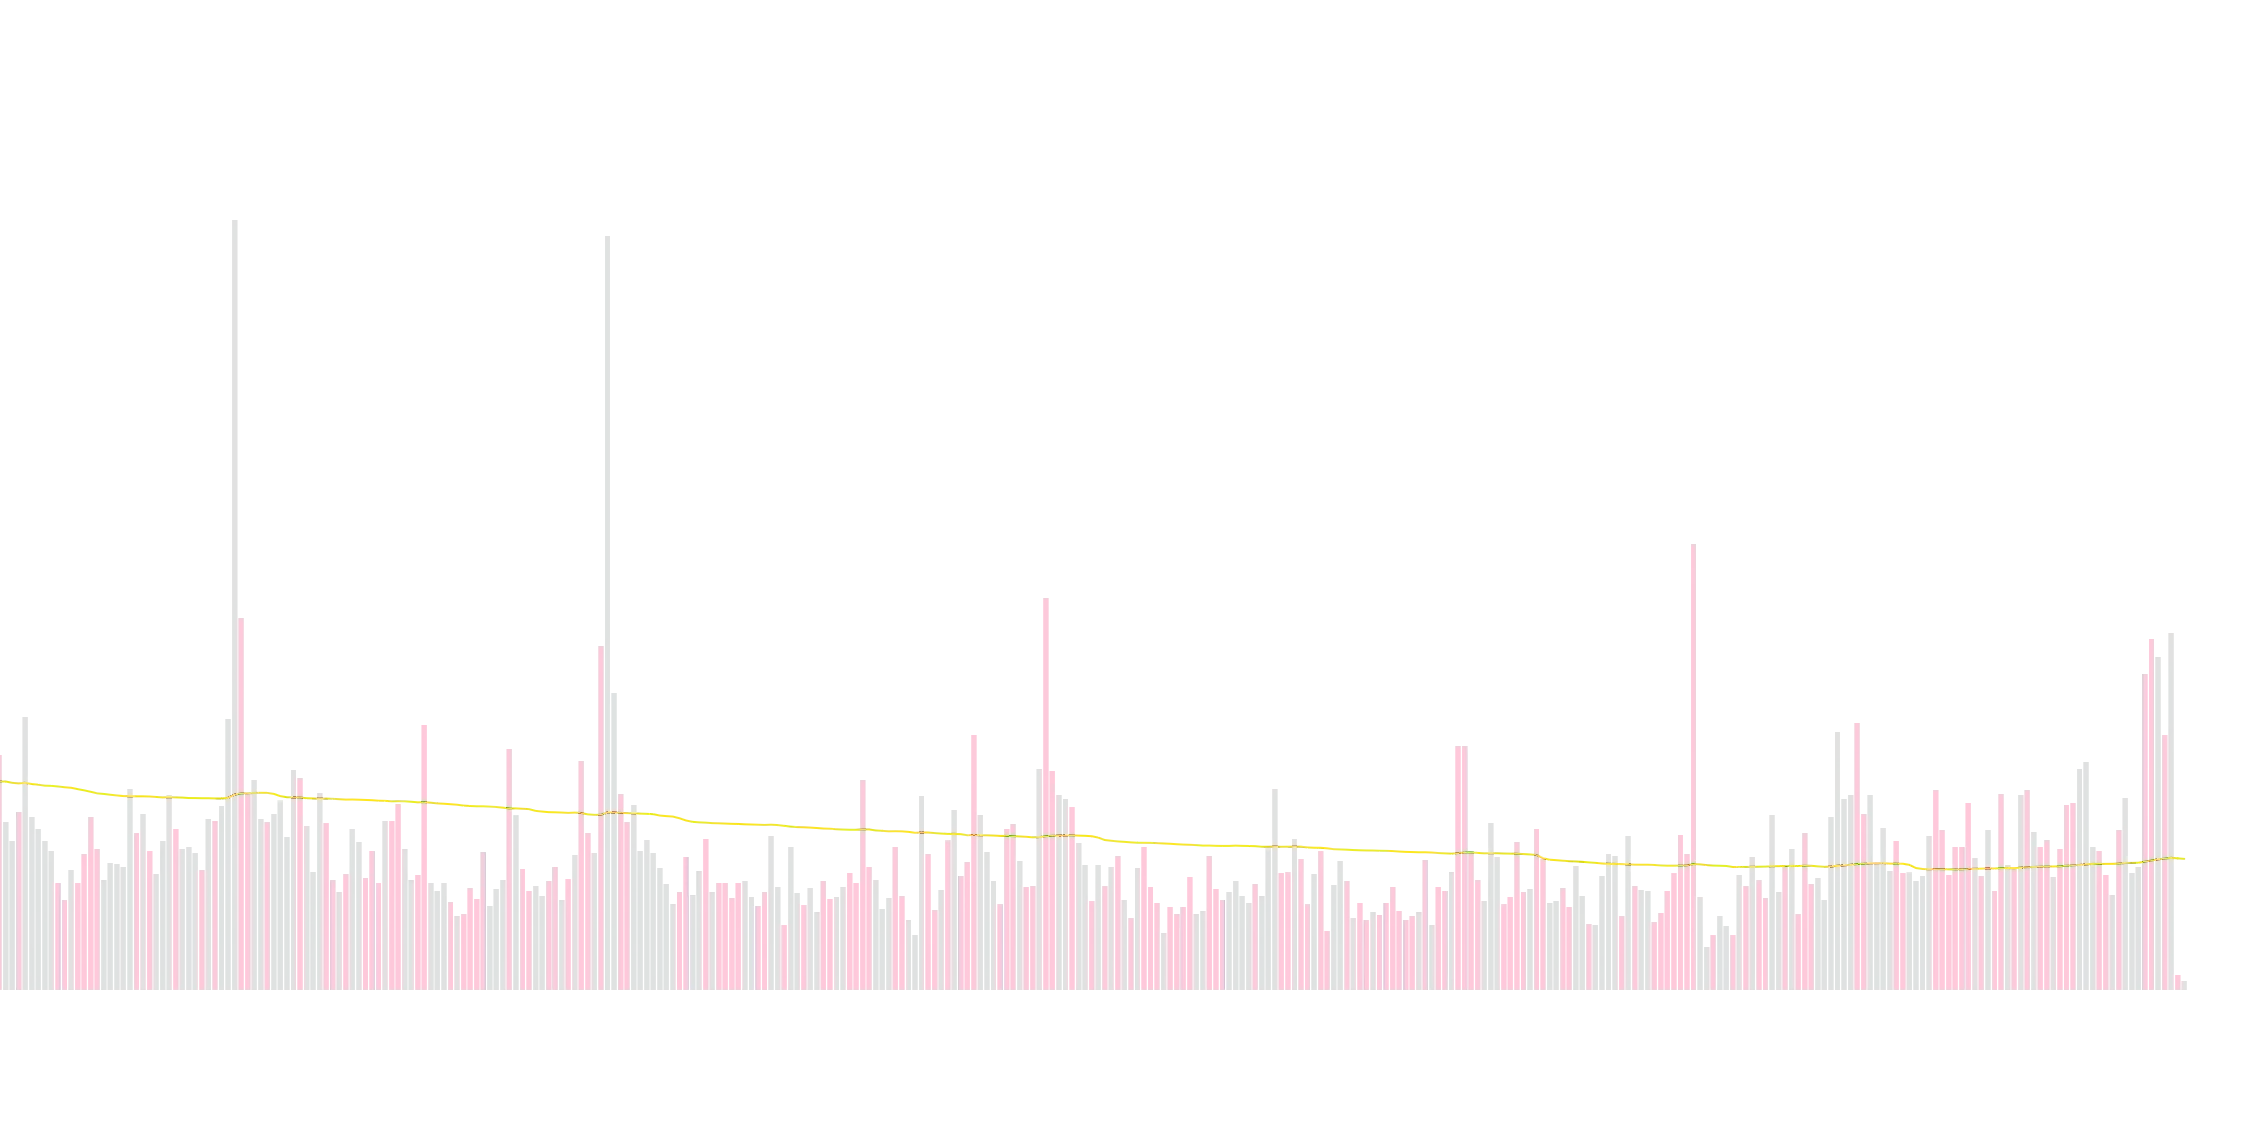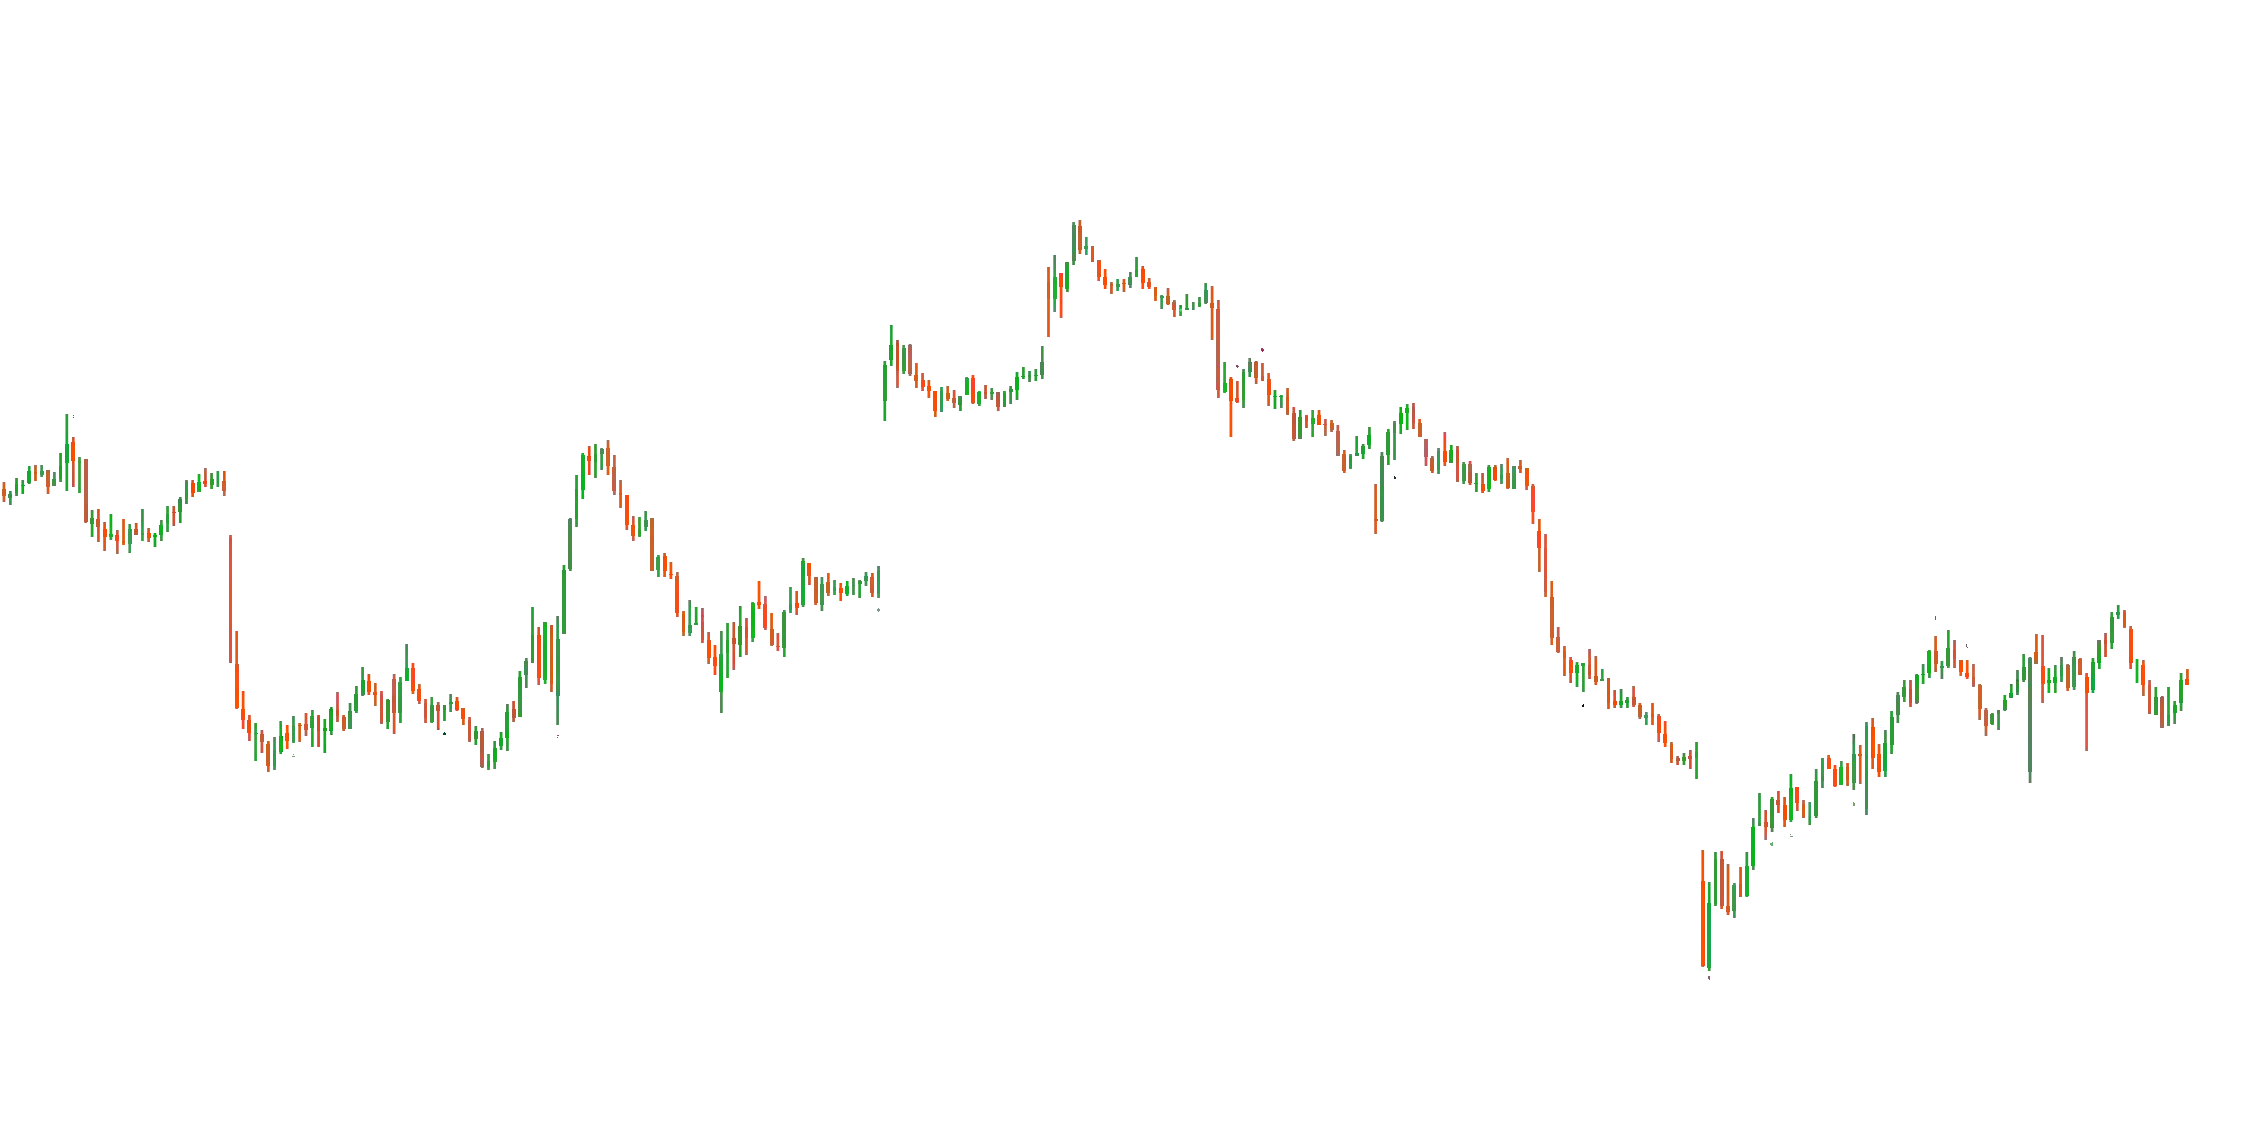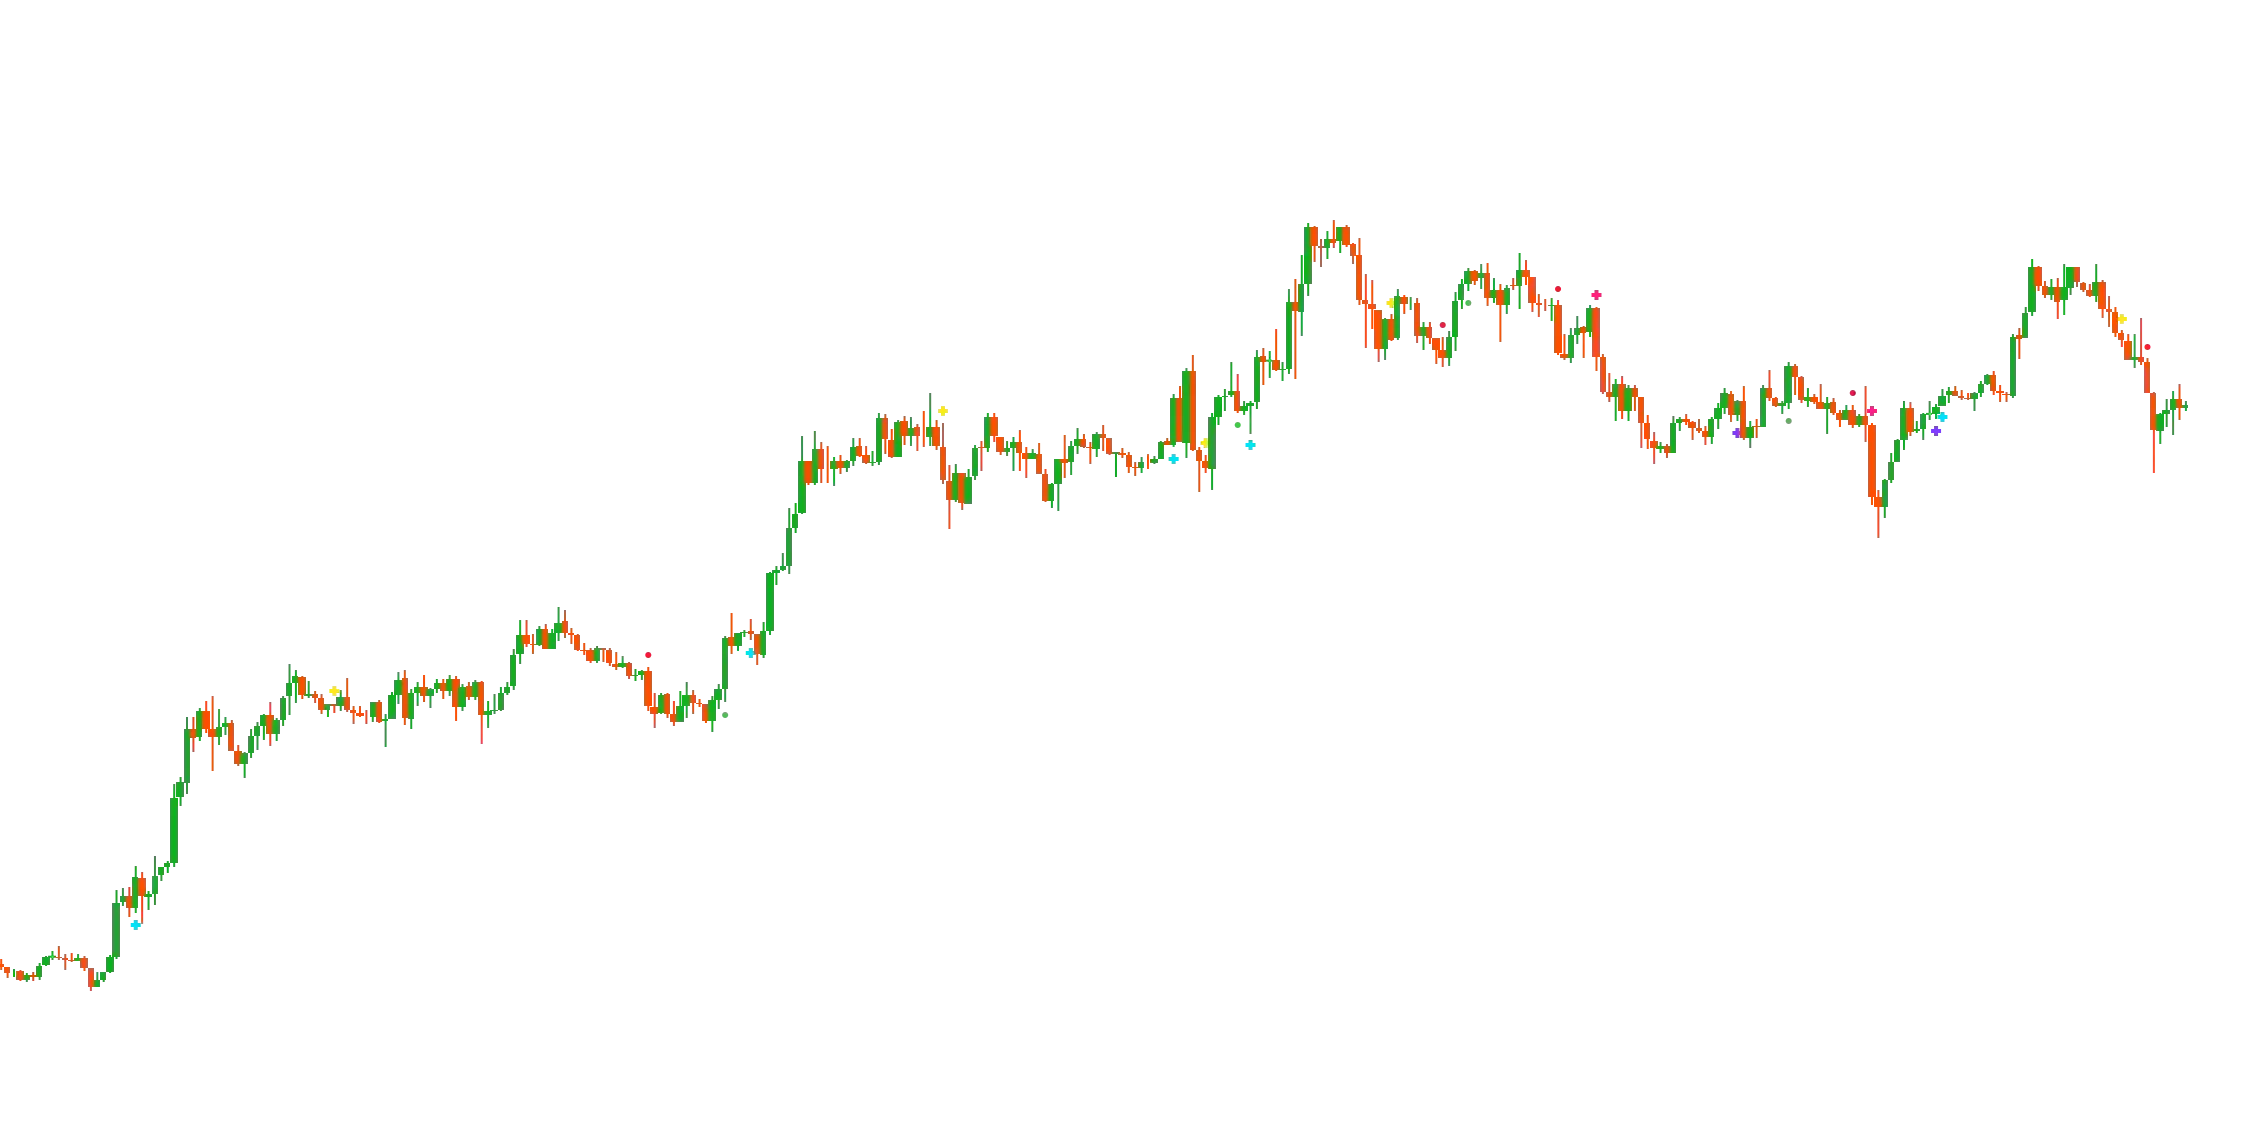
Andean Oscillator Signalsimage
Andean Oscillator Signals
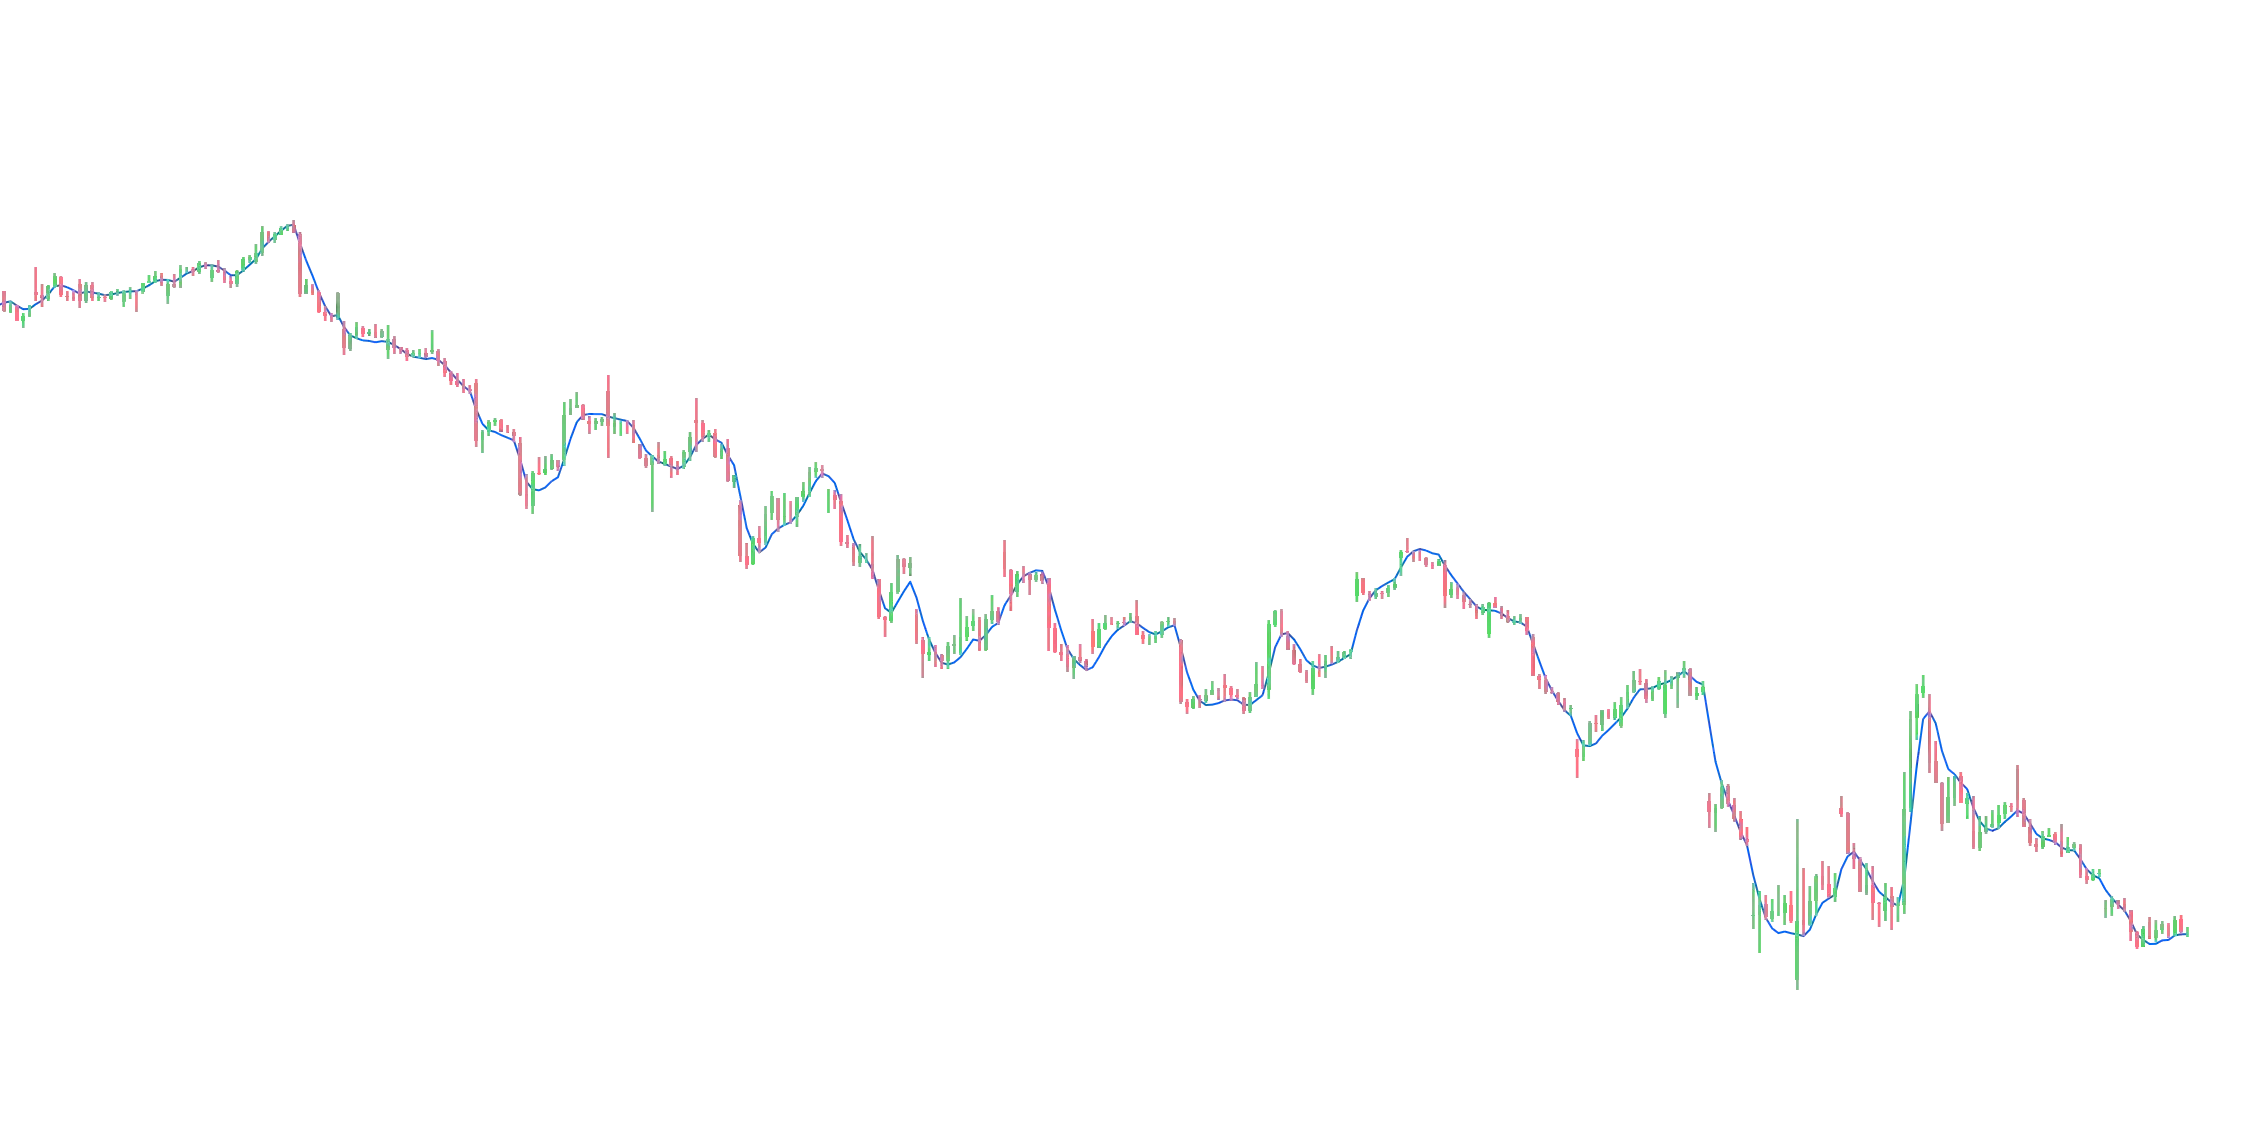
Andean Oscillator Signals Indicator This is a companion indicator intended to be used alongside the Andean Oscillator. It plots signals on the main price panel indicating where crossings have occurred in the oscillator panel. The Andean Oscillator identi…
/indicator/andean-oscillator-signals-23
Daily Rangeimage
Daily Range
This script calculates the daily range (in pips) for the current market, based on the past 50 days (approximately 7 weeks). It’s used as a potential take profit reference in Stefan Kassing’s trading system.
/indicator/daily-range-48
DEMA - Double Exponential Moving Average | Mastrocoinimage
DEMA - Double Exponential Moving Average | Mastrocoin
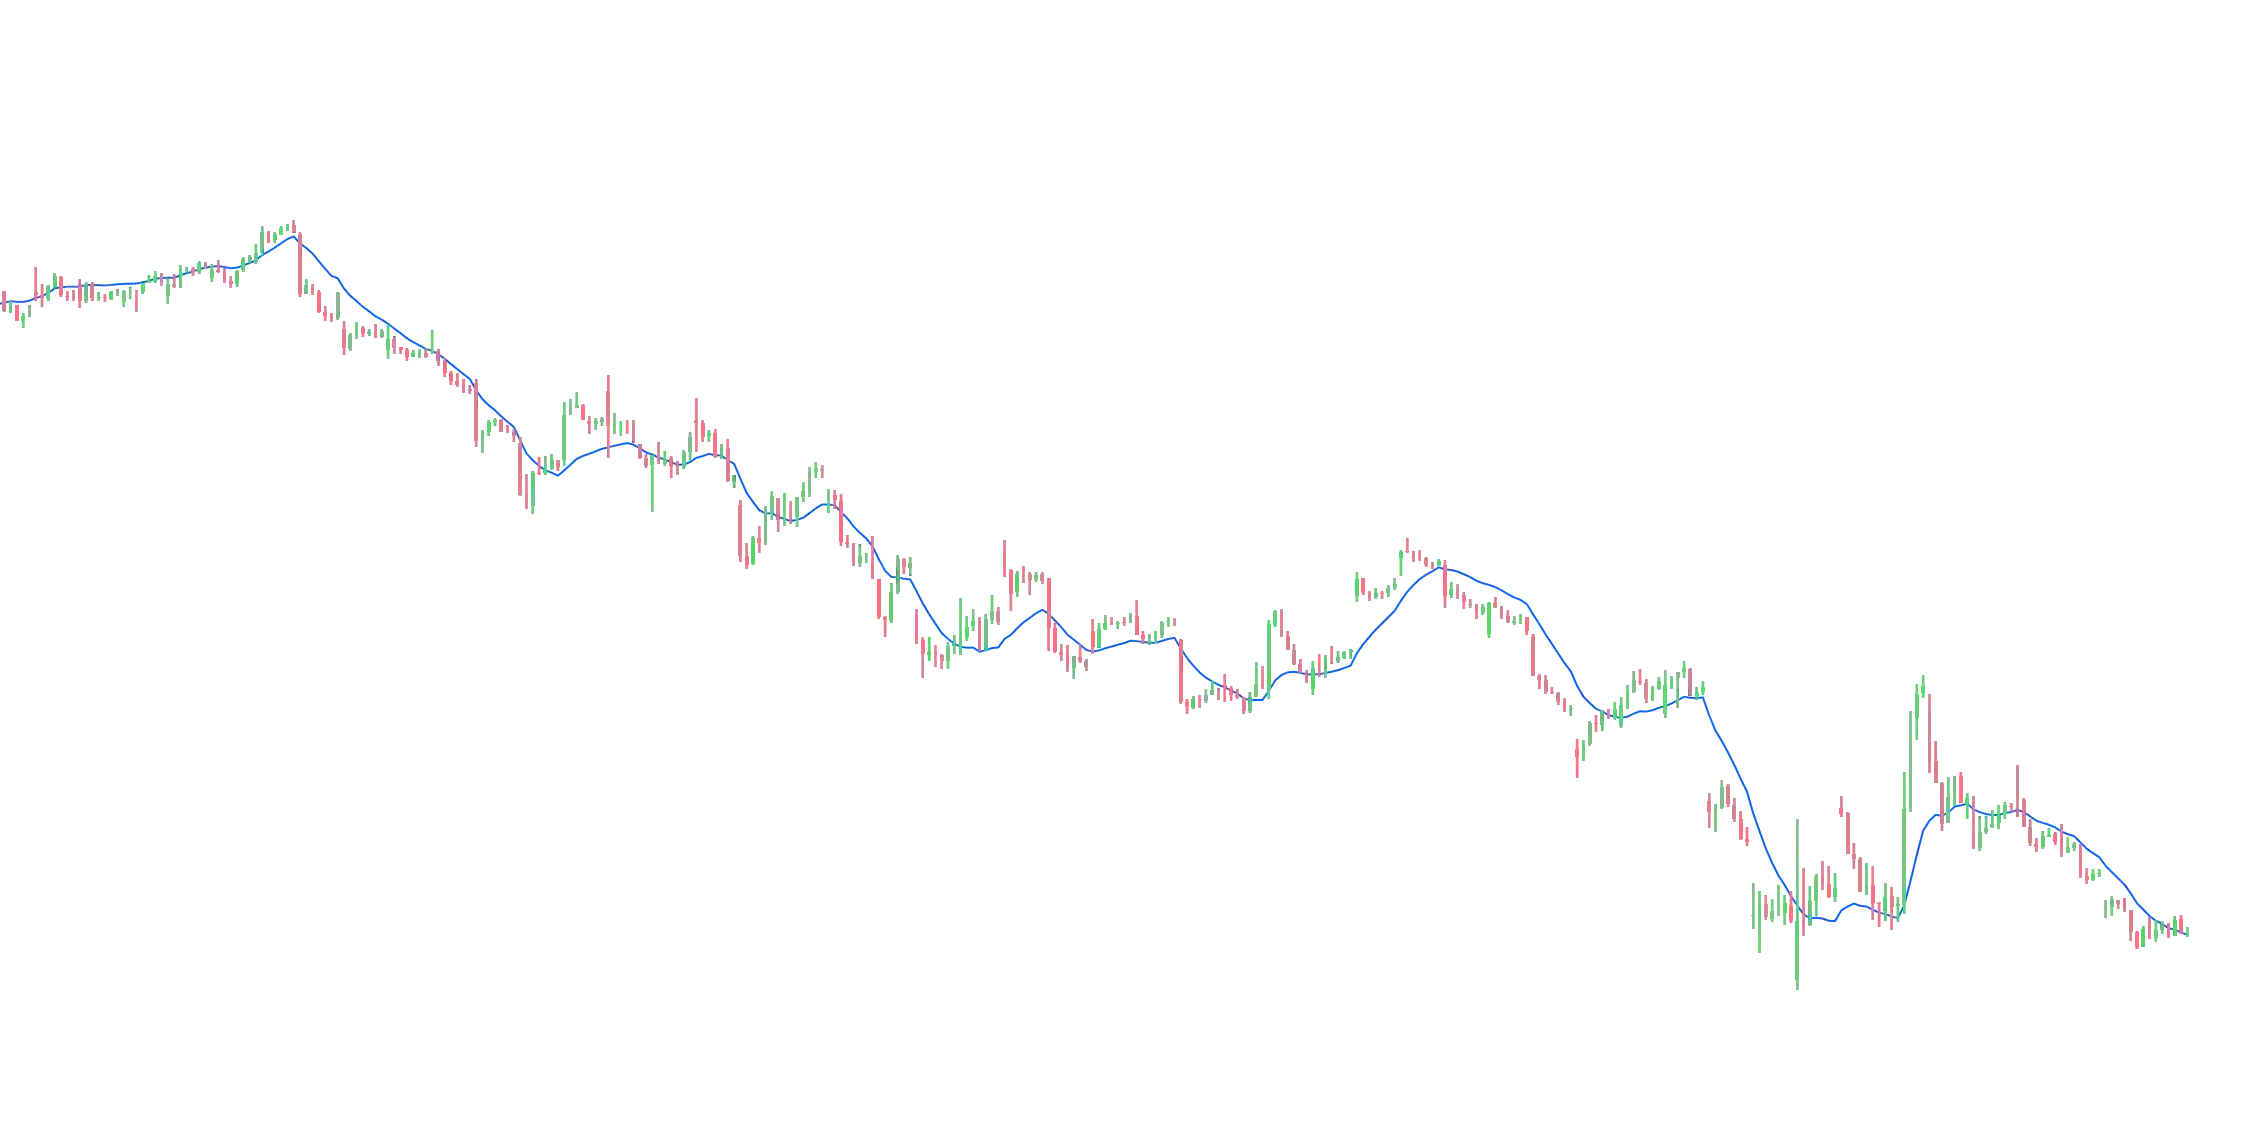
The Double Exponential Moving Average (EMA) is a technical indicator that uses two moving averages to help confirm uptrends when price moves above average, and confirm downtrends when the price moves below average. A trend change might be occurring when …
/indicator/dema-double-exponential-moving-average-mastrocoin-54
Dynamic Andean Oscillatorimage
Dynamic Andean Oscillator
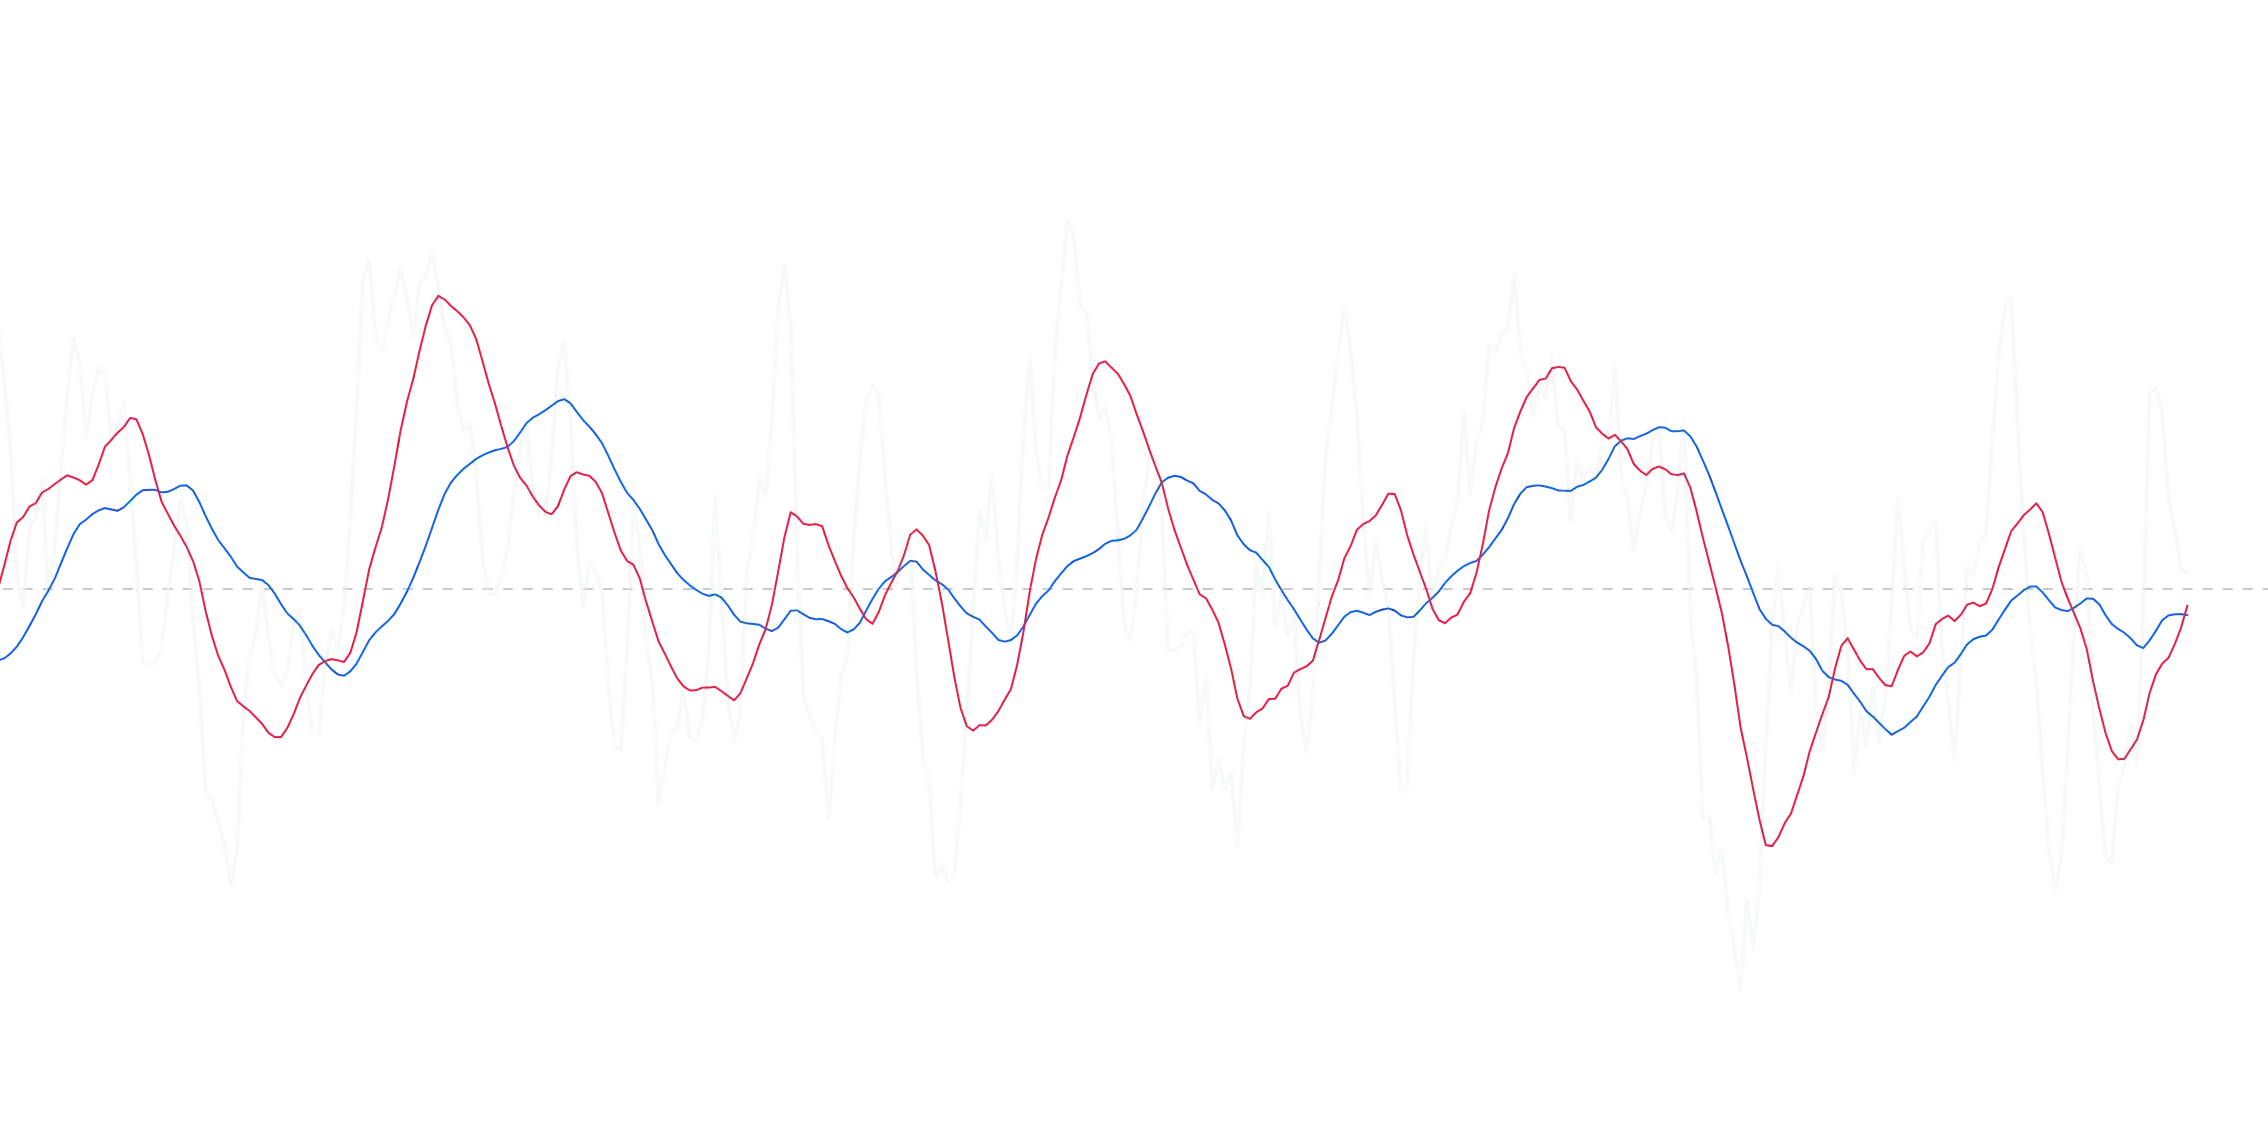
Dynamic Andean Oscillator — Enhanced Indie Version This is a refined implementation of the Andean Oscillator , originally conceptualized by © alexgrover, and redesigned specifically for the Indie platform. The Andean Oscillator utilizes an online algori…
/indicator/dynamic-andean-oscillator-5
Schaff Trend Cycle  (STC)image
Schaff Trend Cycle (STC)
Introduction The STC is a trend indicator that provides early signals and determine trends and filtering signals of other indicators. For information about the STC and how to use it, refer to here ,   here  or here .
/indicator/schaff-trend-cycle-stc-95
Constance Brown Composite Index (Mastrocoin)image
Constance Brown Composite Index (Mastrocoin)
Constance Brown Composite Index was developed by Miss Brown. It is an alternative to the classic RSI, but responds better regardless of trending or ranging markets. If you are not familiar with this tool, you could read her book "Technical Analysis for t…
/indicator/constance-brown-composite-index-mastrocoin-11
MACD Platinum (Mastrocoin)image
MACD Platinum (Mastrocoin)
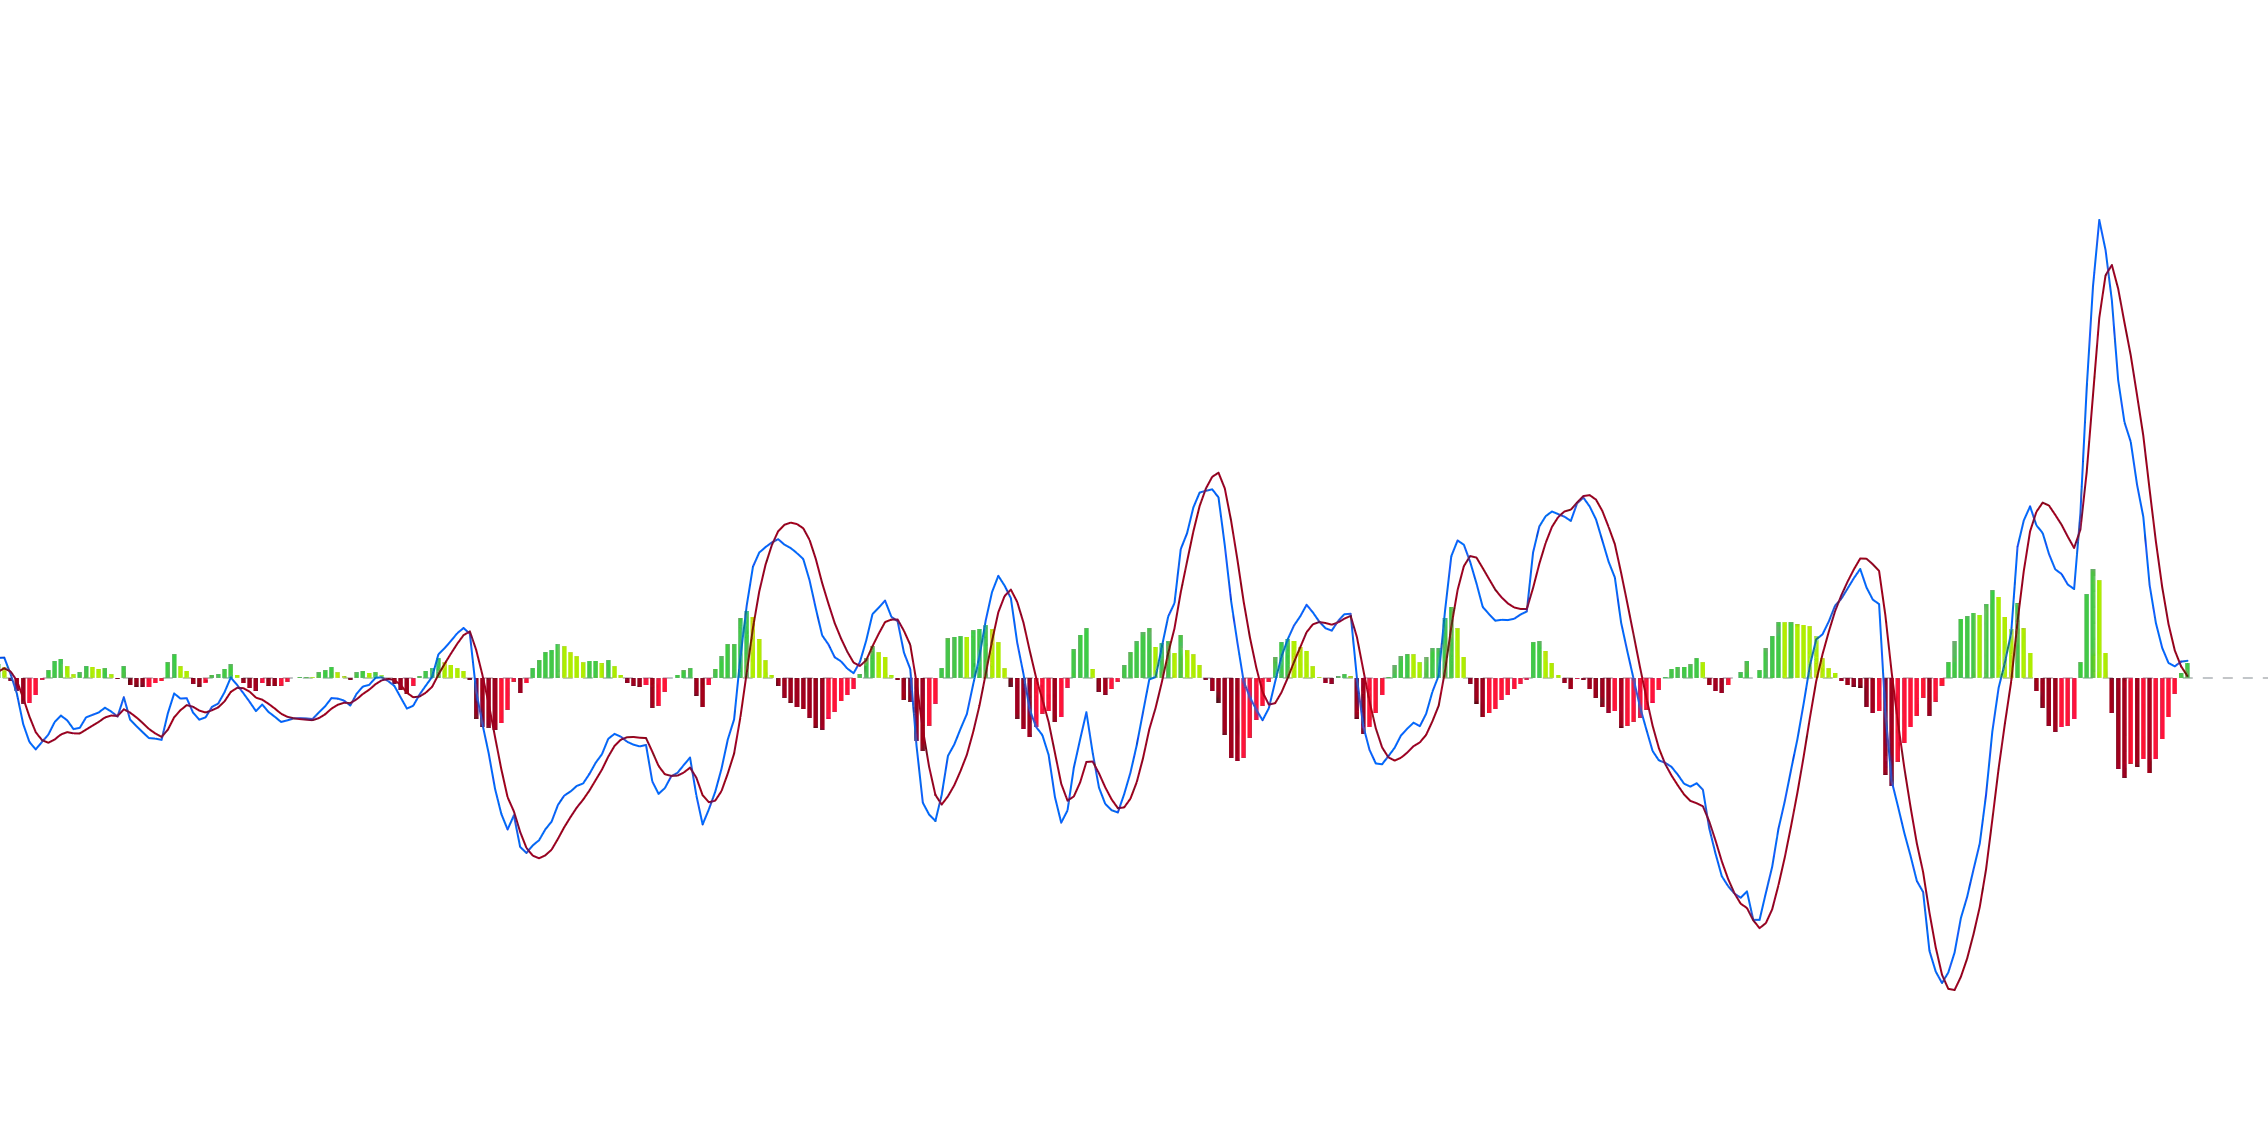
This version of the MACD named MACD Platinum is the  MACD indicator calculated with ZeroLag moving averages (ZLEMA) .  ZLEMA is an abbreviation of  Zero Lag  Exponential  Moving Average . It was developed by John Ehlers and Rick Way. ZLEMA is a kind of…
/indicator/macd-platinum-mastrocoin-19
RSI Smoothed | Mastrocoinimage
RSI Smoothed | Mastrocoin
RSI Smoothed (Mastrocoin) is a refined evolution of the classic Relative Strength Index, designed to provide a smoother and more responsive reading of market movements by reducing noise and enhancing signal quality. Unlike the traditional RSI, this indi…
/indicator/rsi-smoothed-mastrocoin-70
Volume with SMAimage
Volume with SMA
Reason The default volume visual in Takeprofit does not provide for an overlapping SMA on the volume itself that allows you to easily check if the volume for a period is significant compared to the average of the last periods (200 by default).
/indicator/volume-with-sma-10
Enhanced Candlestick Patterns (Beta)image
Enhanced Candlestick Patterns (Beta)
About: (Zoom in if you can't see the signals. You can increase the size in the settings.)  Identifies 10 classic candlestick reversal/continuation patterns with configurable sensitivity and trend confirmation. (More will be added in next versions).  Conf…
/indicator/enhanced-candlestick-patterns-beta-64
Dynamic Volume Profile Oscillator v2image
Dynamic Volume Profile Oscillator v2
A powerful technical indicator that transforms traditional volume analysis into a responsive oscillator by creating dynamic volume profiles and measuring price deviation from volume-weighted equilibrium levels. Overview This indicator provides traders wi…
/indicator/dynamic-volume-profile-oscillator-v2-14
Momentum Sticksimage
Momentum Sticks
These Candlesticks Measure Momentum of the Trend Using My Custom Momentum Formula You can use this indicator to spot reversals, and when the current trend is still going.  Green Candles Above 0 = Current Momentum Moving Up Red Candles Above 0 = Uptrend R…
/indicator/momentum-sticks-12
Fair Value Gap (FVG)image
Fair Value Gap (FVG)
Persistent Fair Value Gap (FVG) Indicator This indicator detects and displays persistent Fair Value Gaps on your charts by comparing price bars from different sessions. It identifies bullish and bearish gaps by checking if the low of the current bar is …
/indicator/fair-value-gap-fvg-36
Elder's Force Index (FI)image
Elder's Force Index (FI)
The  Force Index (FI)  is a technical analysis indicator that combines price movement and volume to assess the strength of buying or selling pressure in a financial instrument. Below is a structured breakdown of its use, effectiveness, and algorithm: Use…
/indicator/elder-s-force-index-fi-79