Bollinger Band Touch Markerimage
Bollinger Band Touch Marker
Bollinger Band Touch Marker  This is a modified Bollinger Band indicator which changes color when the bands are touched or broken.  Settings: Source Periode Multiplikator
/indicator/bollinger-band-touch-marker-6
Ultimate MA - MultiTFimage
Ultimate MA - MultiTF
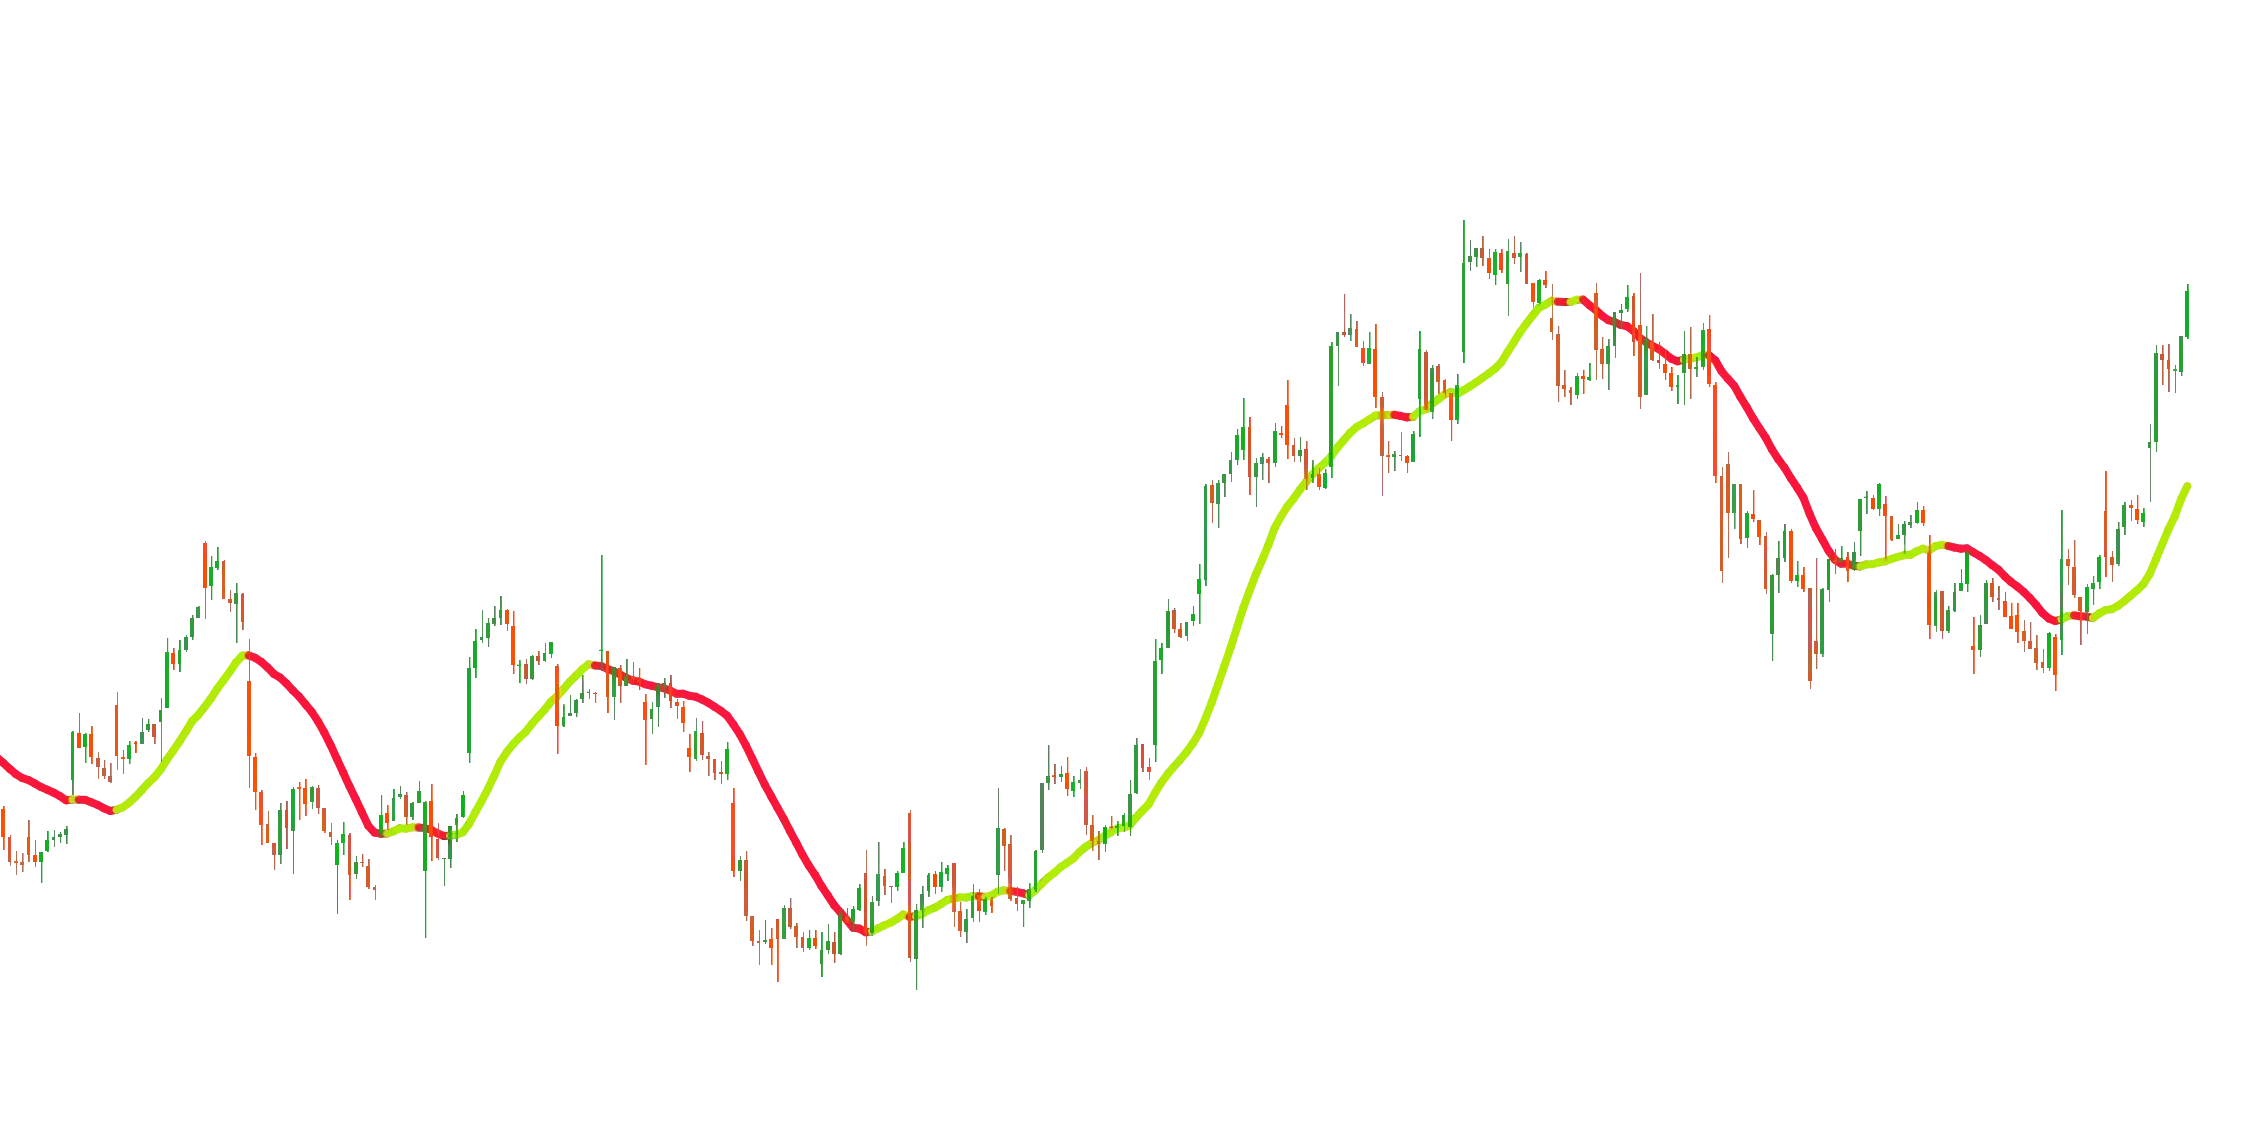
This all-in-one moving average indicator combines all essential moving average types and advanced features into one tool, making it the only moving average indicator you'll ever need. This solution eliminates the need to switch between multiple indicator…
/indicator/ultimate-ma-multitf-10
Simple Crossover Signal Bars for Visual Backtestingimage
Simple Crossover Signal Bars for Visual Backtesting
Adjustable Moving Averages  Bars for Visual Backtesting You can use it in conjunction with the simple bands indicator to create a template. You need to add both indicators to your workspace or channel. Check it out below to see how it relieves eye stra…
/indicator/simple-crossover-signal-bars-for-visual-backtesting-16
Simple Crossover Bandimage
Simple Crossover Band
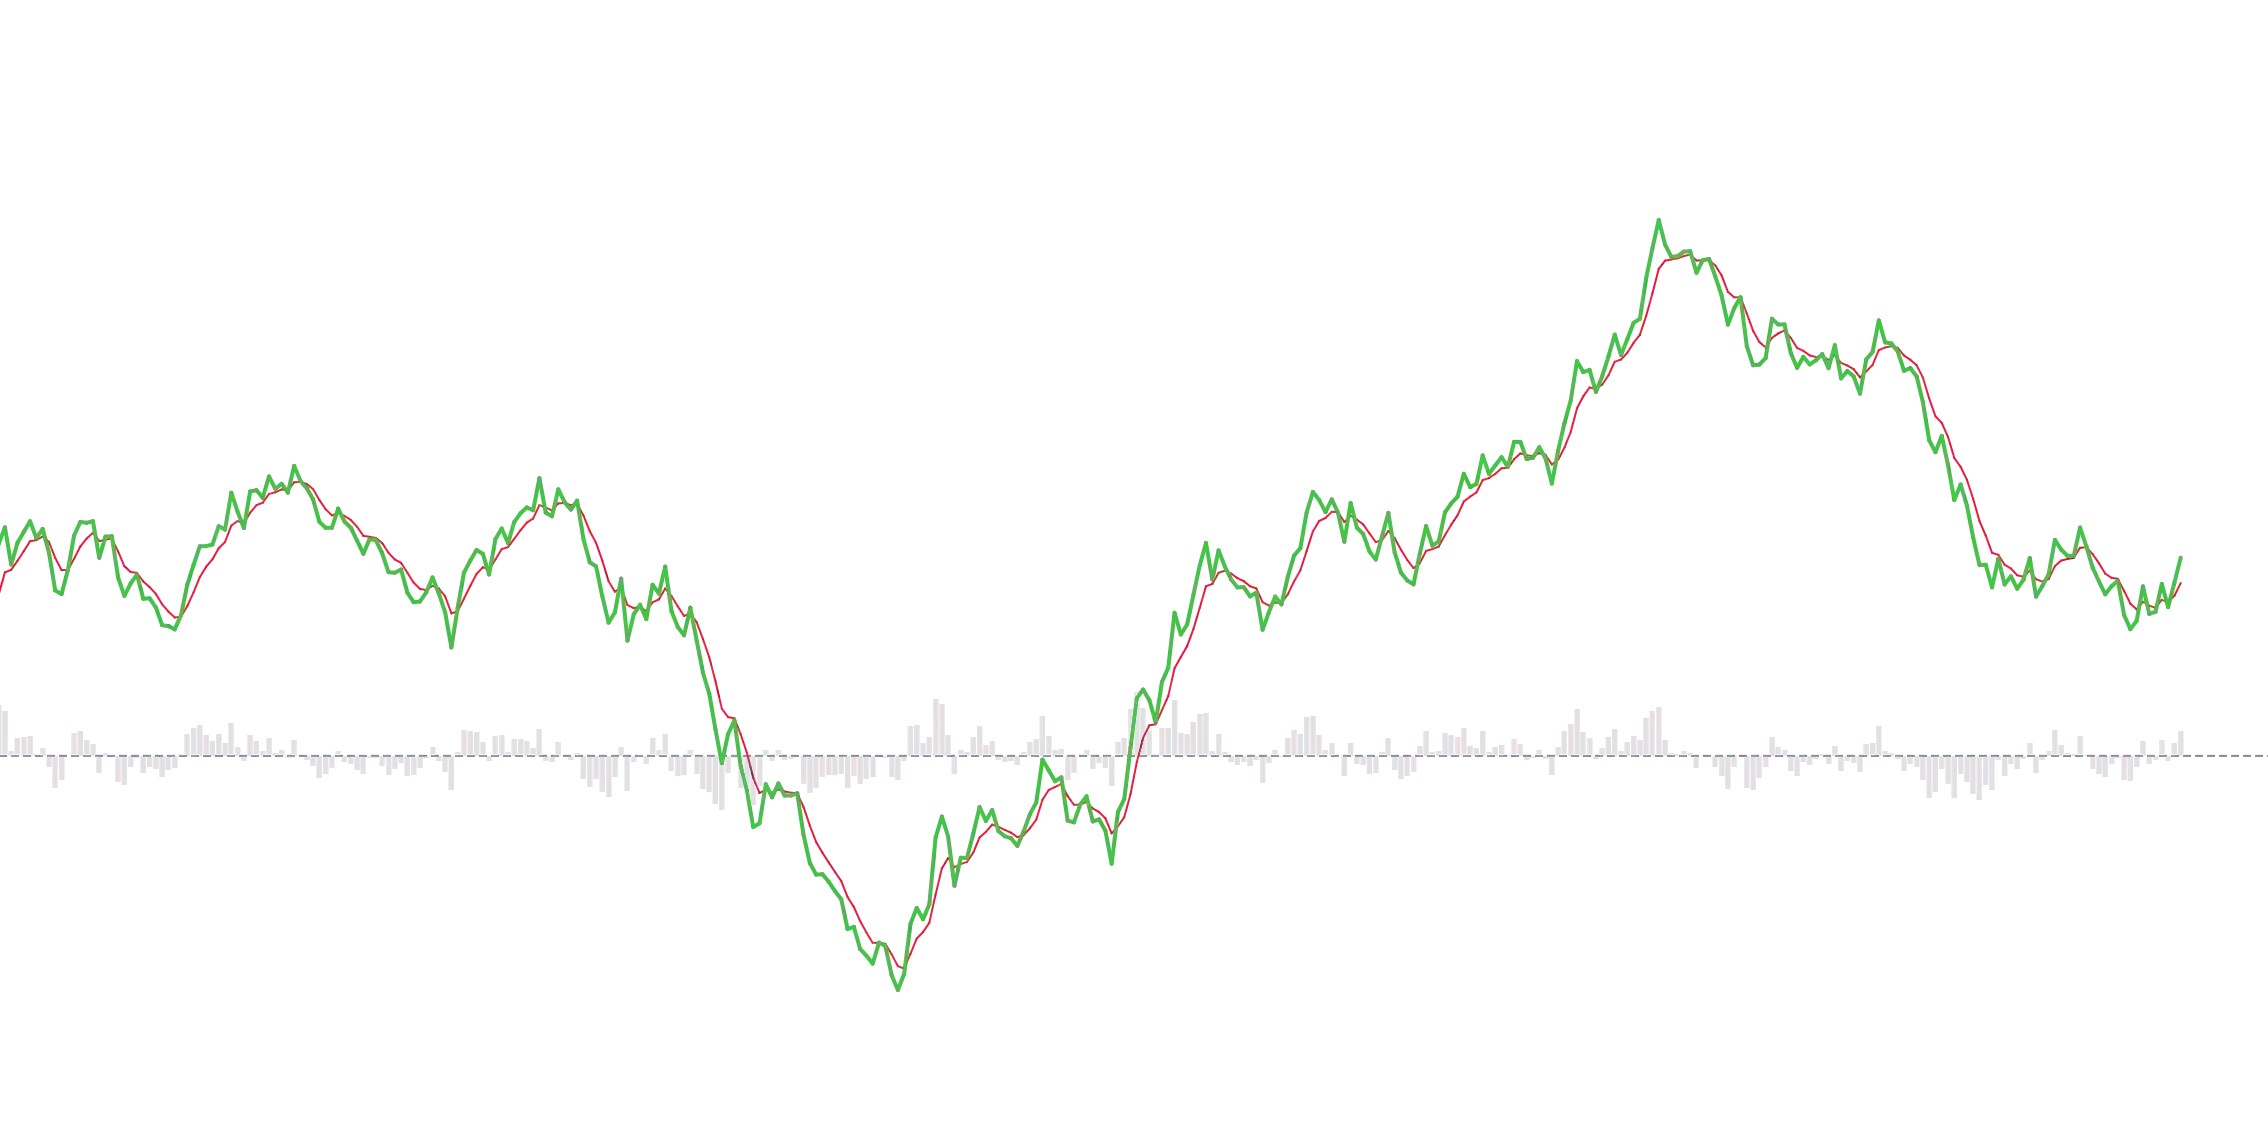
The Simple Crossover Bands indicator is designed to visually represent the relationship between two customizable moving averages directly on the price chart. When the faster moving average (Fast MA) crosses above the slower moving average (Slow MA), a …
/indicator/simple-crossover-band-68
Squeeze Momentumimage
Squeeze Momentum
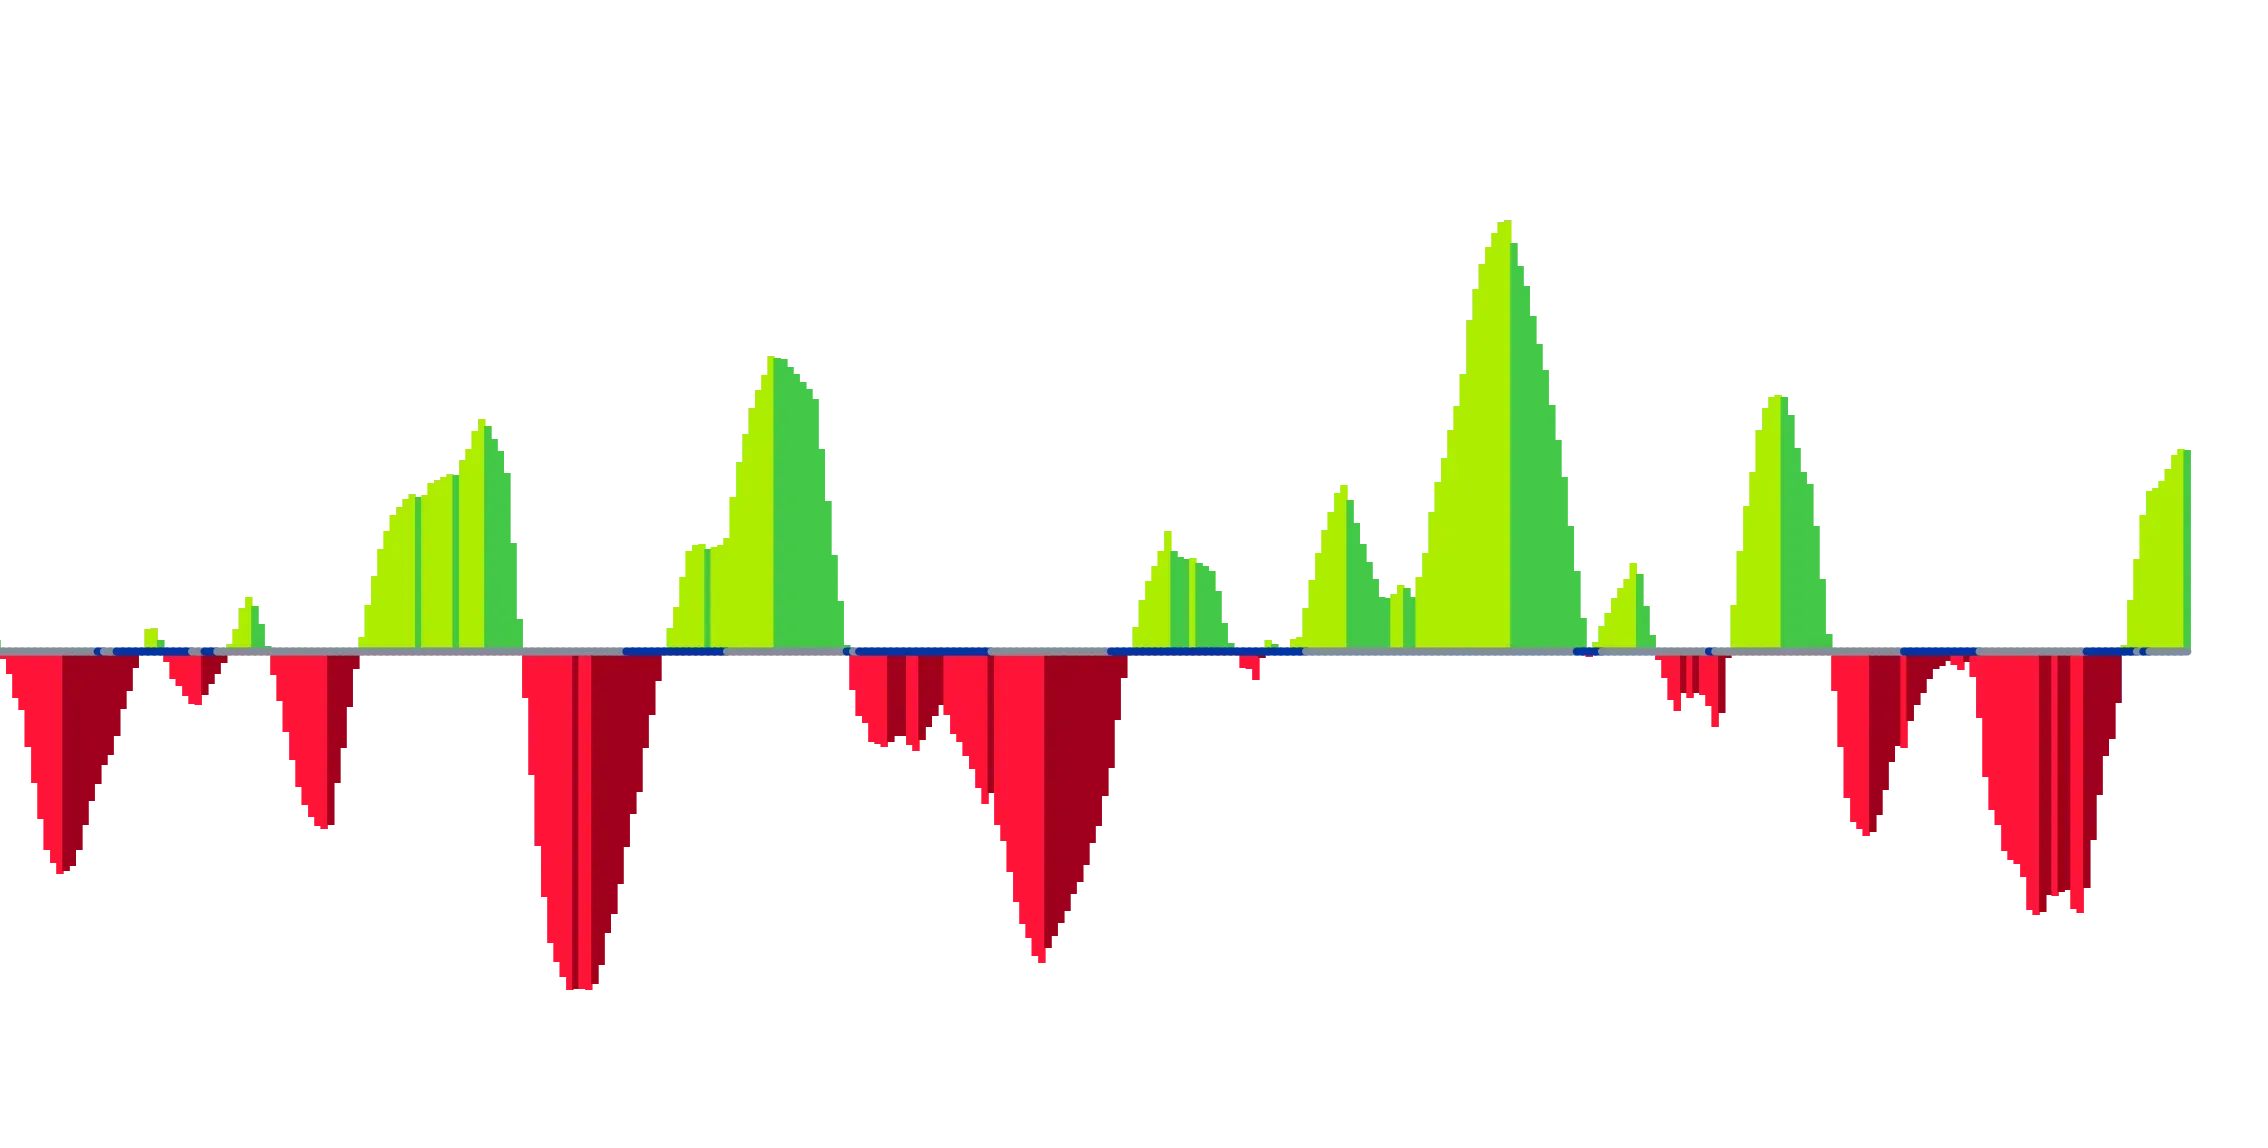
This indicator is an adaptation of John Carter's "TTM Squeeze" volatility indicator, described in chapter 11 of his book Mastering the Trade. Unlike Carter's original method, which uses a simple momentum indicator, this version applies a linear regressio…
/indicator/squeeze-momentum-75
MACD + Histogramimage
MACD + Histogram
Boost your Trading Insights with the MACD + Histogram Indicator The MACD + Histogram indicator is your powerful tool for identifying trend shifts and gauging momentum strength in real-time. Combining the MACD Line, Signal Line, and dynamic Histogram, thi…
/indicator/macd-histogram-33
Custom VWAP - usage example of indie.Schedule classimage
Custom VWAP - usage example of indie.Schedule class
We have recently released an update to Indie language 4.4 , which now includes new types for managing time periods: indie.schedule.ScheduleRule ,  indie.schedule.Schedule  and  indie.TradingSession . The "Custom VWAP" indicator demonstrates the usage o…
/indicator/custom-vwap-usage-example-of-indie-schedule-class-23
Sma-Ema Crossover - usage example of indie.Var[T]image
Sma-Ema Crossover - usage example of indie.Var[T]
With the recent update to  Indie language 4.3 , we've introduced the  indie.Var[T]  container. This new container type functions similarly to  indie.MutSeries[T] , but it has a single-value history depth, making it ideal for storing and updating the curr…
/indicator/sma-ema-crossover-usage-example-of-indie-var-t-90
Green/Red Bar Count - usage example of indie.Var[T]image
Green/Red Bar Count - usage example of indie.Var[T]
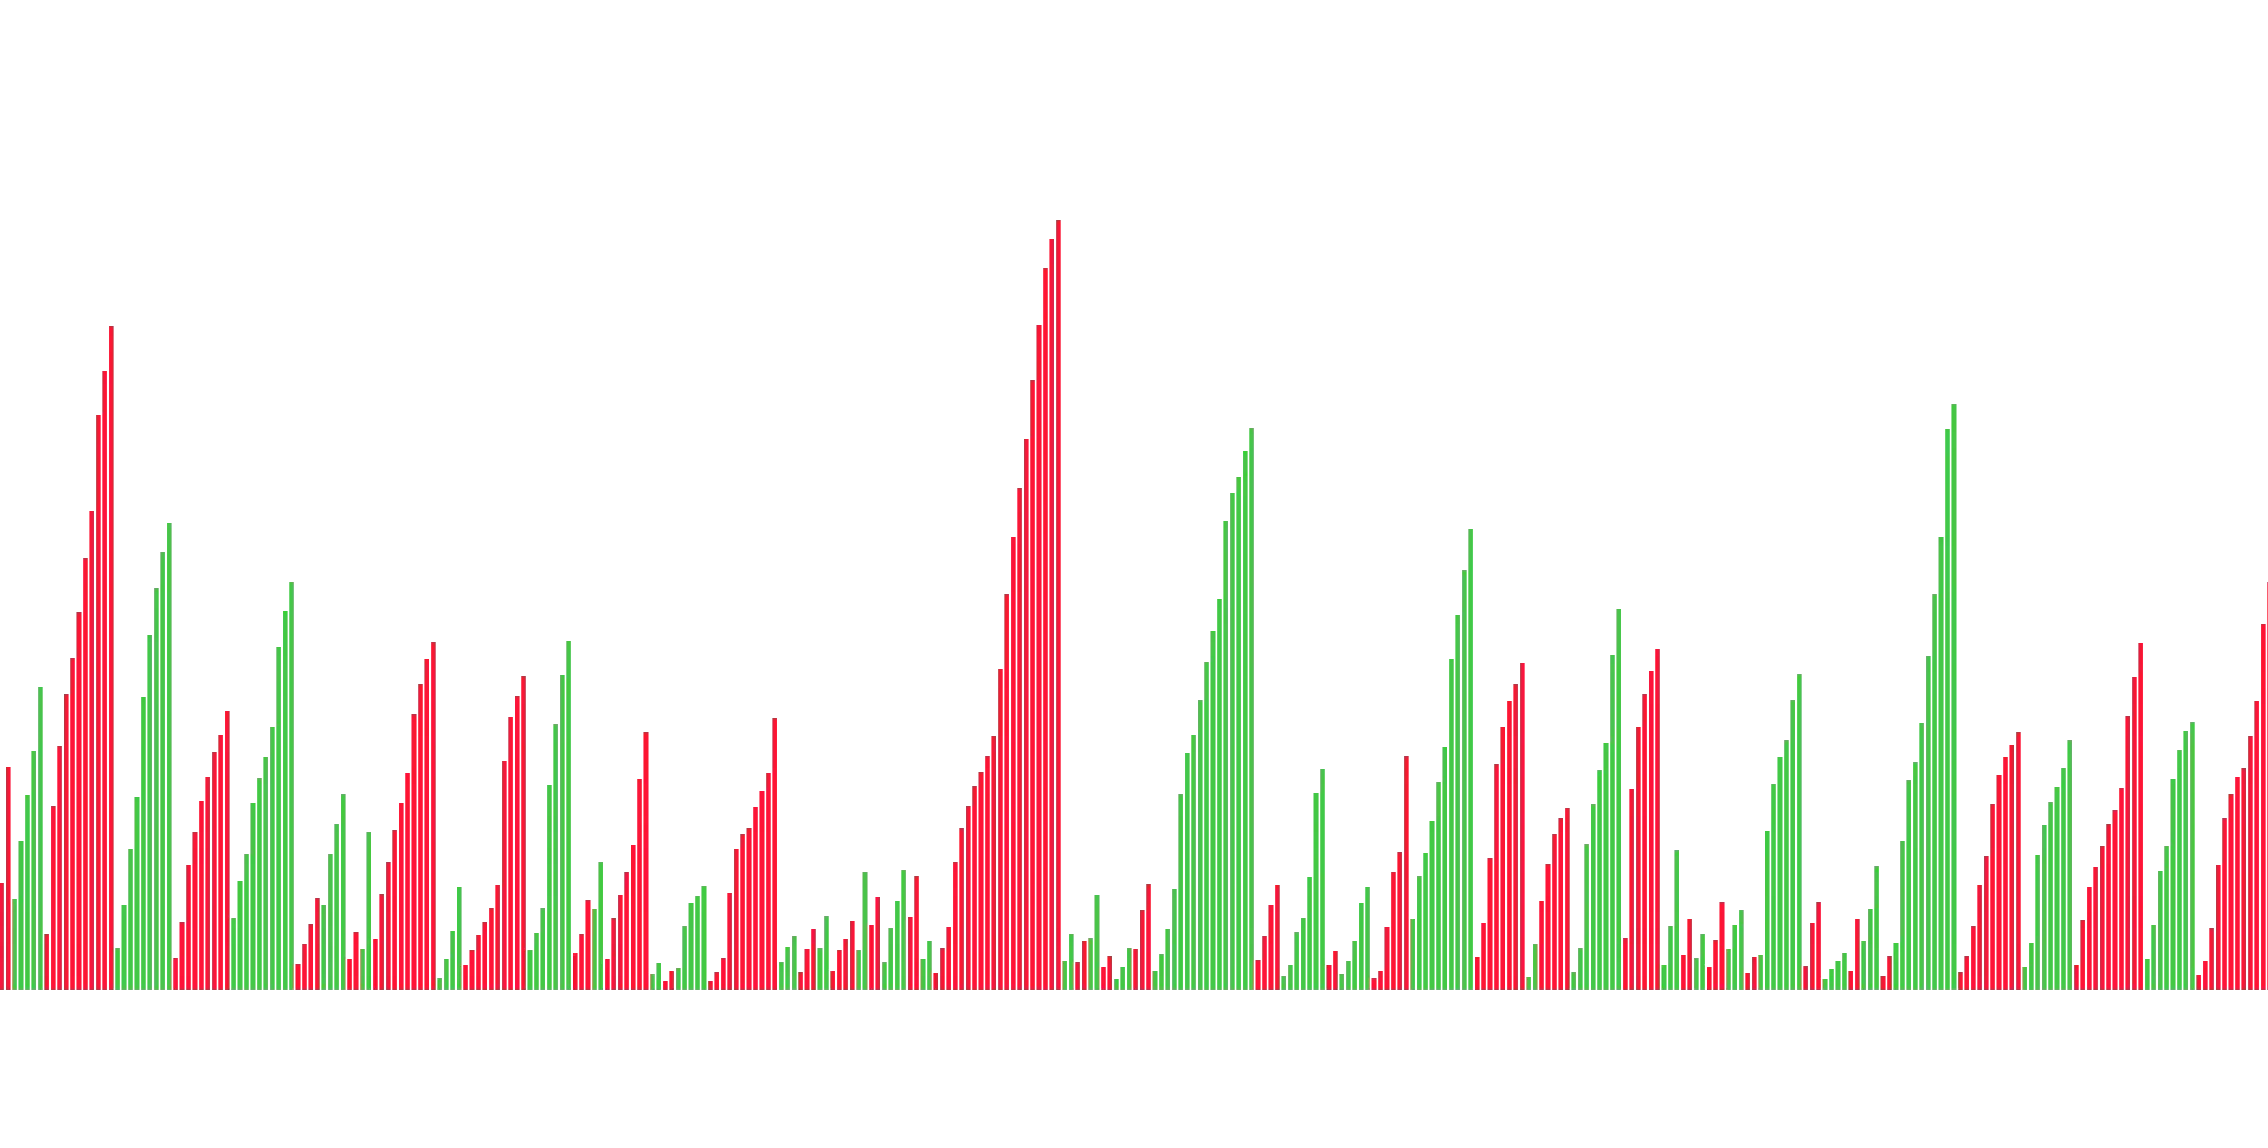
This update of  "Green/Red Bar Counts"  indicator showcases the latest feature in  Indie language 4.3 , the  indie.Var[T]  container. In this implementation: State Tracking : The  indie.Var[T]  container counts consecutive green (up) or red (down) bars w…
/indicator/green-red-bar-count-usage-example-of-indie-var-t-93
ZLEMAimage
ZLEMA
ZLEMA ZLEMA stands for Zero Lag Exponential Moving Average, developed by John Ehlers and Rick Way. Unlike a standard Exponential Moving Average, ZLEMA aims to minimize the inherent lag typically associated with moving averages and other trend-following i…
/indicator/zlema-14
Volume Flow Indicatorimage
Volume Flow Indicator
The Volume Flow Indicator (VFI), developed by Markos Katsanos, is based on the popular On Balance Volume (OBV) but features three important enhancements: VFI values provide clear signals: positive readings indicate bullish conditions, while negative read…
/indicator/volume-flow-indicator-76
Market Facilitation Index Squat Bars [Skyrexio]image
Market Facilitation Index Squat Bars [Skyrexio]
The  Market Facilitation Index (MFI)  indicator implemented in this code allows for visualizing how efficiently price movements are influenced by trading volume. Based on the methods of Bill Williams, this indicator helps identify key moments in the  cry…
/indicator/market-facilitation-index-squat-bars-skyrexio-18
Weis Wave Volumeimage
Weis Wave Volume
This indicator analyzes market volume and visualizes it as wave charts, making it easy to identify key inflection points and zones of supply and demand. For optimal results, customize it for your instrument (not compatible with Forex) by adjusting the "T…
/indicator/weis-wave-volume-57
2-Period RSI Strategyimage
2-Period RSI Strategy
Originally developed by Larry Connors, the 2-period RSI strategy is a straightforward mean-reversion approach that aims to buy or sell after short corrective moves in the market. Traders look for buying opportunities when the 2-period RSI drops below 10,…
/indicator/2-period-rsi-strategy-51
Fibonacci Bollinger Bandsimage
Fibonacci Bollinger Bands
These Bollinger Bands incorporate Fibonacci retracements to clearly highlight areas of support and resistance. The bands are calculated based on the Volume Weighted Moving Average (VWMA), with a width of 3 standard deviations from the mean. This range sh…
/indicator/fibonacci-bollinger-bands-93