Ultra Trend Alertsimage
Ultra Trend Alerts
Based on UT Bot Alerts idea Ultra Trend Alerts is a volatility-based trend-following indicator designed to capture market reversals and manage position exits. This tool creates a dynamic trailing stop based on the Average True Range (ATR), effectively fi…
/indicator/ultra-trend-alerts-93
BB + RSI Double Cross Strategyimage
BB + RSI Double Cross Strategy
Bollinger Bands + RSI Double Strategy indicator A dual-confirmation mean-reversion indicator combining Bollinger Bands and RSI to identify high-probability reversal points. Based on ChartArt's strategy concept (v1.1) Overview This indicator generates sig…
/indicator/bb-rsi-double-cross-strategy-8
Universal Forecast Funnel [UFF]image
Universal Forecast Funnel [UFF]
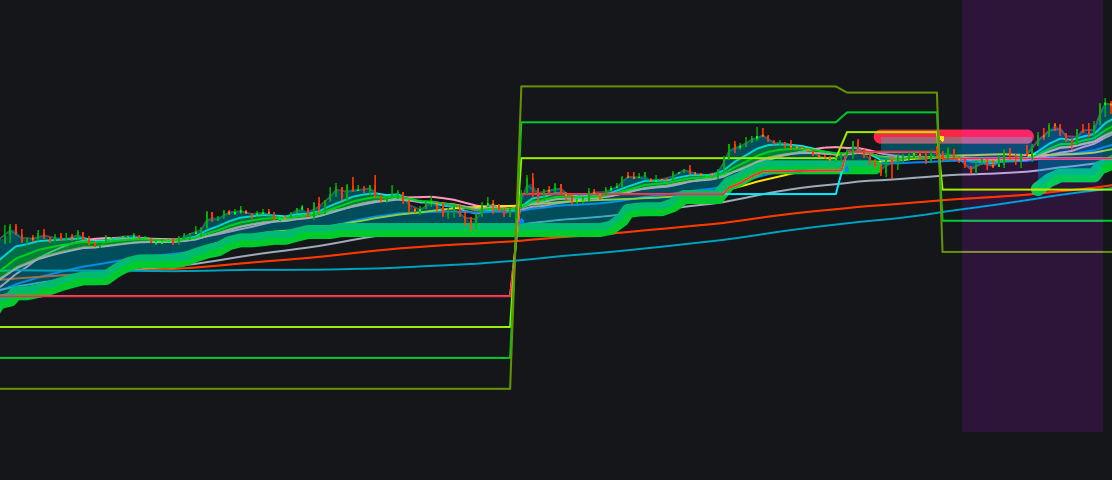
Free version (See also Ultimate Version) Statistical projection tool based on Robust Weighted Least Squares (WLS). Visualizes trend direction and volatility bounds using Standard Error of the Forecast Description UFF is a statistical tool designed to pro…
/indicator/universal-forecast-funnel-uff-55
Classic NVI/PVI Fosbackimage
Classic NVI/PVI Fosback
Overview The Negative Volume Index (NVI) and Positive Volume Index (PVI) are classic volume-based indicators developed by Norman Fosback in his 1976 book "Stock Market Logic" . These indicators help identify smart money (institutional) vs. crowd (re…
/indicator/classic-nvi-pvi-fosback-48
Awesome / Accelerator / Zone Oscillatorimage
Awesome / Accelerator / Zone Oscillator
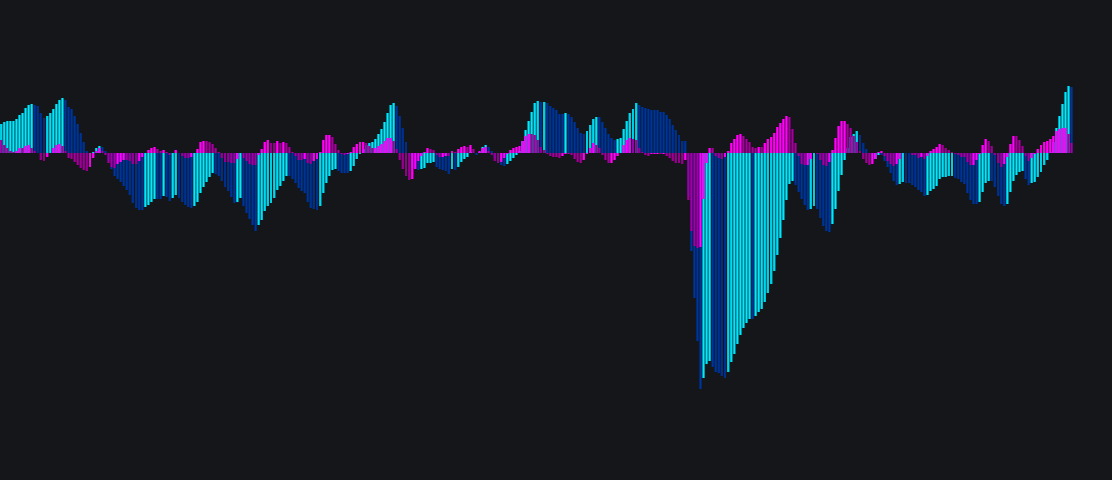
Overview The Awesome / Accelerator / Zone Oscillator is a comprehensive momentum indicator based on Bill Williams' concepts from "New Trading Dimensions". It combines three oscillators into a single visualization: the Awesome Oscillator (AO), Accelerator…
/indicator/awesome-accelerator-zone-oscillator-38
TriGate Confluence Scalperimage
TriGate Confluence Scalper
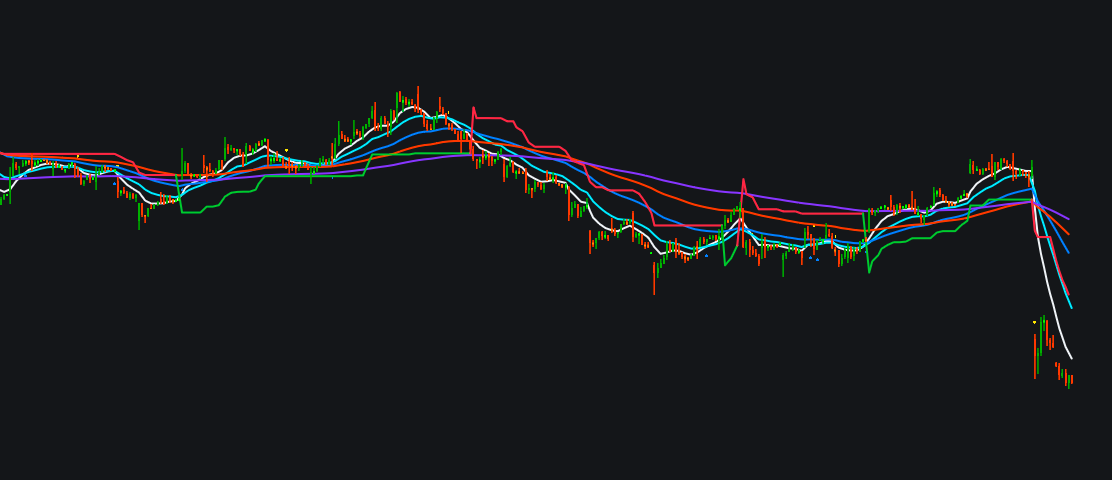
What it is TriGate Confluence Scalper was built from years of practical trading and research into what actually works under pressure. It combines momentum, trend direction, and market regime filters to cut through noise and highlight genuine opportuniti…
/indicator/trigate-confluence-scalper-90
EMA Scriptsimage
EMA Scripts
This script is for day traders who are looking for quick buy and sell action based on EMA movements of the stock. Hope you like it!
/indicator/ema-scripts-1
EMA + Supertrendimage
EMA + Supertrend
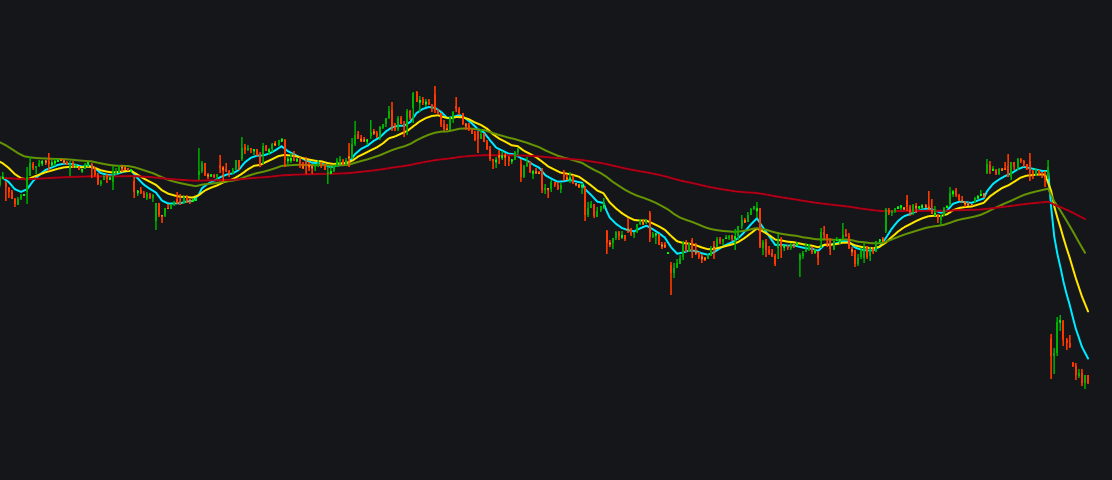
A clean trend overlay that combines five EMAs (9/21/50/100/200) with a color-switched Supertrend and simple BUY/SELL labels from the EMA-9 × EMA-21 crossover. It’s built to show structure (EMAs), direction (Supertrend), and timing (crossovers) without cl…
/indicator/ema-supertrend-7
Halloween Strategy 🎃image
Halloween Strategy 🎃
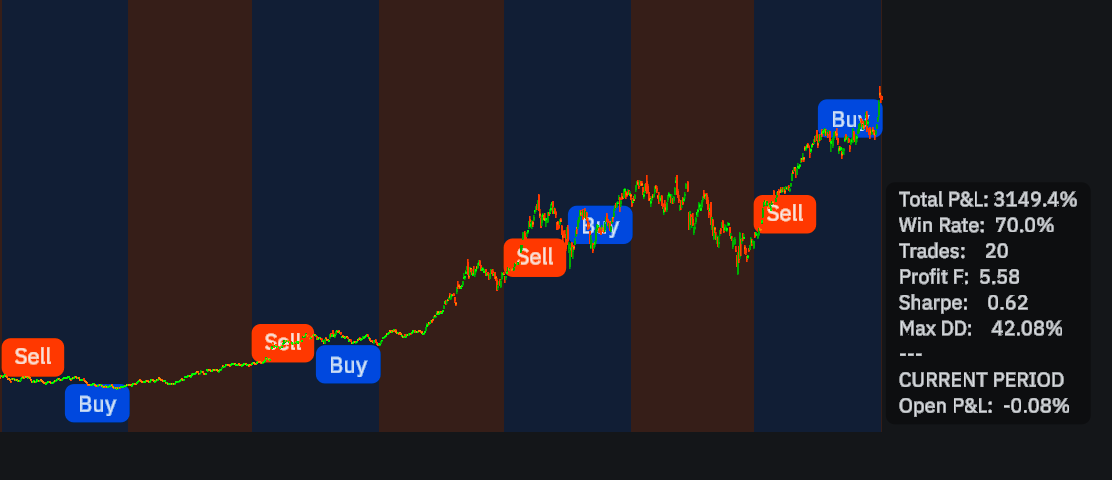
Indie indicator that visualizes the Halloween Effect end-to-start: it shades Oct 31→May 1 as the in-season window, auto-places Buy on Oct 31 and Sell on May 1, and renders a compact performance panel versus buy-and-hold with key stats (total P&L, win rat…
/indicator/halloween-strategy-74
Breakout Linesimage
Breakout Lines
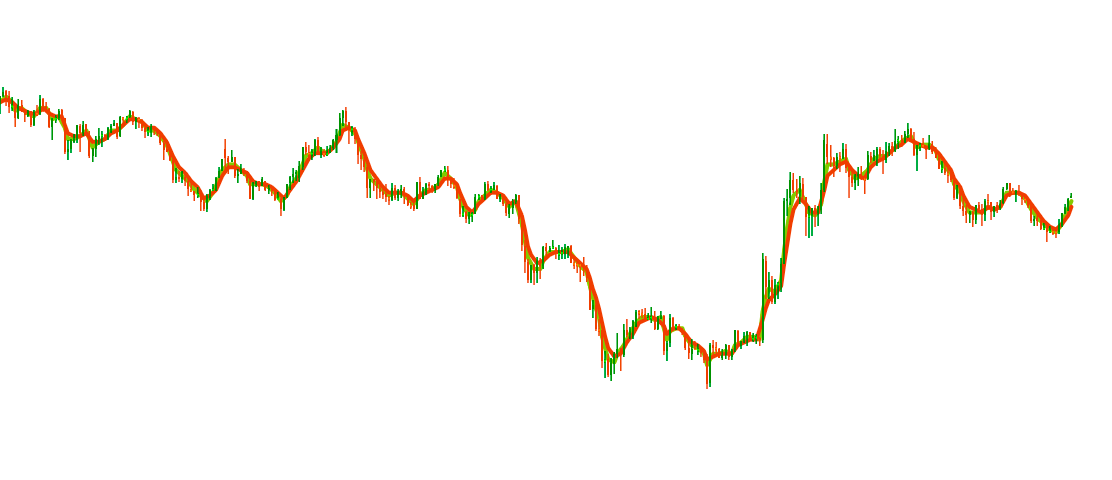
Breakout Lines by XEB06 ! This isn't any magical Indicator or the Holy Grail. This is a simple indicator based on the EMA 3 and 5. Calculated on HLC while ignoring Open price for smoothing the price. Generally works on Stocks, Indices, Metals, BTC and ET…
/indicator/breakout-lines-11
9 & 21 EMA Crossover with Backgroundimage
9 & 21 EMA Crossover with Background
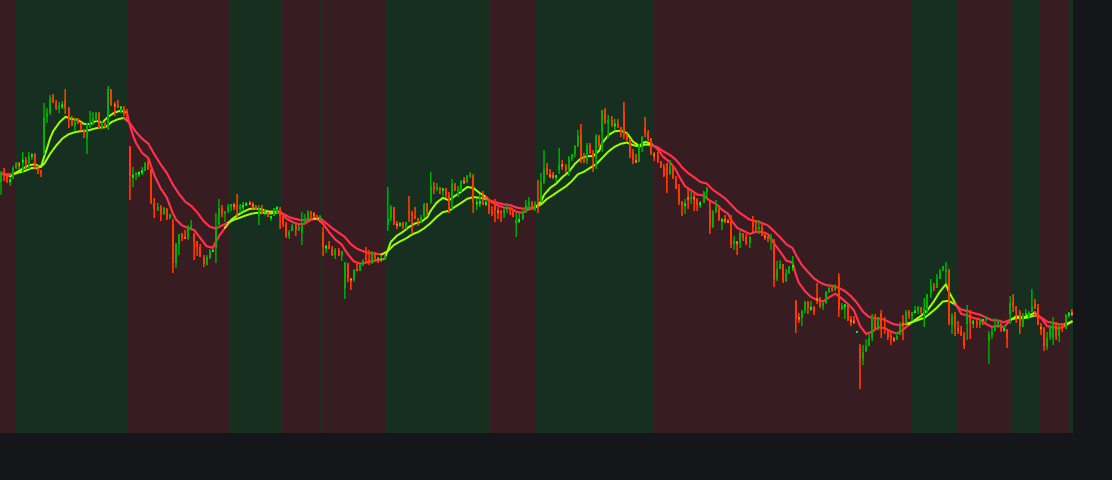
EMA 9/21 Crossover – Dynamic Trend Visualizer Unlock trend signals with this EMA crossover indicator! It overlays 9-period (fast) and 21-period (slow) Exponential Moving Averages, and kicks your chart into high gear with color-coded lines and auto-adjust…
/indicator/9-21-ema-crossover-with-background-81
Highlight Crossover - Background Color Exampleimage
Highlight Crossover - Background Color Example
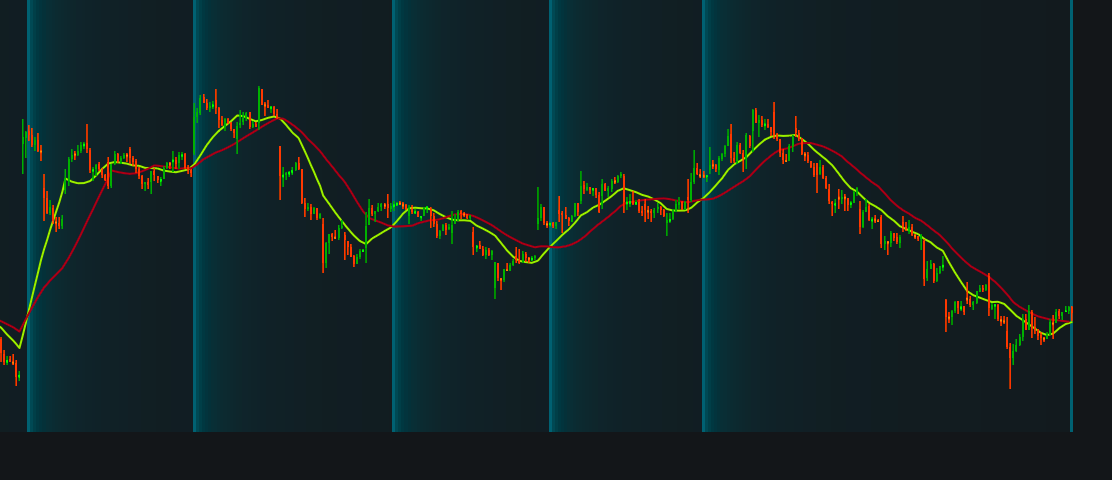
This educational indicator demonstrates how to use the  @plot.background()  decorator in Indie to visually highlight important market events. The indicator tracks crossovers between 15 and 30-period SMAs. When the fast SMA crosses above the slow SMA, it …
/indicator/highlight-crossover-background-color-example-76
ICT Concepts: FVG, Liquidity, BOS, MSS by Bigshotimage
ICT Concepts: FVG, Liquidity, BOS, MSS by Bigshot
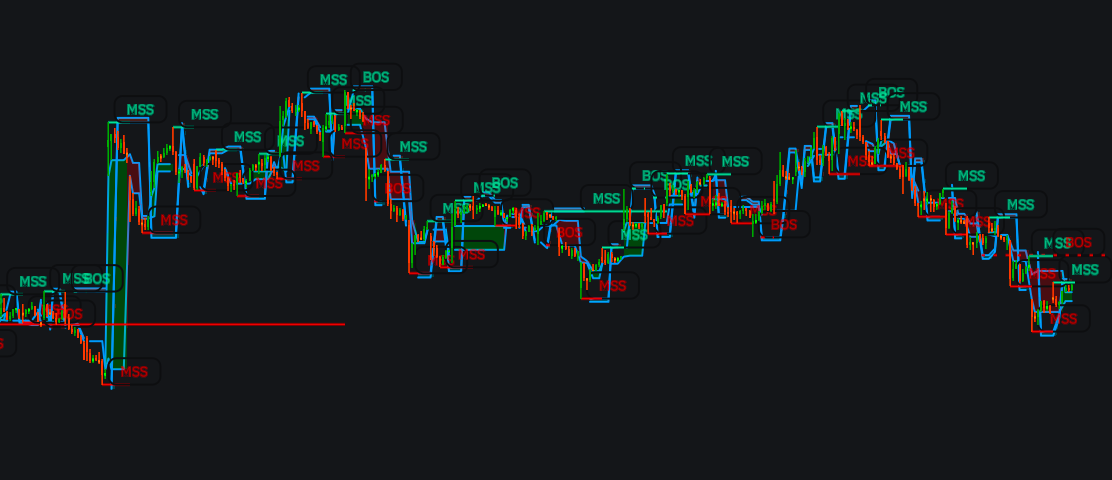
What This Indicator Does This comprehensive tool combines four essential ICT concepts into one powerful indicator: 🟢 Fair Value Gaps (FVG)  - Automatically detects and displays bullish and bearish imbalance zones where price is likely to return. These a…
/indicator/ict-concepts-fvg-liquidity-bos-mss-by-bigshot-81
Support & Resistanceimage
Support & Resistance
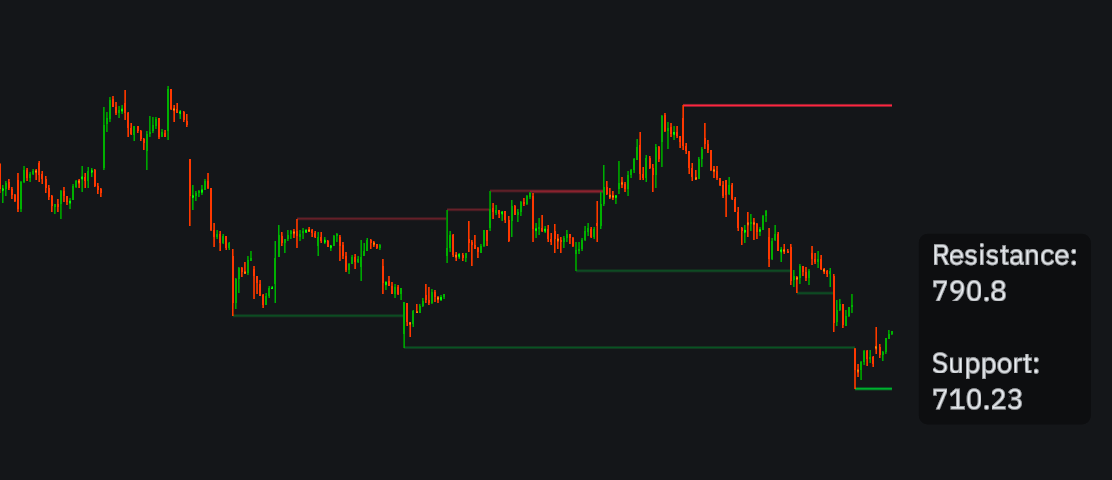
Description: Displays Support and Resistance based on High & Low Pivot Points and a table with the latest unbroken levels. Custom higher timeframes are also supported. You can opt to display all available levels, or only last N levels. You can also hide …
/indicator/support-resistance-97
[CrabVenom] WaveTrend Proimage
[CrabVenom] WaveTrend Pro
🌊 WaveTrend with Dynamic Zones - Ultimate Trading Indicator 🙏  CREDITS & ACKNOWLEDGEMENTS This indicator builds upon the groundbreaking work of: LazyBear  - Original WaveTrend oscillator concept and formula AdonisWerther  - Dynamic Zone probability-bas…
/indicator/crabvenom-wavetrend-pro-82