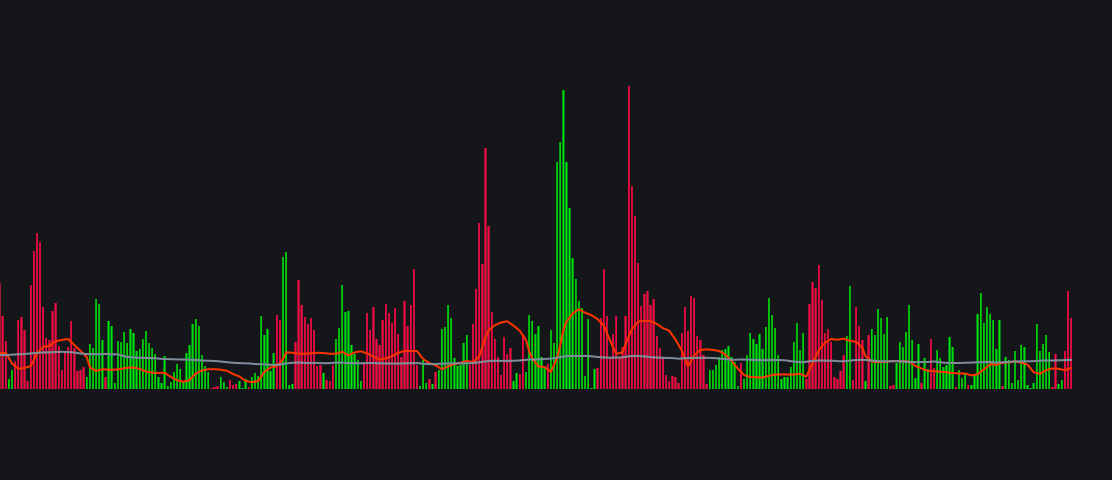

Waddah Attar Explosion Histogram
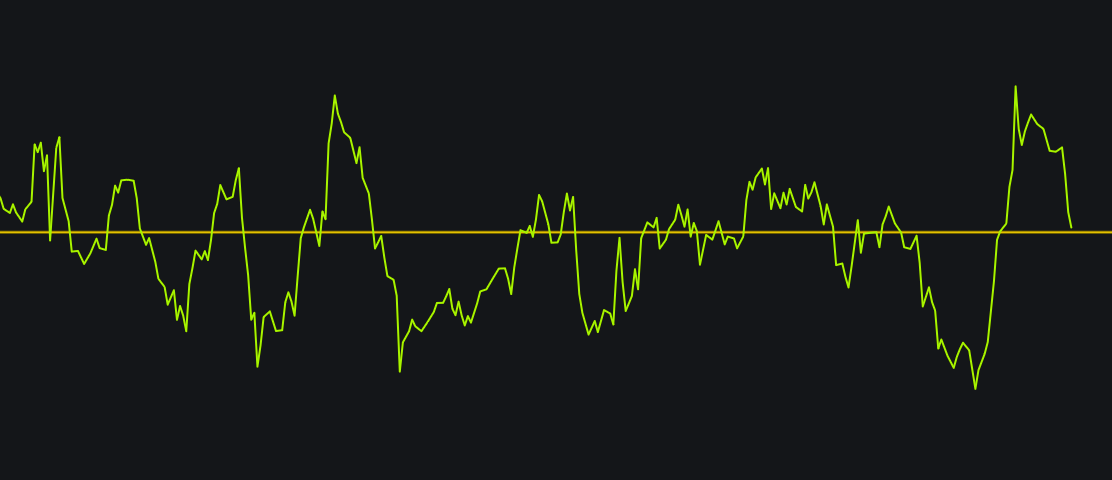
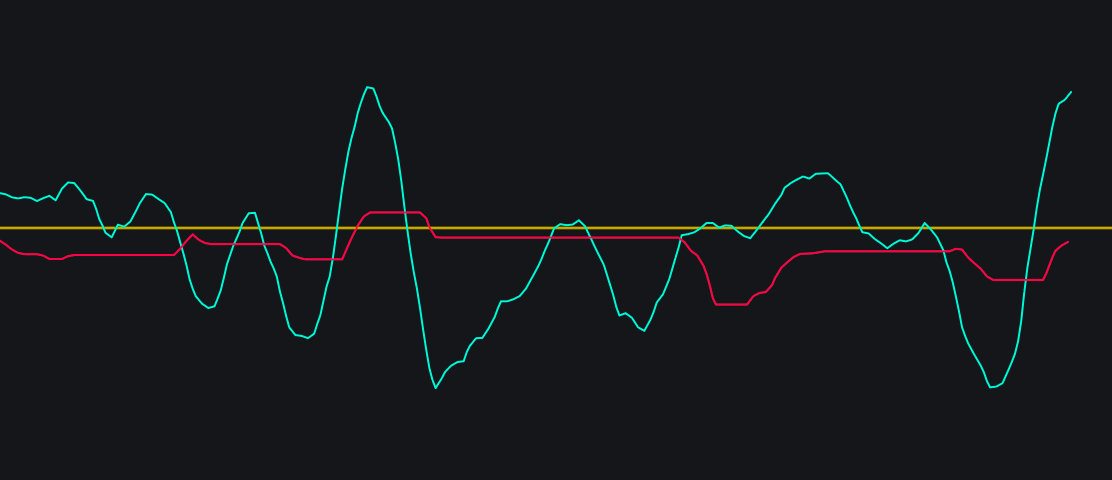
There are three components to this indicator; green histograms , red histograms , and a red “explosion” line . The red histogram indicates the current downtrend. The green histogram indicators the current uptrend. The yellow line’s direction shows the…
There are three components to this indicator; green histograms , red histograms , and a red “explosion” line . The red histogram indicates the current downtrend. The green histogram indicators the current uptrend. The yellow line’s direction shows the…