Imperial Sessionsimage
Imperial Sessions
This indicator is meant to help in technical analysis so traders can can be able to track sessions, so lets go well, remember to use proper risk management
/indicator/imperial-sessions-27
Heiken Ashi Smoothed image
Heiken Ashi Smoothed
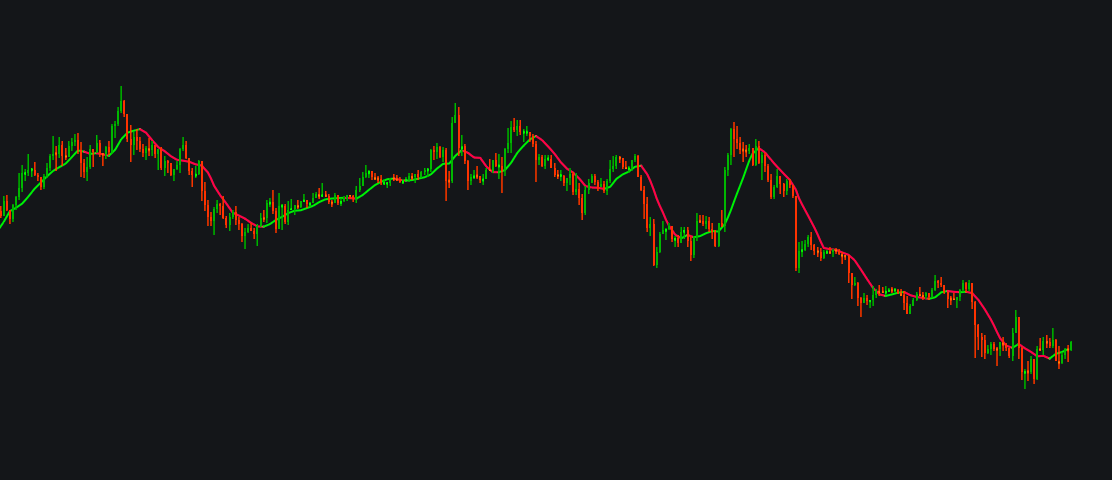
Heiken Ashi Smoothed is an advanced technical analysis tool that takes the traditional Heiken Ashi candlestick formula and applies moving averages to filter out market noise. By plotting these as smoothed candles or a moving average line, traders can ea…
/indicator/heiken-ashi-smoothed-16
Fisher Transformimage
Fisher Transform
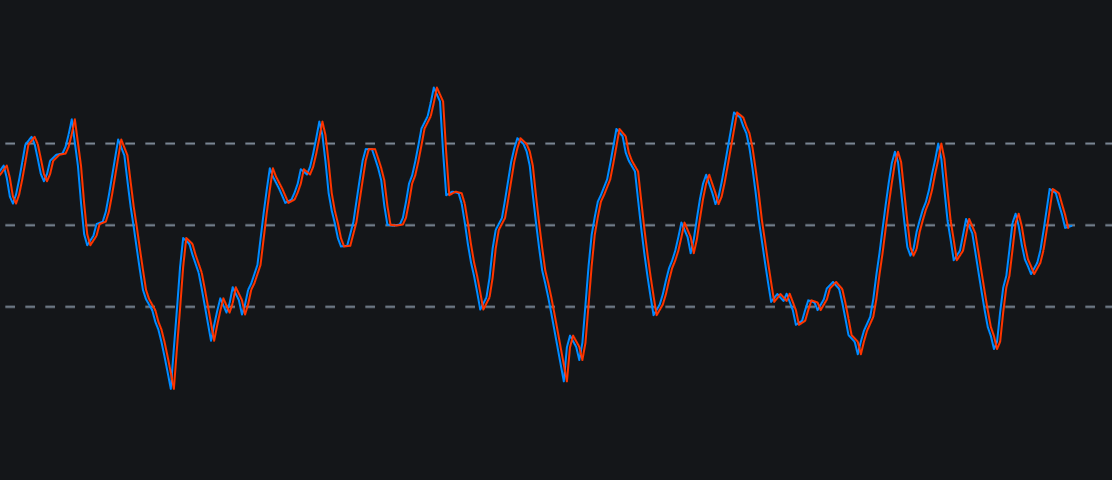
The Fisher Transform is a technical analysis indicator that converts price data into a Gaussian normal distribution (a bell curve). Designed to eliminate market noise, it helps traders pinpoint extreme price movements and spot potential trend reversals…
/indicator/fisher-transform-12
SSL Channelimage
SSL Channel
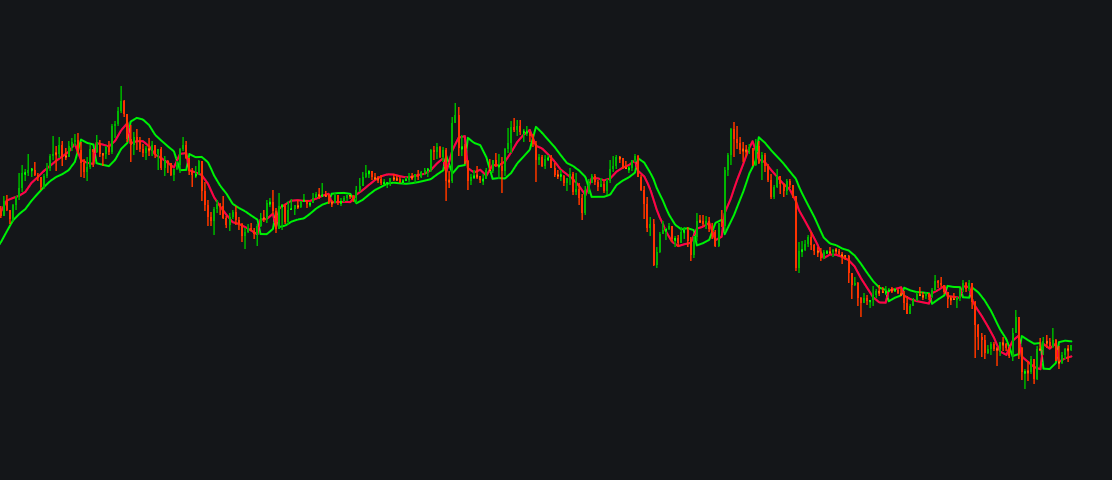
The SSL (Semaphore Signal Level or Slope) Channel is a popular momentum indicator that combines moving averages calculated on the highs and lows of price action to identify market trends. It acts as a visual overlay on your chart, typically displaying a …
/indicator/ssl-channel-69
Kalman Filterimage
Kalman Filter
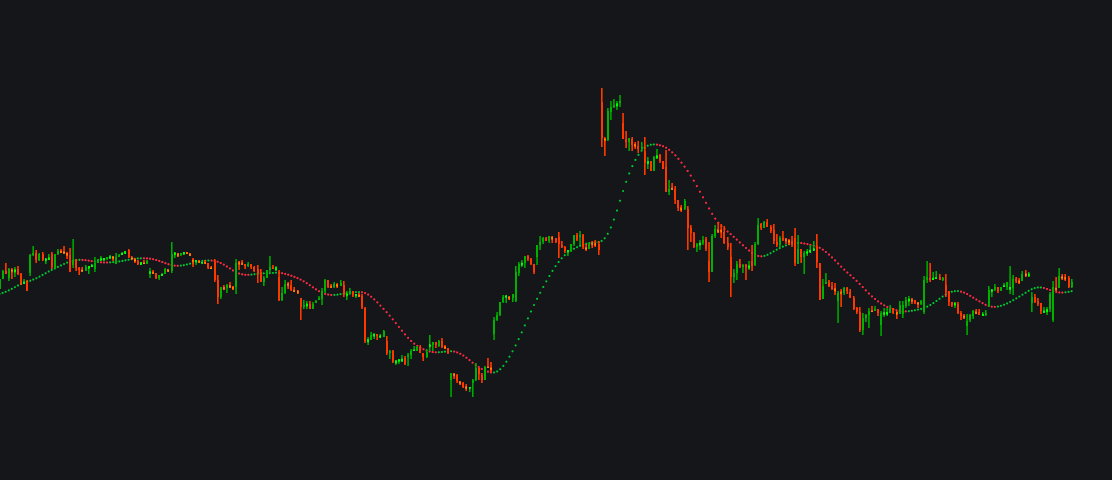
The Kalman Filter is an advanced mathematical algorithm used in trading to smooth out erratic price data and identify underlying trends with minimal lag. Originally designed by NASA for spacecraft navigation, it dynamically adapts to market volatility,…
/indicator/kalman-filter-7
My OSCARimage
My OSCAR
OSCAR — Dual-Speed Momentum Oscillator OSCAR normalizes price within a rolling high/low range and applies a unique two-bar weighted smoothing formula, producing a cleaner and more decisive oscillator than a standard Stochastic. Two lines — Oscar Roug…
/indicator/my-oscar-75
Hull Suite by InSilico — Indie Editionimage
Hull Suite by InSilico — Indie Edition
Hull Suite by InSilico — Indie Edition Hull Suite by InSilico — Indie Edition is a precise implementation of the well-known multi-variation Hull Moving Average pack, adapted for the Indie engine on TakeProfit. It preserves the mathematical structure of …
/indicator/hull-suite-by-insilico-indie-edition-97
Breakout Finder (BF)image
Breakout Finder (BF)
Breakout Finder (BF) – Advanced Price Action Breakout Indicator Overview.  Breakout Finder (BF) is a strictly mathematical price action indicator designed to identify valid breakouts and breakdowns from key support and resistance zones. By tracking histo…
/indicator/breakout-finder-bf-1
Vegas Trend Cloud Proimage
Vegas Trend Cloud Pro
Vegas Trend Cloud Pro Vegas Trend Cloud Pro is a visual trend-following indicator designed for crypto traders who want a cleaner way to read market direction, momentum, and pullback zones. It combines a short-term EMA20/50 momentum channel with the cl…
/indicator/vegas-trend-cloud-pro-3
ALPHA BLADE: TREND PROimage
ALPHA BLADE: TREND PRO
⚔️ Alpha-Blade: Trend Pro Stop Trading the Noise. Start Trading the Structure. Tired of MACD "fake-outs" in a bearish market? Frustrated with indicators that disappear when you switch from Monthly to Daily timeframes? Alpha-Blade: Trend Pro is a high-pr…
/indicator/alpha-blade-trend-pro-35
OmniTrade Institutional Matrix PROimage
OmniTrade Institutional Matrix PRO
OmniTrade Institutional Matrix PRO  — a complete Smart Money Concepts trading cockpit that fuses BOS/CHoCH structure, Order Blocks, Fair Value Gaps, liquidity sweeps, CMF volume flow and RSI into a single 0-to-5 confluence score. Entries only fire when e…
/indicator/omnitrade-institutional-matrix-pro-90
Breakout + Knife Detector + Golden Ratioimage
Breakout + Knife Detector + Golden Ratio
The Alpha-Growth Pro is a high-conviction momentum system designed for traders who demand clarity over noise. Whether you are scaling BTC , or tracking US Growth Tech,  this script provides the structural "Floor and Ceiling" you need to trade with co…
/indicator/breakout-knife-detector-golden-ratio-50
Trading Windowsimage
Trading Windows
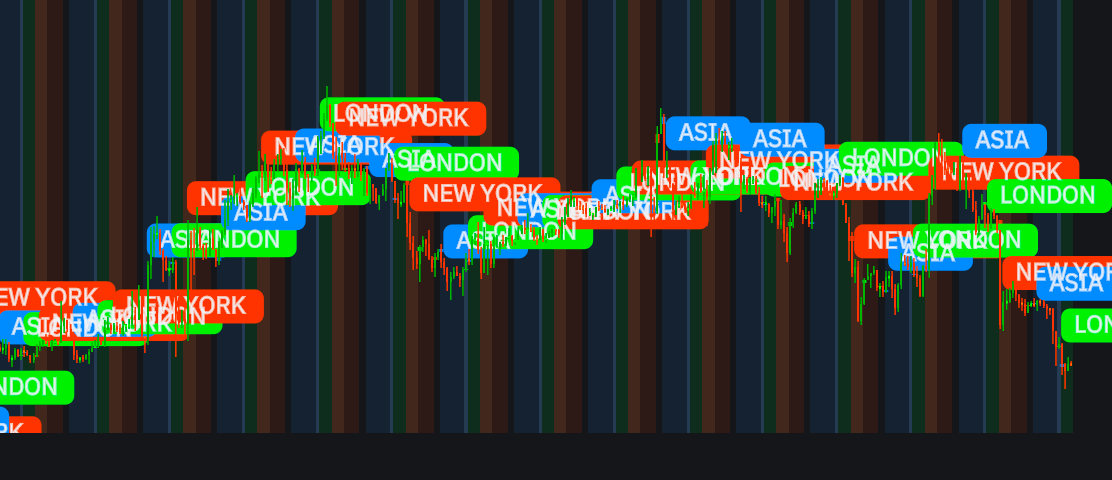
Trading Windows is a time zone-aware intraday session overlay that highlights Asia, London, and US market windows with configurable zone colours, optional boundary bars, and midpoint session labels. It includes DST auto time zone modes, weekday filtering…
/indicator/trading-windows-33
Coral Trend (6-Stage EMA)image
Coral Trend (6-Stage EMA)
Coral Trend indicator Coral Trend is a multi-stage smoothed trend filter designed to reduce market noise while preserving directional structure. The algorithm applies a six-level EMA cascade combined with a polynomial weighting model to produce a highly…
/indicator/coral-trend-6-stage-ema-36
RSI Candles (RSI Chart Bar)image
RSI Candles (RSI Chart Bar)
RSI Chart Bars RSI Candles (RSI Chart Bars) is a price-action visualization indicator that colors chart bars based on Relative Strength Index (RSI) conditions. It helps traders instantly identify overbought and oversold momentum directly on the main cha…
/indicator/rsi-candles-rsi-chart-bar-55