Detrended Synthetic Priceimage
Detrended Synthetic Price
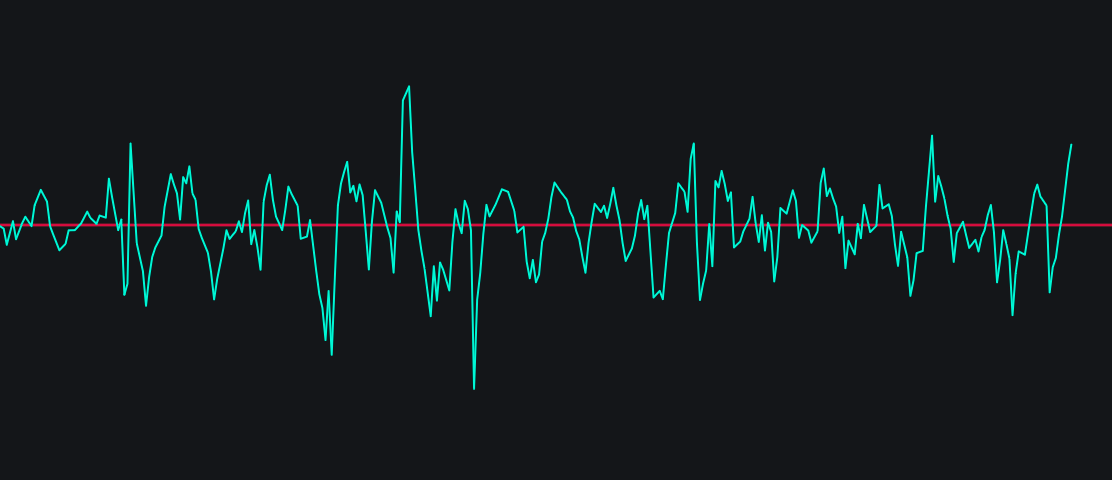
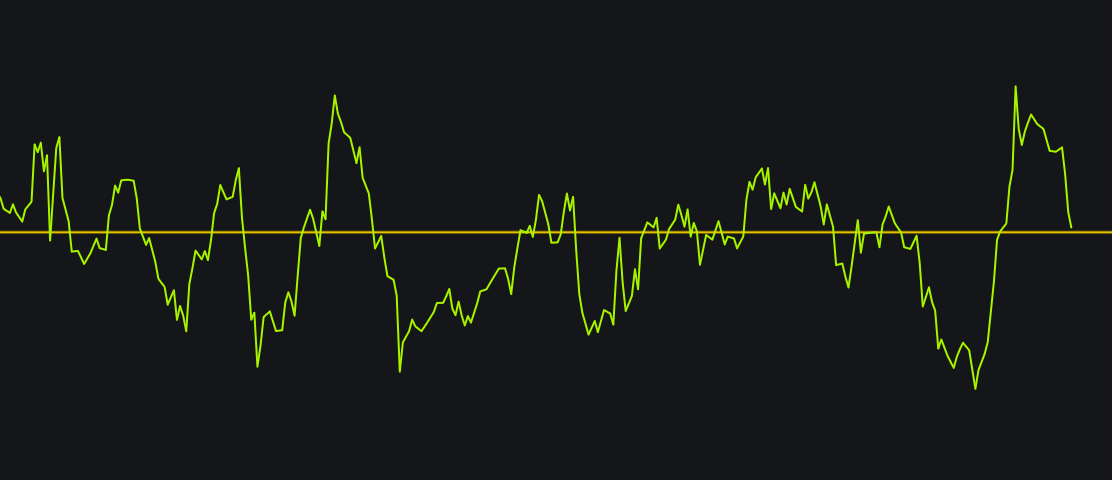
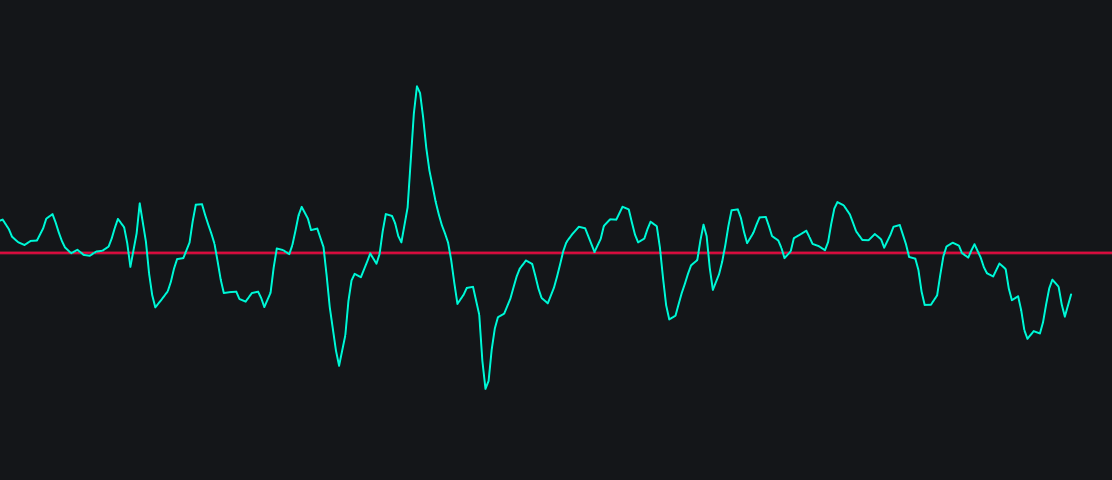
The Detrended Synthetic Price indicator is a technical analysis tool developed by John Ehlers. It isolates cyclical market movements by removing the underlying price trend, making it easier to identify exact peaks and troughs in the market cycle.
/indicator/detrended-synthetic-price-71
Price Momentum Oscillatorimage
Price Momentum Oscillator
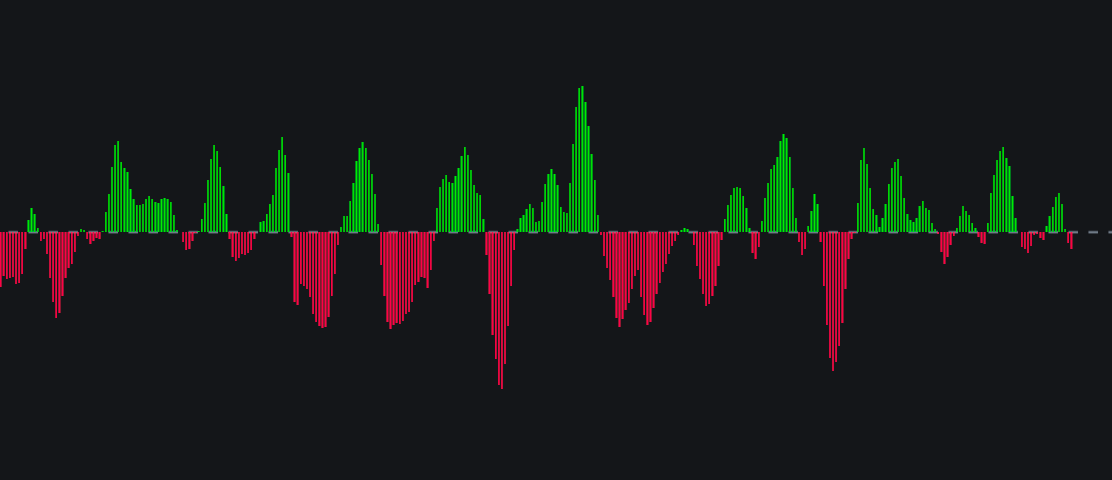
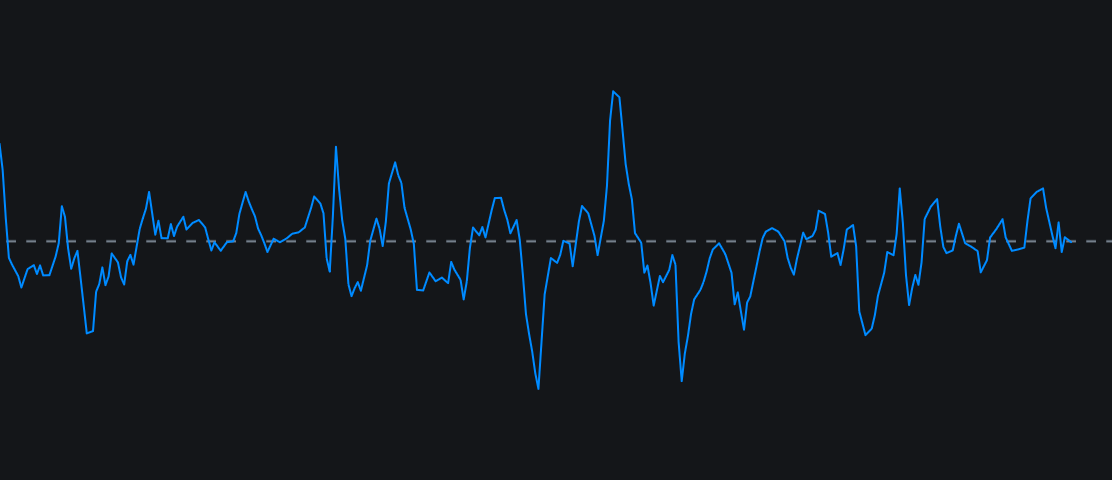
The Price Momentum Oscillator (PMO) is a technical analysis tool developed by Carl Swenlin and DecisionPoint that measures the rate and direction of price changes. It smooths the 1-bar percentage Rate of Change (ROC) twice using custom exponential moving…
/indicator/price-momentum-oscillator-98
Perfect Trend Lineimage
Perfect Trend Line
The "Perfect Trendline Indicator" is a popular automated price-action tool used in MetaTrader 4 (MT4) and MetaTrader 5 (MT5) that eliminates subjective drawing. It simplifies trend-following and breakout trading by mapping market structure, plotting tren…
/indicator/perfect-trend-line-73
Trigger Linesimage
Trigger Lines
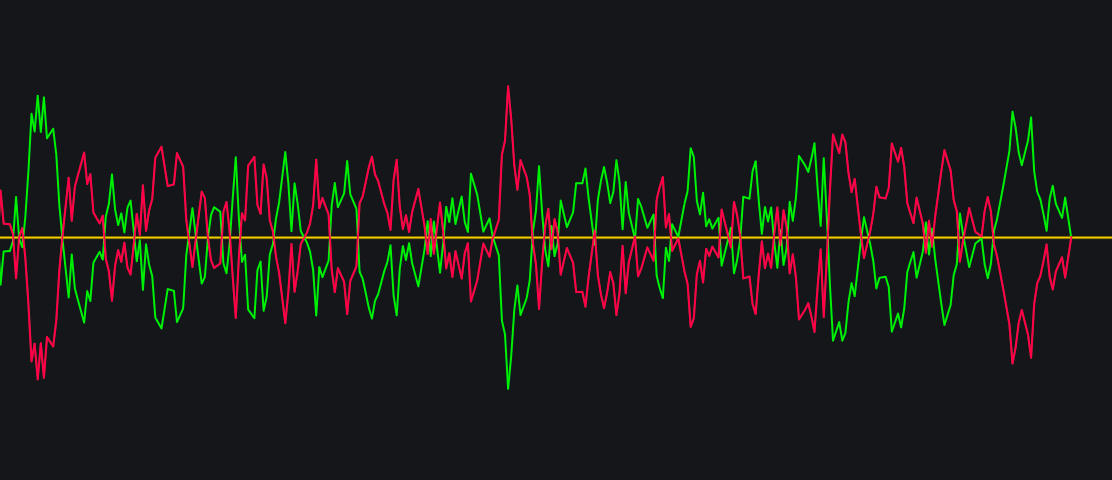
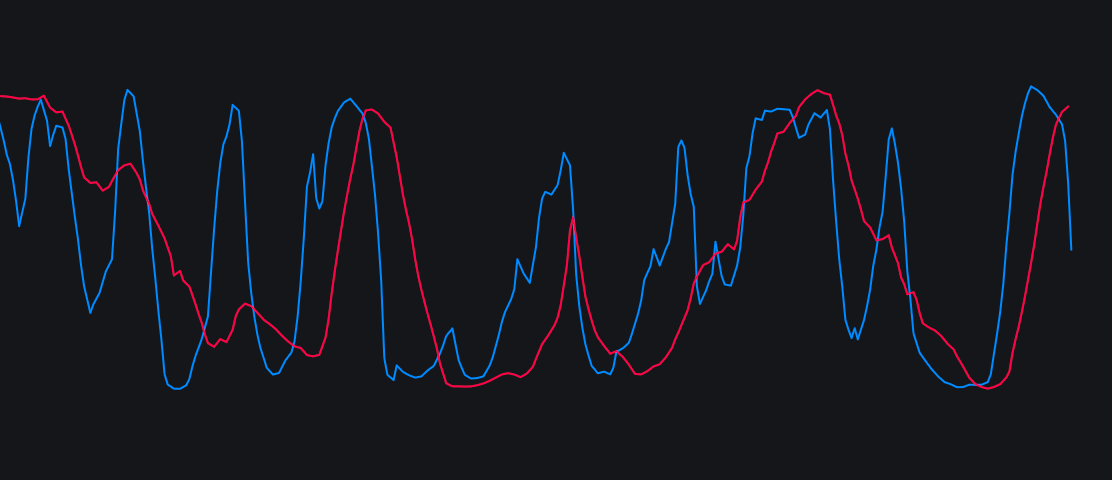
The Trigger Lines Indicator  is a popular technical analysis tool used by traders to identify short-term trends, reversals, and precise entry/exit points in financial markets. It is commonly overlaid directly on price charts and provides clear, actionab…
/indicator/trigger-lines-98
3rd Generation Moving Averageimage
3rd Generation Moving Average
Manfred Dürschner's analytically lag-cancelling MA. Combines a long EMA with a shorter EMA-of-EMA. It's an advanced technical indicator designed to reduce the lag inherent in standard moving averages. Unlike conventional MAs, it dynamically reacts faster…
/indicator/3rd-generation-moving-average-8
Fisher Transformimage
Fisher Transform
The Fisher Transform  is a technical analysis indicator that converts choppy price data into a normal Gaussian distribution (a bell-shaped curve). By normalizing data and highlighting extremes, it allows traders to sharply identify trend reversals and s…
/indicator/fisher-transform-4
Forecast Oscillatorimage
Forecast Oscillator
The Forecast Oscillator  (sometimes called the Chande Forecast Oscillator) is a momentum indicator that measures the percentage difference between an asset's current closing price and its forecasted price (usually calculated using a linear regression or…
/indicator/forecast-oscillator-84
Average Sentiment Oscillatorimage
Average Sentiment Oscillator
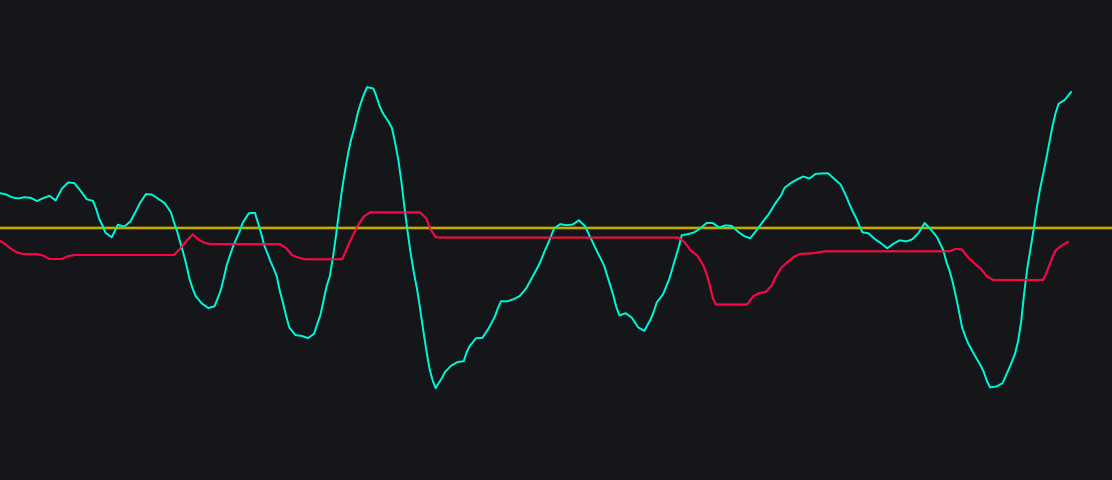
The Average Sentiment Oscillator (ASO) is a momentum-based technical indicator that measures market mood by analyzing how prices close within individual candlesticks and rolling windows. It outputs two percentages—Bulls and Bears—that always sum to 100, …
/indicator/average-sentiment-oscillator-29
Decycler Oscillatorimage
Decycler Oscillator
The Decycler Oscillator  is a technical indicator created by cycle analyst John Ehlers that identifies market trends and reversals with almost zero lag. It uses advanced mathematical high-pass filters to remove irrelevant market noise, smoothing price f…
/indicator/decycler-oscillator-88
Derivative Oscillatorimage
Derivative Oscillator
Double-smoothed RSI minus its SMA signal — smooth momentum oscillator that suppresses RSI whipsaw while preserving turning points. Best-known use: price-momentum divergence.
/indicator/derivative-oscillator-86
Waddah Attar Explosion Histogramimage
Waddah Attar Explosion Histogram
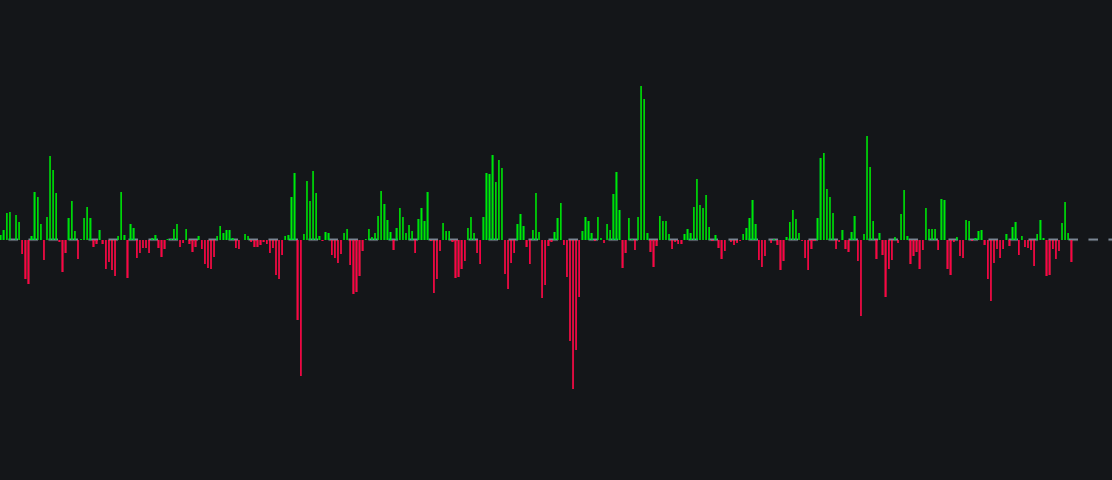
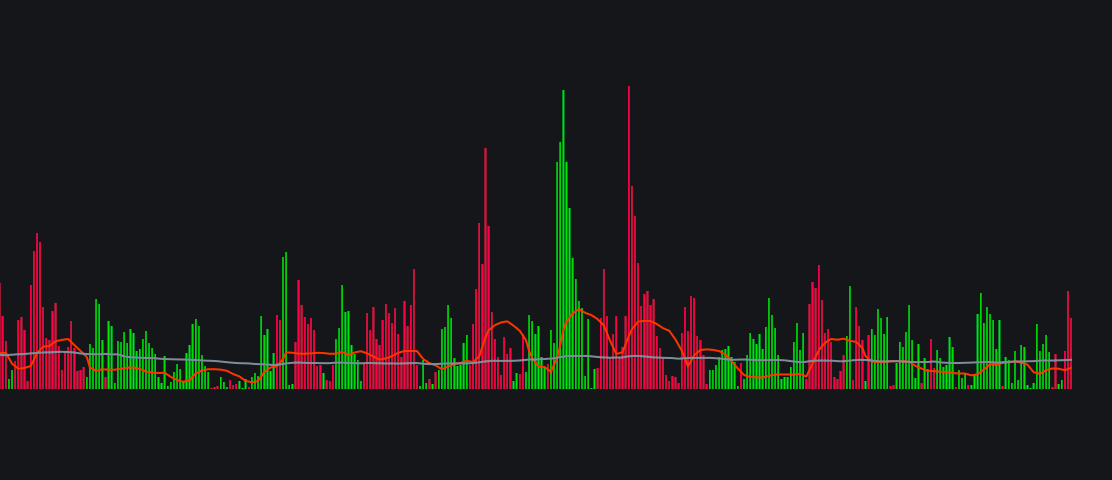
There are three components to this indicator;  green histograms ,  red histograms , and a  red “explosion” line . The red histogram indicates the current downtrend. The green histogram indicators the current uptrend. The yellow line’s direction shows the…
/indicator/waddah-attar-explosion-histogram-46
Polychromatic Momentumimage
Polychromatic Momentum
The Polychromatic Momentum Indicator  (PMI) is a technical analysis tool developed by Dr. Dennis Meyers that calculates a weighted average of momentum across multiple lookback periods. It solves the problem of traditional momentum indicators—which can f…
/indicator/polychromatic-momentum-98
Correlation Trendimage
Correlation Trend
The Correlation Trend Indicator (CTI)  —famously developed by financial analyst Dr. John Ehlers—is a technical oscillator that measures the direction and strength of a price trend by comparing it to an ideal, straight diagonal line. It oscillates betwee…
/indicator/correlation-trend-8
Smoothed momentum Improvedimage
Smoothed momentum Improved
A smoothed momentum indicator is a technical analysis tool that measures the rate of price changes while applying moving averages or filters to reduce market noise. By eliminating false signals caused by erratic price spikes, it provides a clearer, less …
/indicator/smoothed-momentum-improved-26
Cyber Cycle 0 crossimage
Cyber Cycle 0 cross
The Cyber Cycle is a technical indicator developed by John Ehlers that isolates the cyclical component of market price action. By smoothing out static and noise, it oscillates across a central zero line to help traders identify potential market reversals…
/indicator/cyber-cycle-0-cross-70