Andean Oscillatorimage
Andean Oscillator
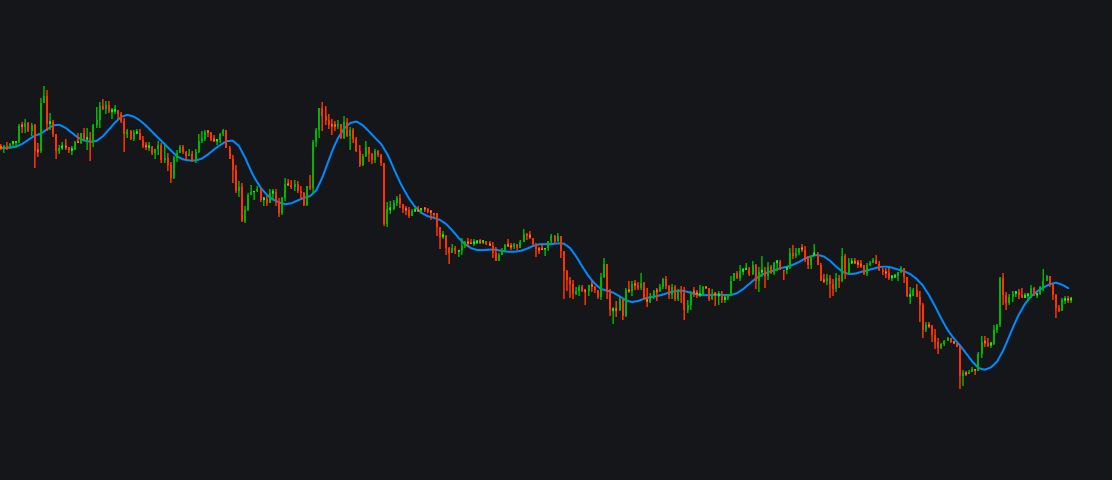
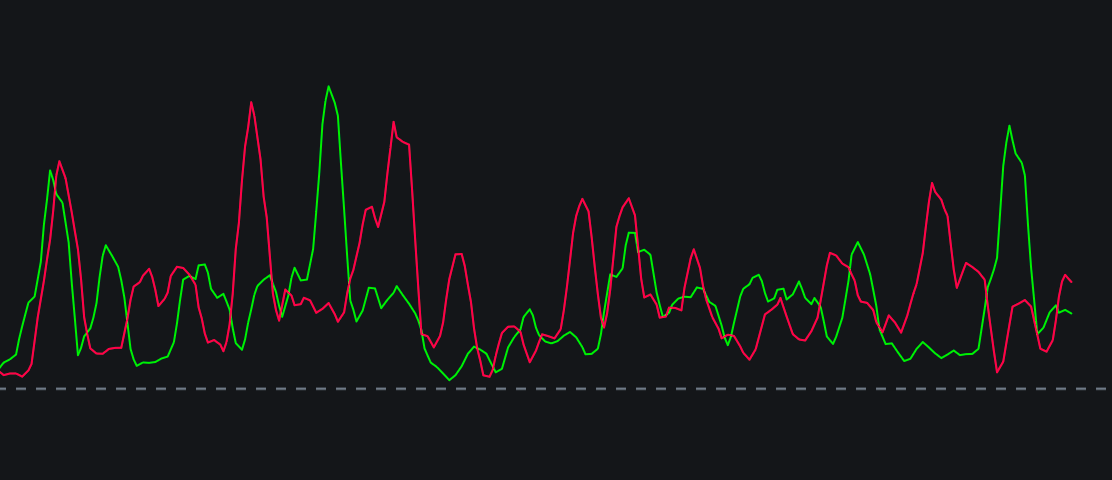
The Andean Oscillator (originally created by Alex Grover) is a technical indicator that tracks upward and downward price momentum. It separates bullish and bearish pressure rather than combining them into a single line, and is highly favored in trading e…
/indicator/andean-oscillator-79
Trend Intensity Indeximage
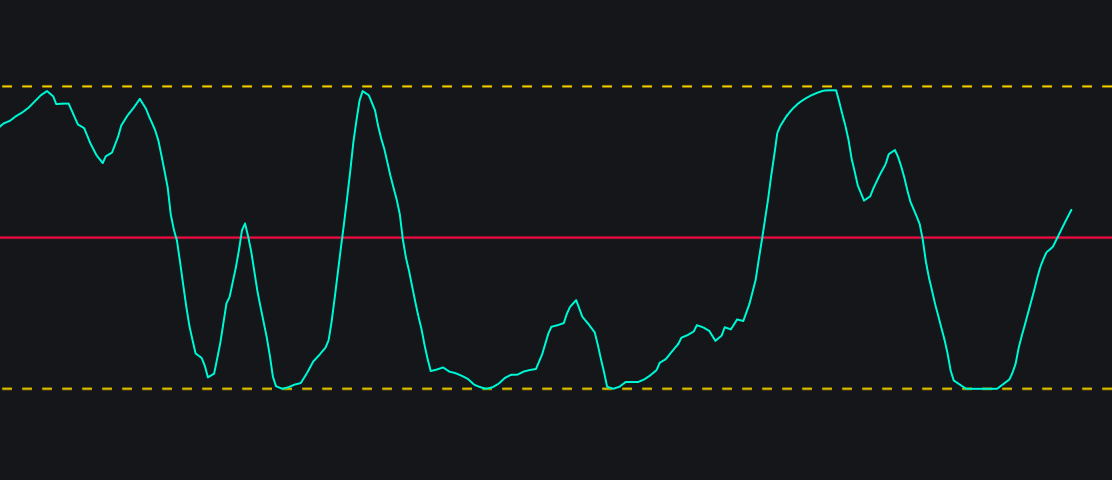
Trend Intensity Index
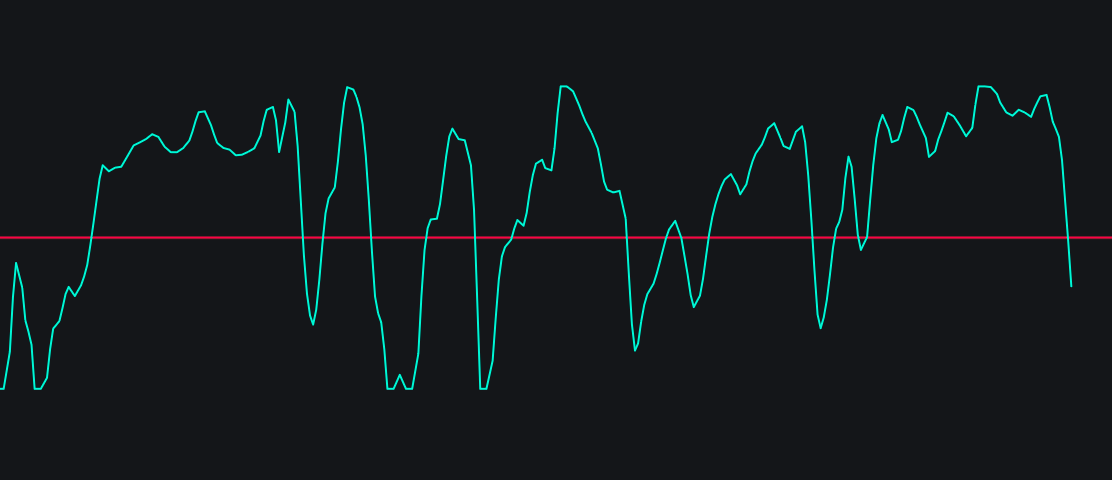
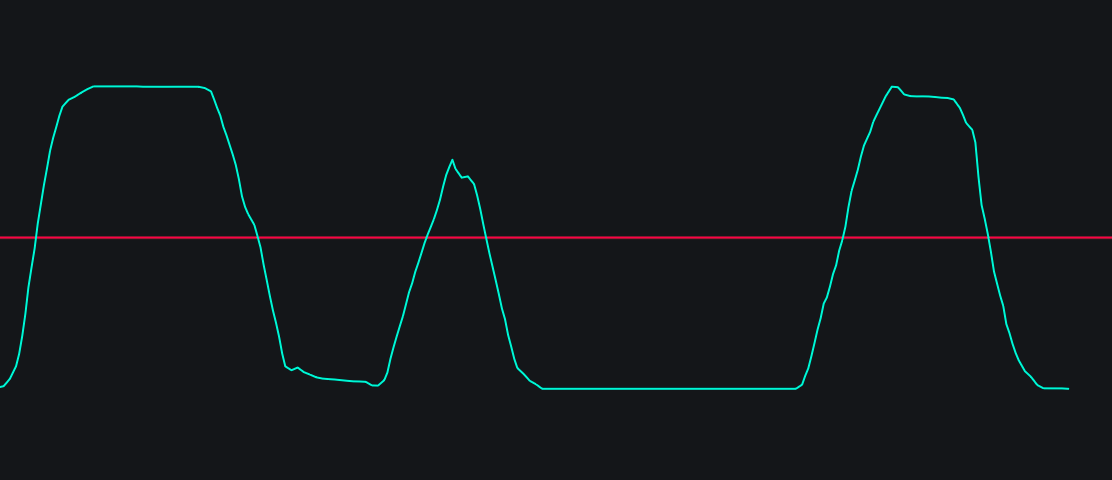
The Trend Intensity Index (TII) measures the strength and direction of a prevailing market trend. Ranging from 0 to 100, a value above 50 indicates a bullish trend, while a value below 50 indicates a bearish trend. Traders use it to confirm trends and sp…
/indicator/trend-intensity-index-9
AB Trend Voterimage
AB Trend Voter
Customized improvement of the Kase Peak Oscillator. Great at: - spotting overbought and oversold levels. - 0 cross trend confirmation.
/indicator/ab-trend-voter-93
T3 Moving Averageimage
T3 Moving Average
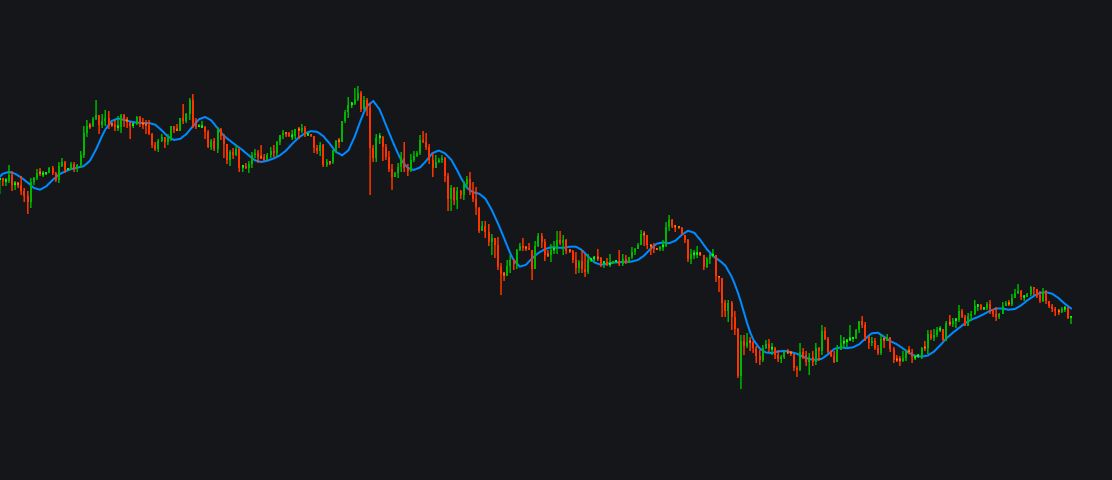
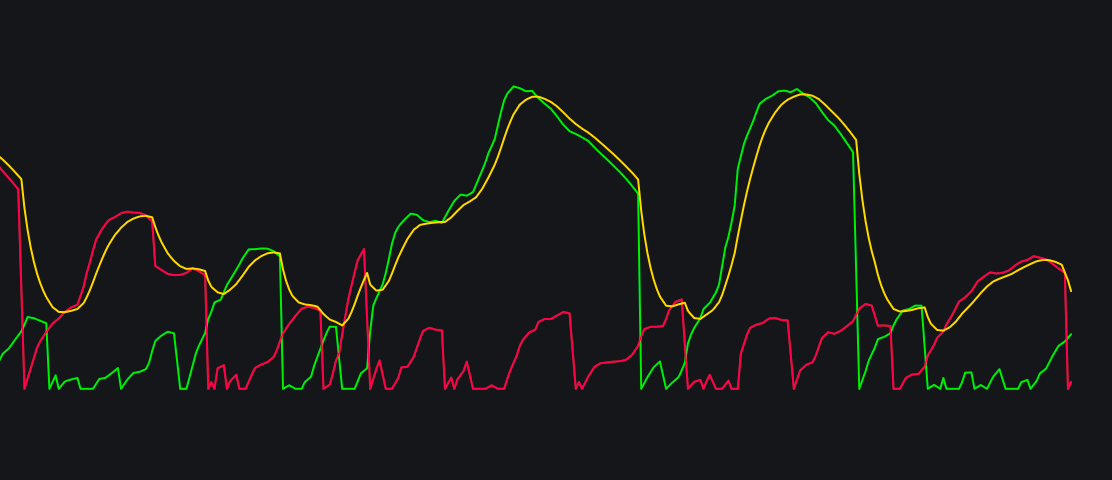
The T3 Moving Average  (developed by Tim Tillson) is an advanced smoothing indicator that minimizes lag while reducing false signals. It applies multiple Exponential Moving Average (EMA) calculations recursively (triple-smoothing) along with a "volume f…
/indicator/t3-moving-average-90
Stiffness Indicatorimage
Stiffness Indicator
The Stiffness Indicator  is a technical analysis tool developed by Markos Katsanos that assesses the strength and quality of an uptrend. It works by counting how often an asset's price closes above a 100-bar moving average, filtering out minor pullbacks…
/indicator/stiffness-indicator-42
FRAMAimage
FRAMA
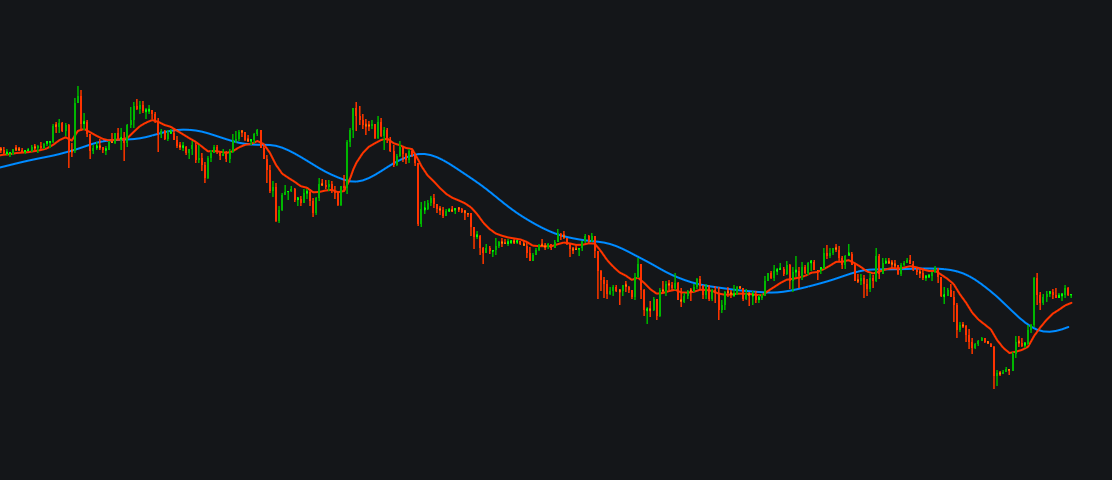
The FRAMA  (Fractal Adaptive Moving Average) is a dynamic technical indicator developed by John Ehlers that automatically adjusts its sensitivity based on market conditions. It acts fast during strong trends to capture momentum and slows down during cho…
/indicator/frama-76
Smoothstep Oscillatorimage
Smoothstep Oscillator
The SmoothStep Oscillator  is a momentum and trend-tracking technical indicator that applies advanced smoothing techniques (such as Hermite interpolation) to price or volume data to filter out market noise and identify trend reversals. It produces a cle…
/indicator/smoothstep-oscillator-39
Elegant Oscillatorimage
Elegant Oscillator
The Elegant Oscillator  is a momentum-based technical indicator developed by John Ehlers in 2022. It uses inverse Fisher transforms and SuperSmoother filters to eliminate market noise, providing clear, smooth signals that fluctuate between -1 and +1.
/indicator/elegant-oscillator-60
Kase Peak oscillator (smooth ATR-normalized momentum)image
Kase Peak oscillator (smooth ATR-normalized momentum)
This version of the   Kase Peak Oscillator (KPO)  is a statistically driven technical indicator created by Cynthia Kase that measures momentum and highlights overbought or oversold conditions. Unlike traditional oscillators, it analyzes multiple trend le…
/indicator/kase-peak-oscillator-smooth-atr-normalized-momentum-74
Ehlers Roofing Filterimage
Ehlers Roofing Filter
The Ehlers Roofing Filter  is an advanced technical analysis indicator developed by John F. Ehlers. It combines a high-pass filter and a low-pass filter to isolate market cycles. By removing noise and spectral dilation, it produces a clear, lag-reduced …
/indicator/ehlers-roofing-filter-48
Ehlers Early Onset Trendimage
Ehlers Early Onset Trend
The Ehlers Early Onset Trend  (also known as the Onset Trend Detector) is a technical analysis tool created by digital signal processing expert John F. Ehlers. Designed to eliminate the lag common in moving averages, it helps traders catch the beginnin…
/indicator/ehlers-early-onset-trend-17
3-Pole Butterworth Filterimage
3-Pole Butterworth Filter
The 3-pole Butterworth filter is an advanced moving average and noise-reduction indicator created by John Ehlers. Designed as an alternative to SMAs and EMAs, it removes high-frequency market noise and false signals with minimal lag. It is primarily used…
/indicator/3-pole-butterworth-filter-36
Recursive Moving Averageimage
Recursive Moving Average
The Recursive Moving Average (RMA)  is a highly smoothed technical indicator that references its own previous values in its calculation. It acts as a primary trend filter or confirmation tool, designed to cut out market "noise" and minimize whipsaw sign…
/indicator/recursive-moving-average-90
Absolute Strenght Indeximage
Absolute Strenght Index
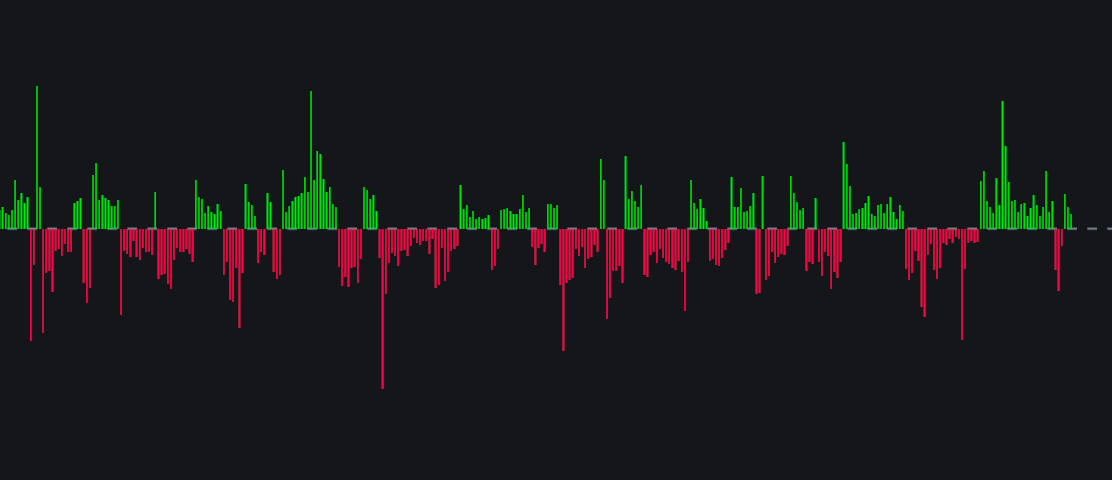
derived from the   Absolute Strength Histogram (ASH),  a momentum indicator that measures the relative power of buyers (bulls) versus sellers (bears) and displays the difference as a color-coded chart. It helps traders quickly identify trend direction, m…
/indicator/absolute-strenght-index-92
Precision Trend Histogram (with Volume)image
Precision Trend Histogram (with Volume)
The Precision Trend Histogram is a visual, color-coded technical indicator designed to simplify trend identification and confirm trade signals. It displays a histogram beneath the main price chart, using color shifts to signal changing market momentum an…
/indicator/precision-trend-histogram-with-volume-8