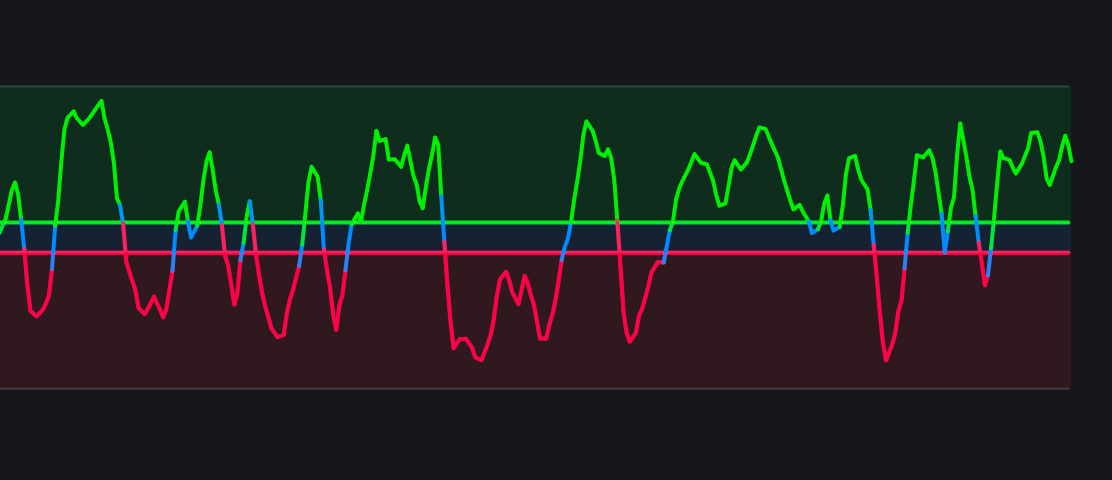
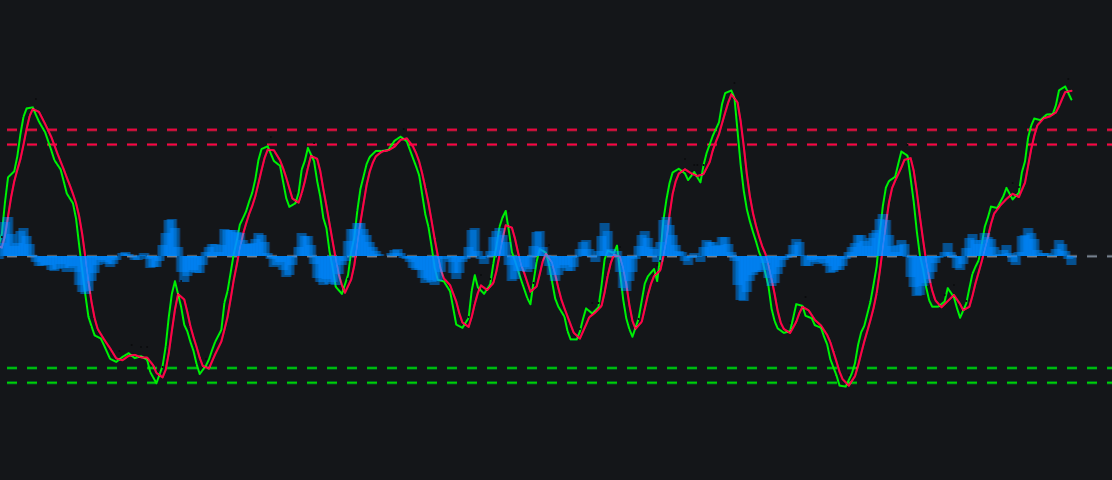
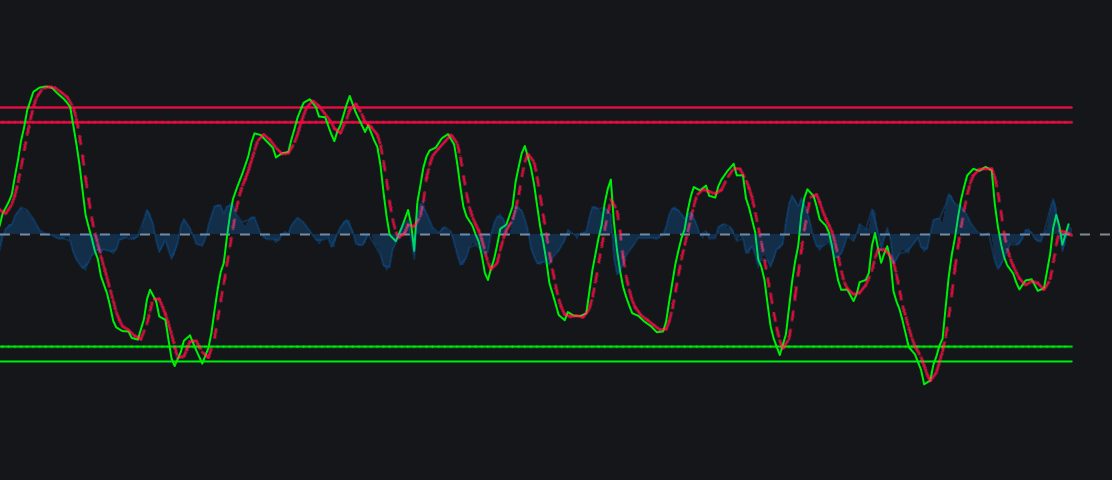
Laguerre RSIimage
Laguerre RSI
The Laguerre RSI is a modified momentum oscillator developped by John Ehlers . It improves on the standard Relative Strength Index (RSI) by using a mathematical filter, which removes market noise and significantly reduces lag. This provides a much smooth…
/indicator/laguerre-rsi-67
Williams VIX fiximage
Williams VIX fix
The Williams VIX Fix  is a popular technical indicator created by legendary trader Larry Williams to simulate the Chicago Board Options Exchange Volatility Index (VIX) on any asset. It helps traders identify potential market bottoms and capitulation ev…
/indicator/williams-vix-fix-65
Center of Gravityimage
Center of Gravity
The Center of Gravity  indicator is a leading, lag-free technical analysis tool. It oscillates around a center line to help traders pinpoint market turning points. By acting as a balance zone, it helps identify overbought or oversold conditions so trad…
/indicator/center-of-gravity-13
Disparity Indeximage
Disparity Index
The Disparity Index is a technical momentum indicator that measures the percentage difference between an asset’s current closing price and a selected moving average. It helps traders identify potential overbought or oversold extremes and spot early trend…
/indicator/disparity-index-74
Random Walk Indeximage
Random Walk Index
The Random Walk Index (RWI)  is a technical indicator developed by Michael Poulos that determines whether price movements are trending or purely random. By comparing actual price ranges to a random walk (i.e., zigzagging), it identifies the strength and…
/indicator/random-walk-index-27
Waddah Attar Explosionimage
Waddah Attar Explosion
The Waddah Attar Explosion (WAE) indicator is a popular technical analysis tool created by Ahmad Waddah Attar that combines MACD (momentum) and Bollinger Bands (volatility) to identify when the price transitions from consolidation into a strong direction…
/indicator/waddah-attar-explosion-59