kama cycleimage
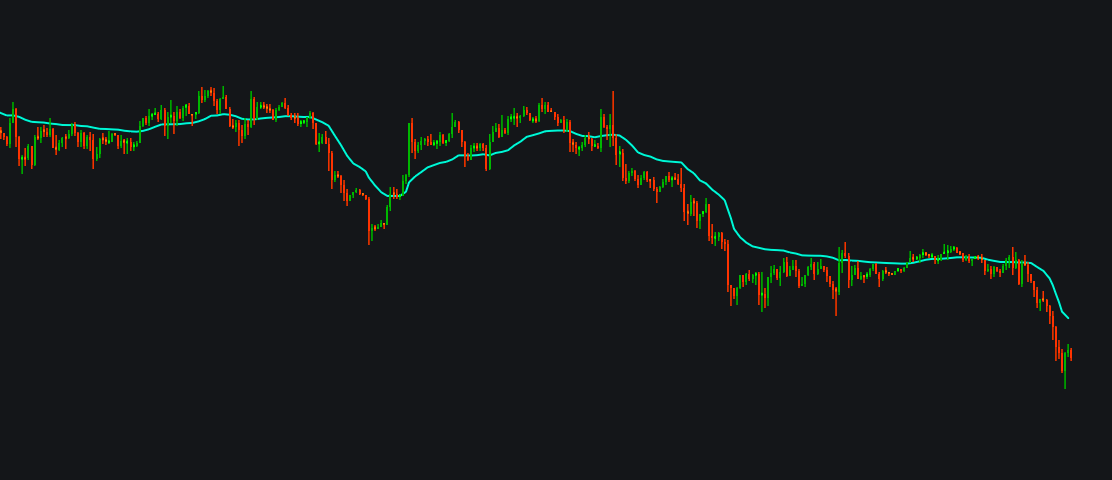
kama cycle
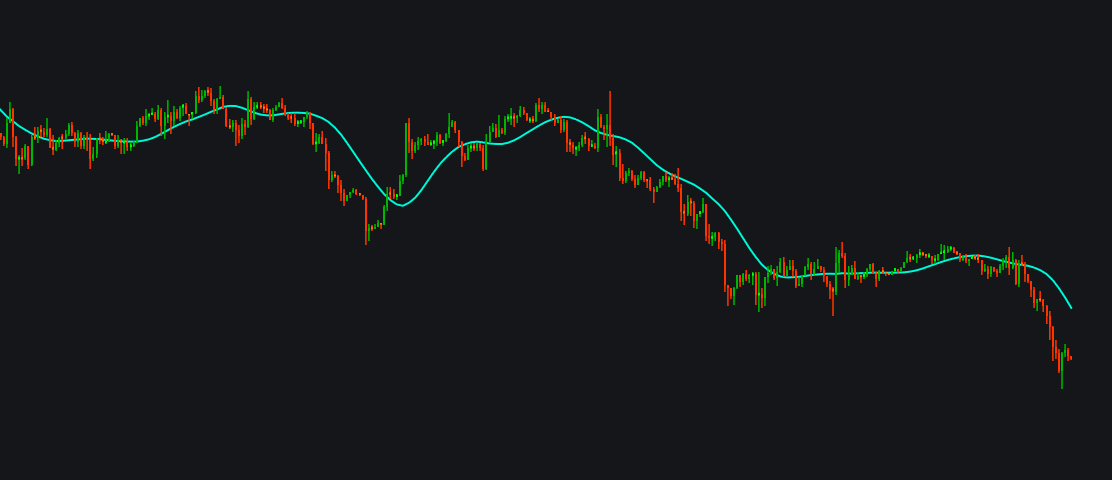
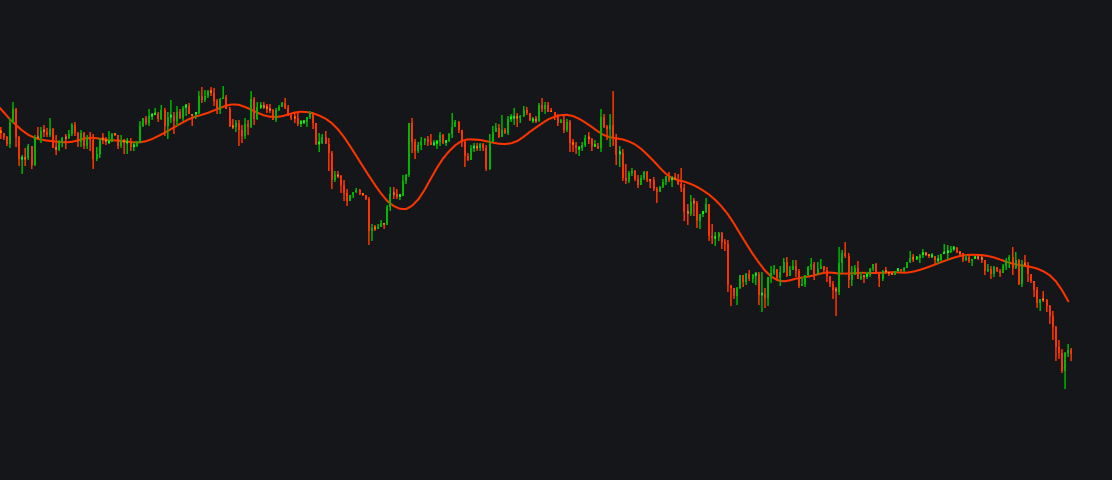
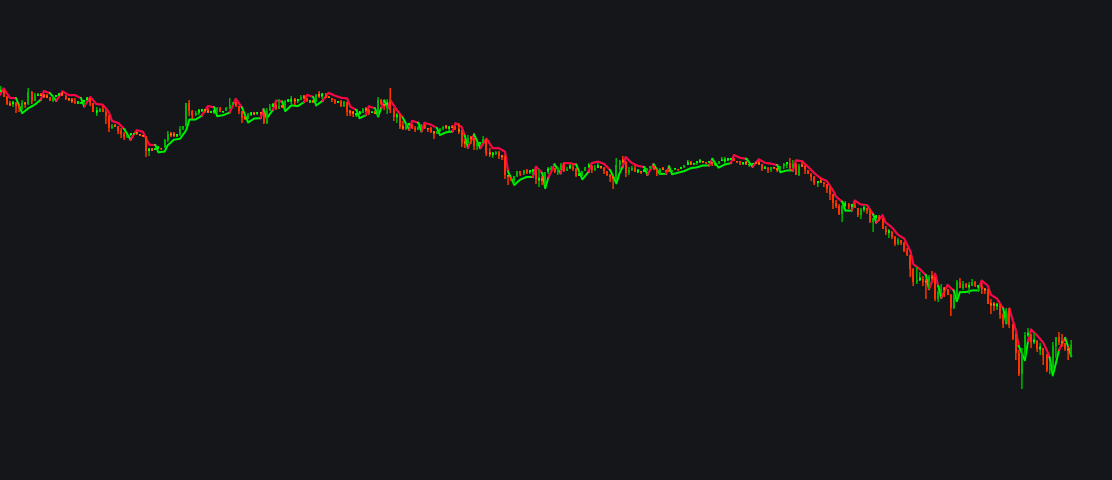
# KAMA Cycle Indicator –  Fully Customizable The KAMA Cycle Indicator is designed for **monthly timeframe analysis**, but all parameters (KAMA periods, deviation thresholds, visual settings) are fully adjustable. You can adapt it to any asset and any tim…
/indicator/kama-cycle-18
Chande Kroll Stopimage
Chande Kroll Stop
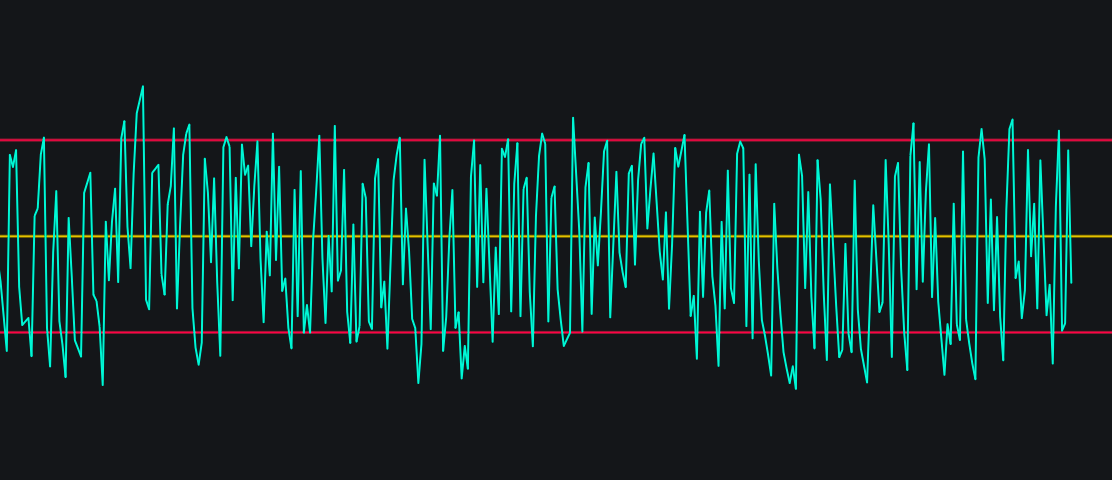
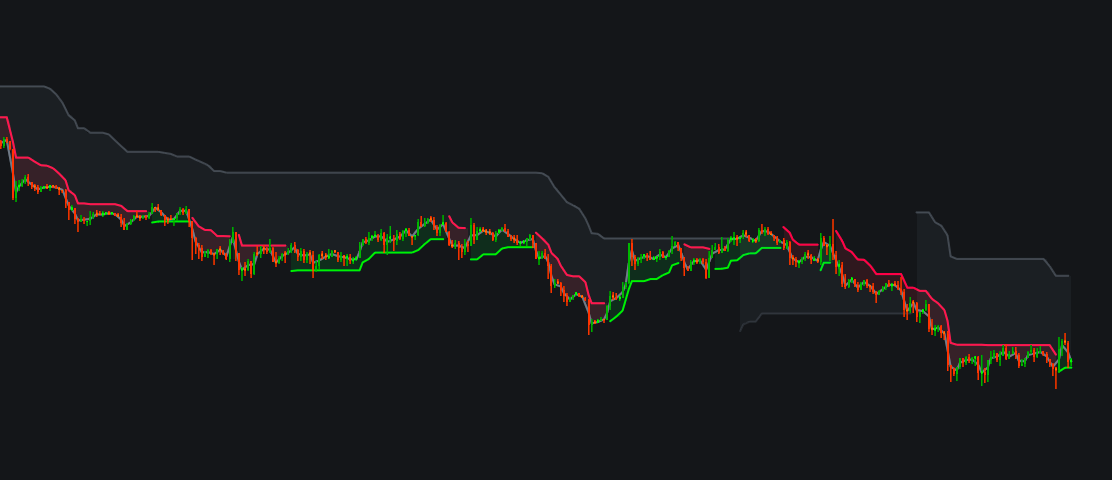
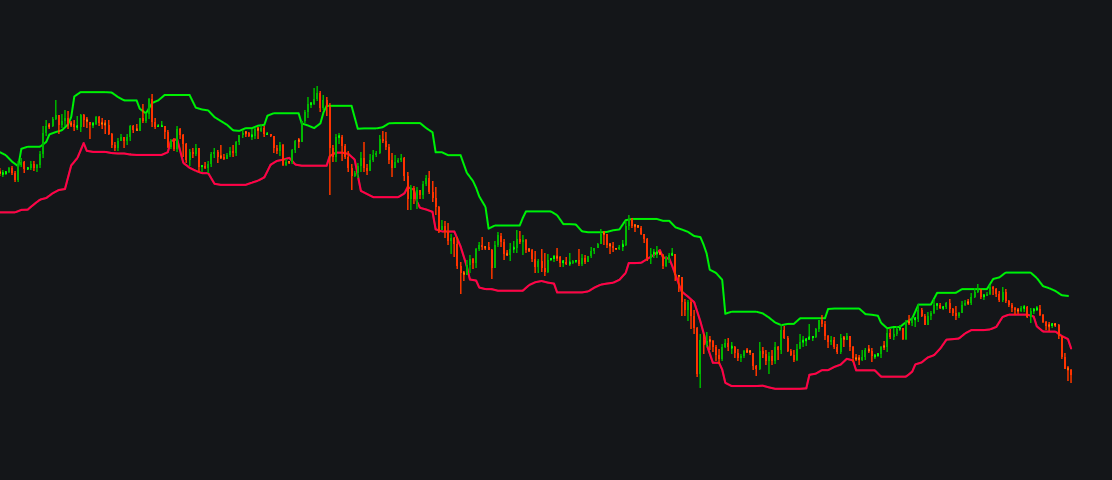
The Chande Kroll Stop  is a dynamic stop-loss indicator designed by Tushar Chande and Stanley Kroll. It uses the Average True Range (ATR)  and recent price extremes to set stop levels that automatically widen during high volatility to prevent premature…
/indicator/chande-kroll-stop-19
Connors RSIimage
Connors RSI
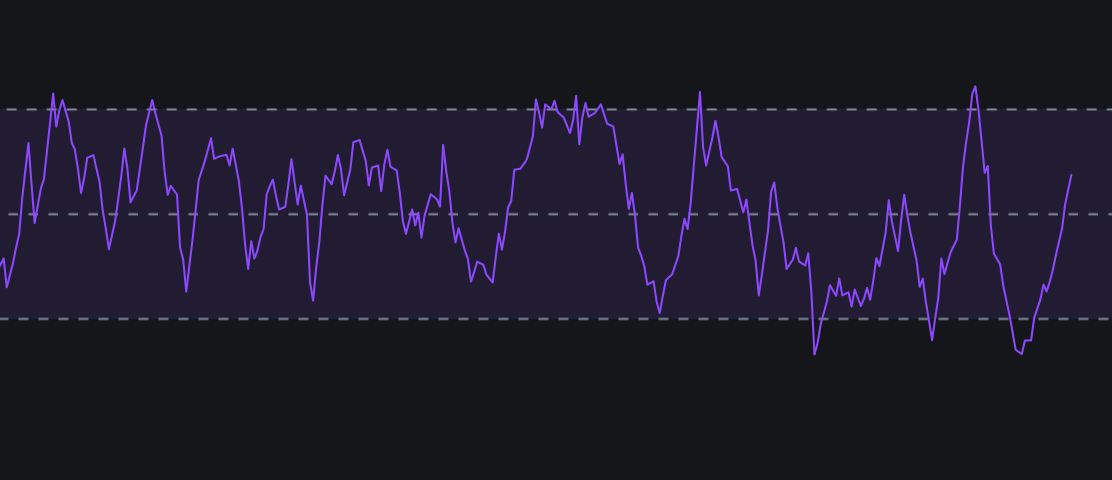
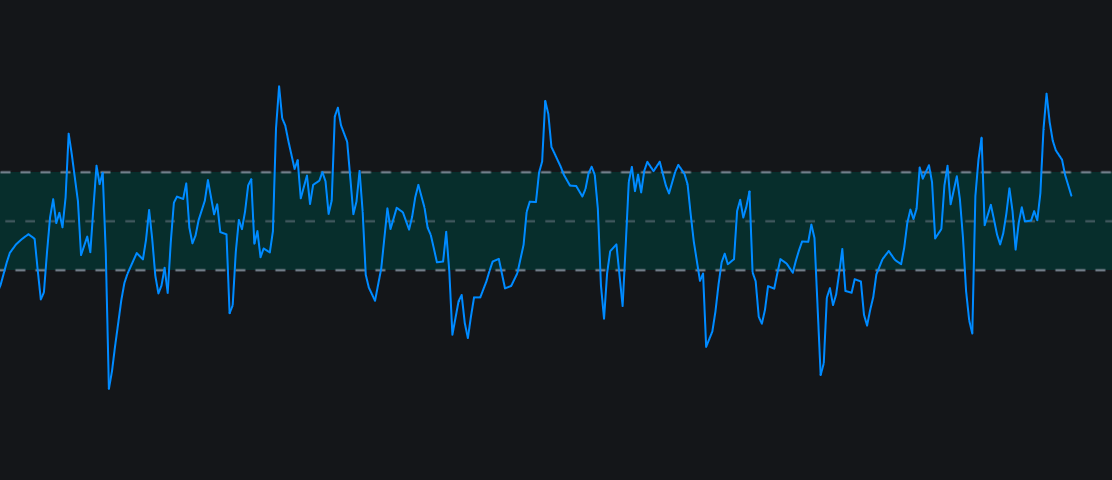
The Connors RSI is a momentum oscillator developed by Larry Connors to identify short-term overbought and oversold conditions. Unlike the traditional 14-period Relative Strength Index (RSI), CRSI is designed for shorter timeframes. It reacts much faste…
/indicator/connors-rsi-6
Laguerre Filterimage
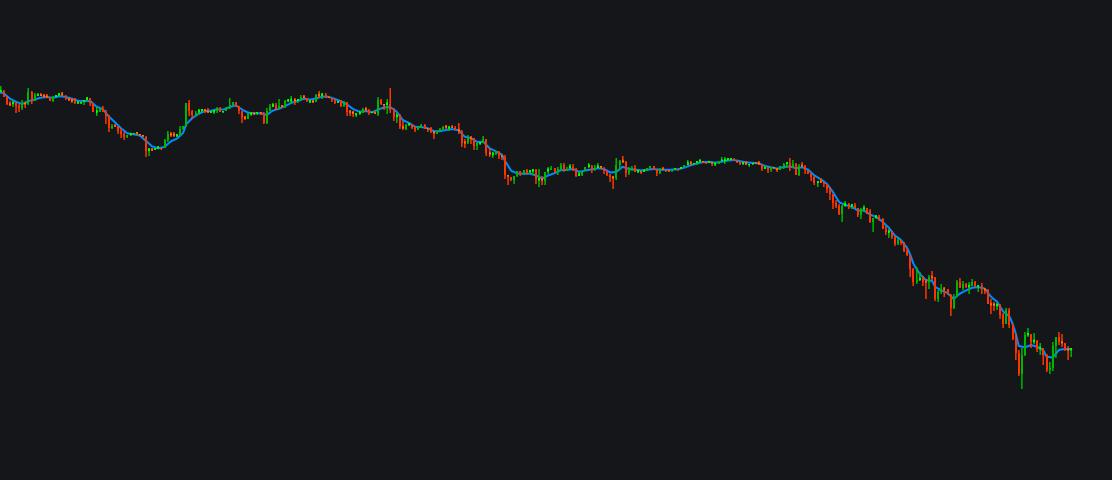
Laguerre Filter
The Laguerre Filter  is a baseline indicator developed by technical analyst John Ehlers. It uses advanced mathematics to smooth out market noise while remaining highly responsive to price changes—providing superior smoothing with significantly less lag …
/indicator/laguerre-filter-24
Schaff Trend Cycleimage
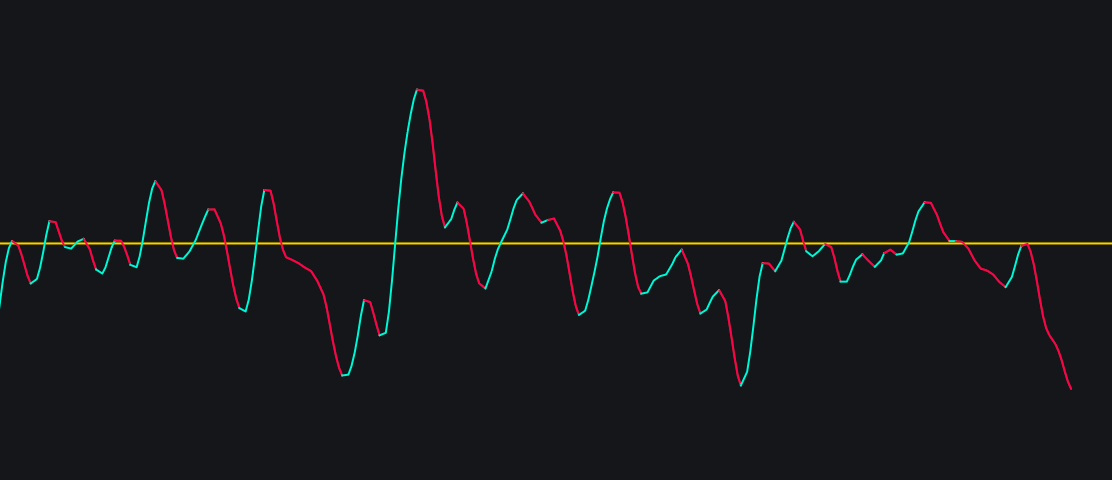
Schaff Trend Cycle
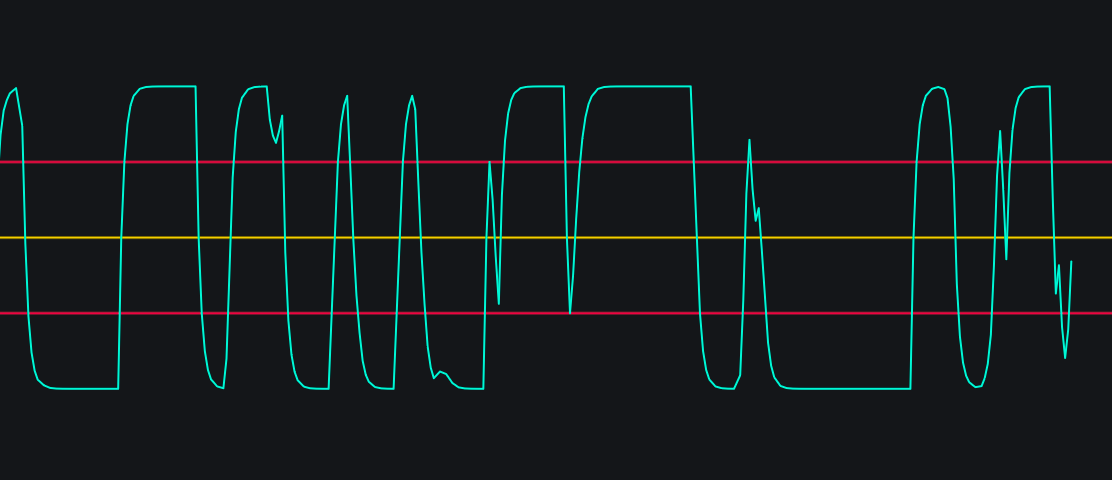
The Schaff Trend Cycle (STC)  is a technical momentum oscillator developed by Doug Schaff. It combines elements of the MACD and cycle analysis to identify trends and potential reversals earlier and more smoothly than traditional indicators
/indicator/schaff-trend-cycle-76
MFI - Money Flow Indeximage
MFI - Money Flow Index
MFI with Alerts: Indicator Overview The MFI (Money Flow Index) with Alerts is a volume-weighted momentum oscillator used to measure the inflow and outflow of money into a financial asset over a specific period. Often referred to as the "Volume-Weighted…
/indicator/mfi-money-flow-index-20
Vidyaimage
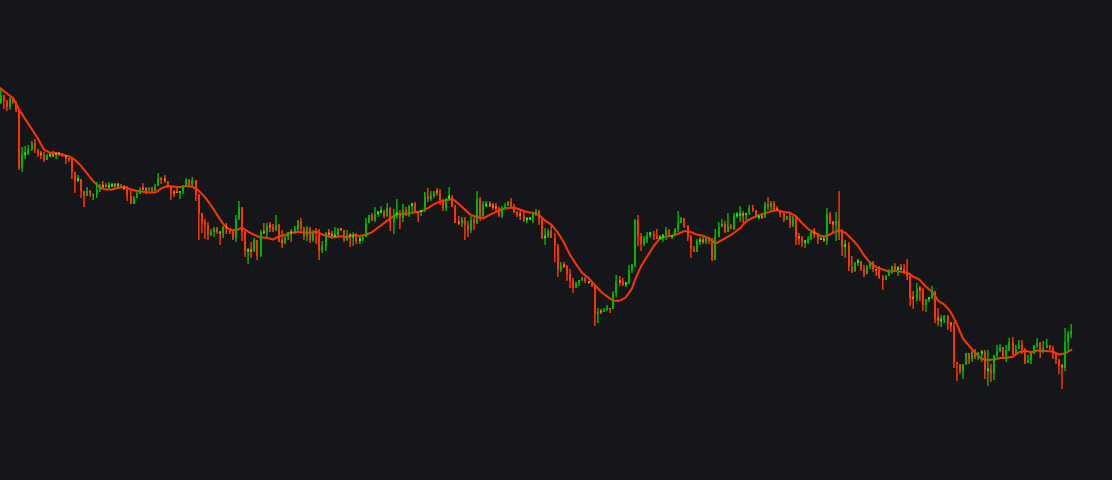
Vidya
The VIDYA  (Variable Index Dynamic Average) is an adaptive technical analysis tool created by Tushar Chande. Unlike traditional moving averages that use static smoothing, VIDYA dynamically adjusts its sensitivity based on market volatility using the Ch…
/indicator/vidya-74
Generalized DEMAimage
Generalized DEMA
The Generalized DEMA (Double Exponential Moving Average), or GDEMA, is a technical analysis indicator developed by Tim Tillson. It enhances the standard DEMA—which was created by Patrick Mulloy to reduce traditional moving average lag—by introducing an a…
/indicator/generalized-dema-69
Directional Movement using Hann (DMH)image
Directional Movement using Hann (DMH)
The Directional Movement using Hann (DMH) is a modernized, smoothed version of J. Welles Wilder's classic Directional Movement Index (DMI). Introduced by renowned quantitative analyst John Ehlers in 2021, the DMH uses a Hann windowing function to reduc…
/indicator/directional-movement-using-hann-dmh-29
Geometric Mean Moving  Averageimage
Geometric Mean Moving Average
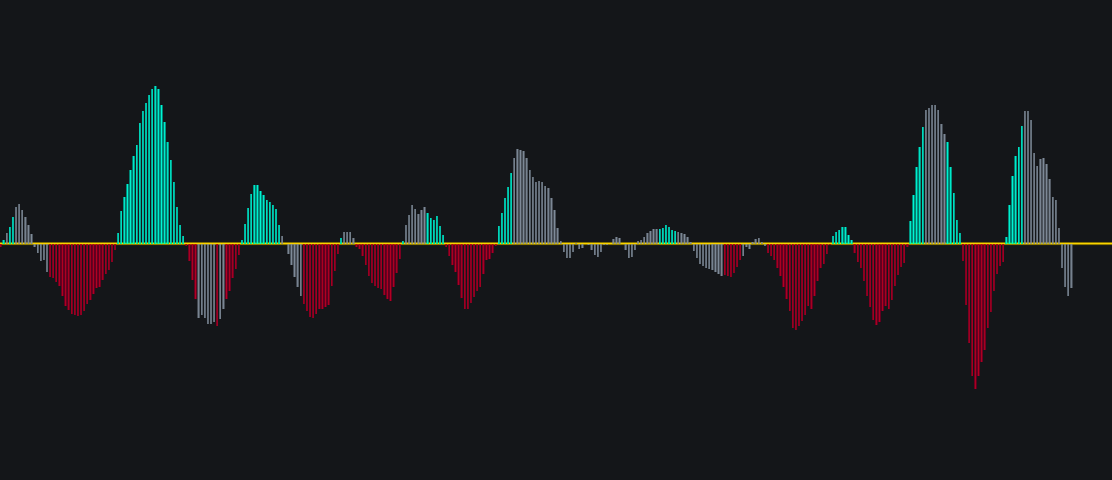
The Geometric Mean Moving Average (GMMA) is a statistical tool used in financial trading to smooth out price data and identify trends. Unlike standard moving averages that add  data points, the GMMA multiplies  them. This unique formula gives the line …
/indicator/geometric-mean-moving-average-76
Squeeze Momentumimage
Squeeze Momentum
The Squeeze Momentum Indicator  ( popularized by LazyBear on TradingView and derived from John Carter's "TTM Squeeze" ) is a volatility and trend tool. It helps traders spot quiet, consolidating markets (the "squeeze") that typically precede explosive p…
/indicator/squeeze-momentum-12
CCI - commodity channel index + Alertsimage
CCI - commodity channel index + Alerts
CCI with Alerts: Indicator Overview The CCI (Commodity Channel Index) with Alerts is a versatile, momentum-based technical indicator designed to identify cyclical trends, determine overbought or oversold market conditions, and spot potential trend reve…
/indicator/cci-commodity-channel-index-alerts-63
Sine WMAimage
Sine WMA
The Sine Weighted Moving Average (Sine WMA)  is a technical analysis tool that smooths out price data by assigning weights based on the mathematical sine function. It creates a bell-shaped distribution where the most recent prices and oldest prices have…
/indicator/sine-wma-42
Double - Supertrendimage
Double - Supertrend
The Double Supertrend Indicator The Double Supertrend is an advanced, trend-following technical analysis indicator that combines two distinct Supertrend calculations—typically one faster (short-term) and one slower (long-term)—onto a single price chart…
/indicator/double-supertrend-45
Half Trendimage
Half Trend
The Half Trend Indicator  is a popular, trend-following technical analysis tool used to identify market direction, spot potential reversals, and define dynamic support and resistance levels. It plots a color-changing line across price charts along with …
/indicator/half-trend-70