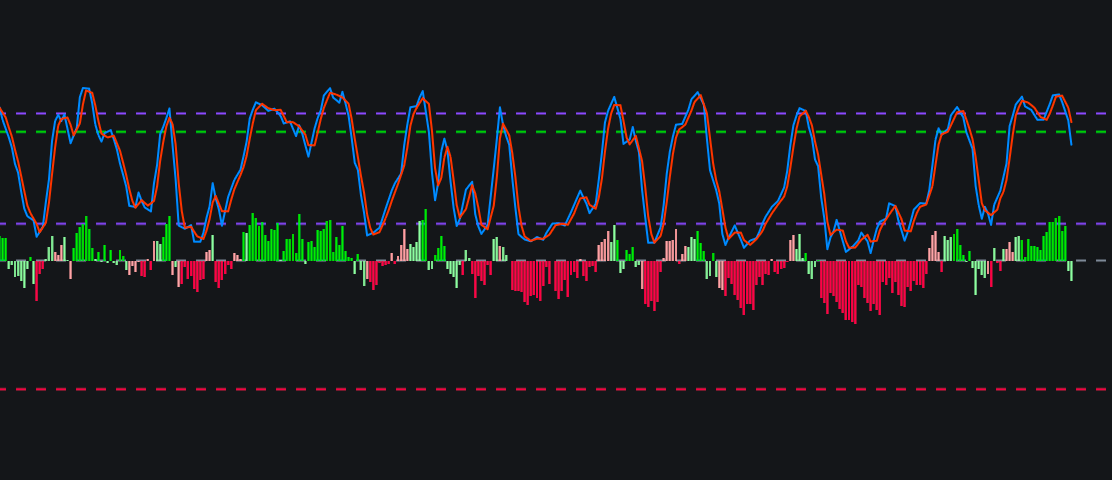
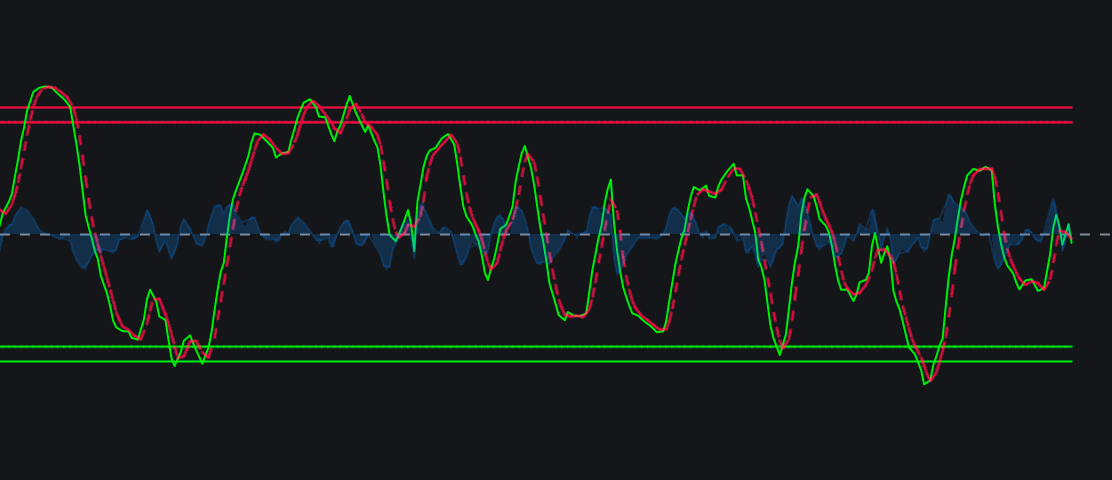
Waddah Attar Explosion Histogramimage
Waddah Attar Explosion Histogram
There are three components to this indicator;  green histograms ,  red histograms , and a  red “explosion” line . The red histogram indicates the current downtrend. The green histogram indicators the current uptrend. The yellow line’s direction shows the…
/indicator/waddah-attar-explosion-histogram-46
Polychromatic Momentumimage
Polychromatic Momentum
The Polychromatic Momentum Indicator  (PMI) is a technical analysis tool developed by Dr. Dennis Meyers that calculates a weighted average of momentum across multiple lookback periods. It solves the problem of traditional momentum indicators—which can f…
/indicator/polychromatic-momentum-98
Correlation Trendimage
Correlation Trend
The Correlation Trend Indicator (CTI)  —famously developed by financial analyst Dr. John Ehlers—is a technical oscillator that measures the direction and strength of a price trend by comparing it to an ideal, straight diagonal line. It oscillates betwee…
/indicator/correlation-trend-8
Smoothed momentum Improvedimage
Smoothed momentum Improved
A smoothed momentum indicator is a technical analysis tool that measures the rate of price changes while applying moving averages or filters to reduce market noise. By eliminating false signals caused by erratic price spikes, it provides a clearer, less …
/indicator/smoothed-momentum-improved-26
Cyber Cycle 0 crossimage
Cyber Cycle 0 cross
The Cyber Cycle is a technical indicator developed by John Ehlers that isolates the cyclical component of market price action. By smoothing out static and noise, it oscillates across a central zero line to help traders identify potential market reversals…
/indicator/cyber-cycle-0-cross-70
Ergodic TVIimage
Ergodic TVI
The Ergodic Tick Volume (TVI) indicator, created by William Blau, measures the relationship between price direction and volume to gauge market momentum and trend reversals. It is typically calculated by double-smoothing tick volume data and plotting it a…
/indicator/ergodic-tvi-69