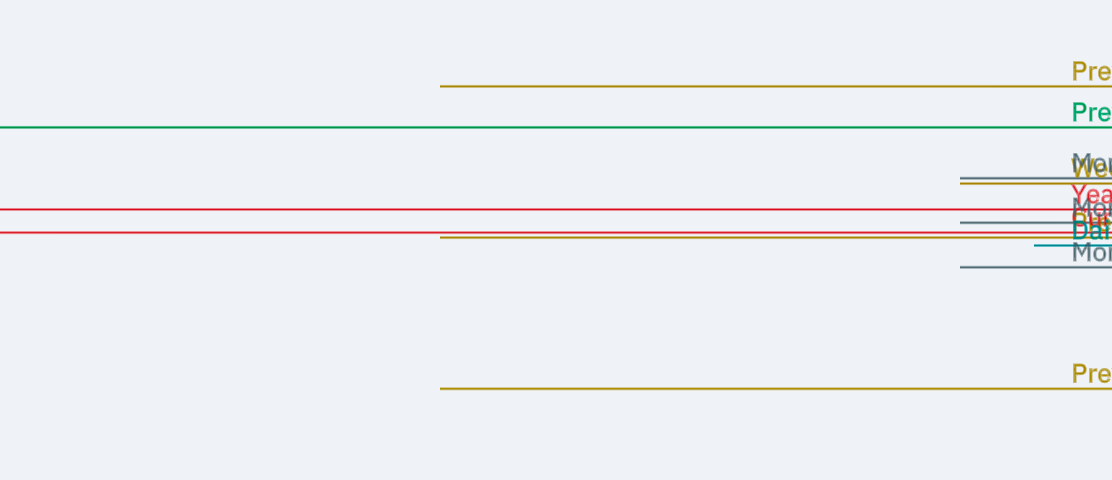
IDWM Key Levels — ported from SpacemanBTCimage
IDWM Key Levels — ported from SpacemanBTC
Plots key reference prices across multiple time frames directly on the chart, so you can instantly see where significant levels — opens, highs, lows and their midpoints for previous and current periods — sit. These are the areas where price often reacts.
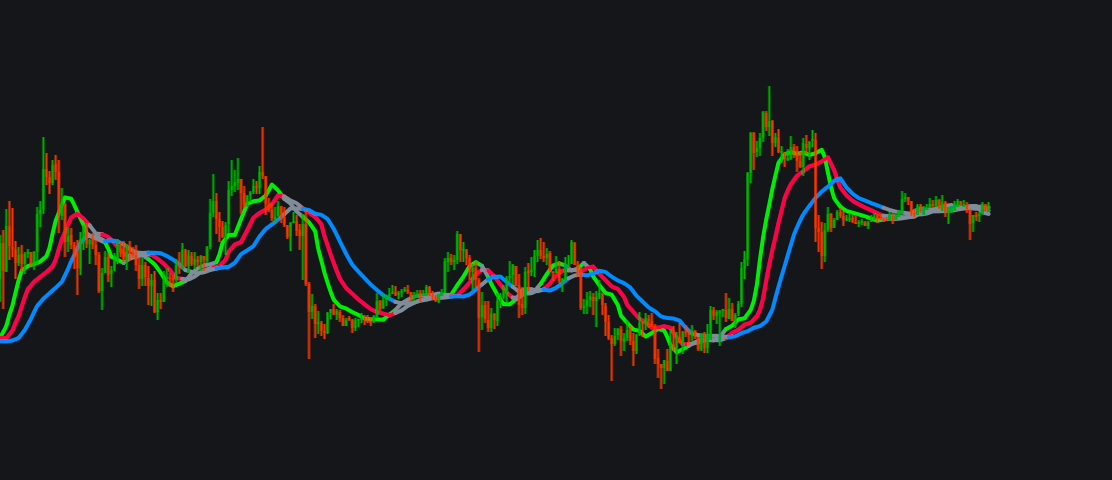
/indicator/idwm-key-levels-ported-from-spacemanbtc-44
Alligator + Fractals + Signalsimage
Alligator + Fractals + Signals
Bill Williams' classic Alligator, extended with what the standard version lacks: automatic market-phase detection, filtered fractals, entry/exit signals and alerts. What it shows Three smoothed moving averages (SMMA), shifted forward, form the Alligator'…
/indicator/alligator-fractals-signals-82
SImple Crossoverimage
SImple Crossover
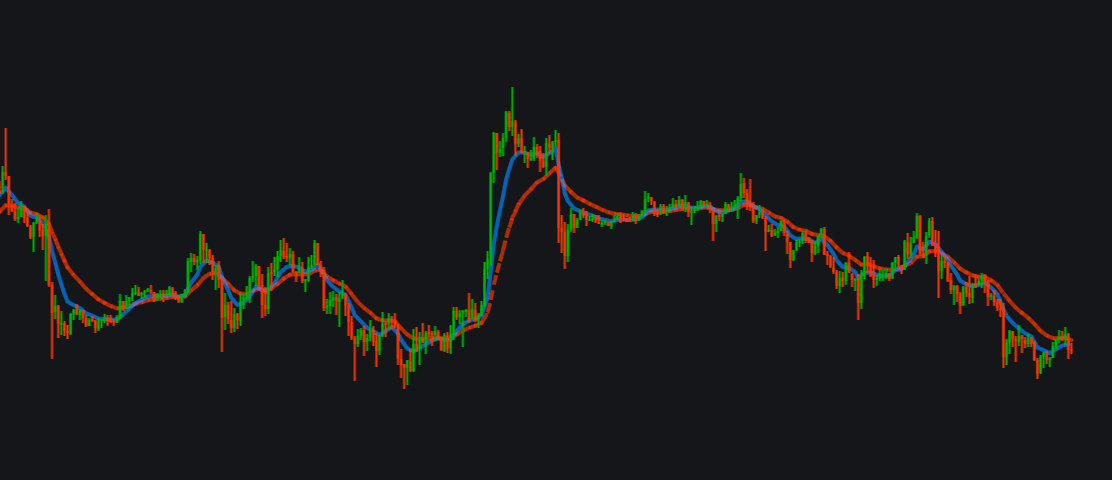
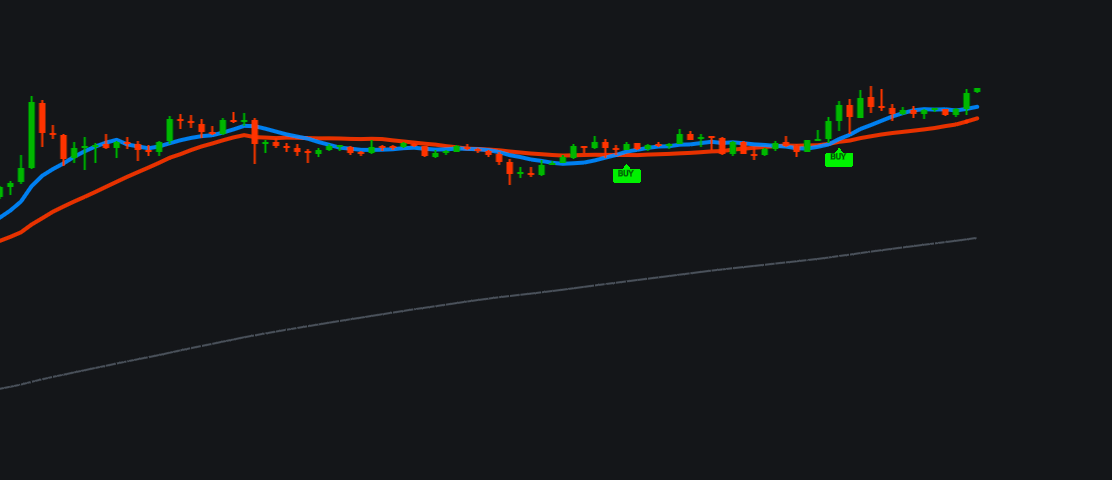
hey buddies, this is a simple exponential moving average crossover indicator for beginners,  it shows the market trend, if blue line is above red line then market is in uptrend direction, if the red line is above blue line then market is in down trend. T…
/indicator/simple-crossover-9
SIGNAL SMC SIMPLEimage
SIGNAL SMC SIMPLE
Signal Dictionary LIQ H Liquidity High — identifies a liquidity area at a high. LIQ L Liquidity Low — identifies a liquidity area at a low. BUY CONF Indicates a confirmed BUY signal. SELL CONF Indicates a confirmed SELL signal. L — Liquidity Indicates th…
/indicator/signal-smc-simple-41
Indicator sessionsimage
Indicator sessions
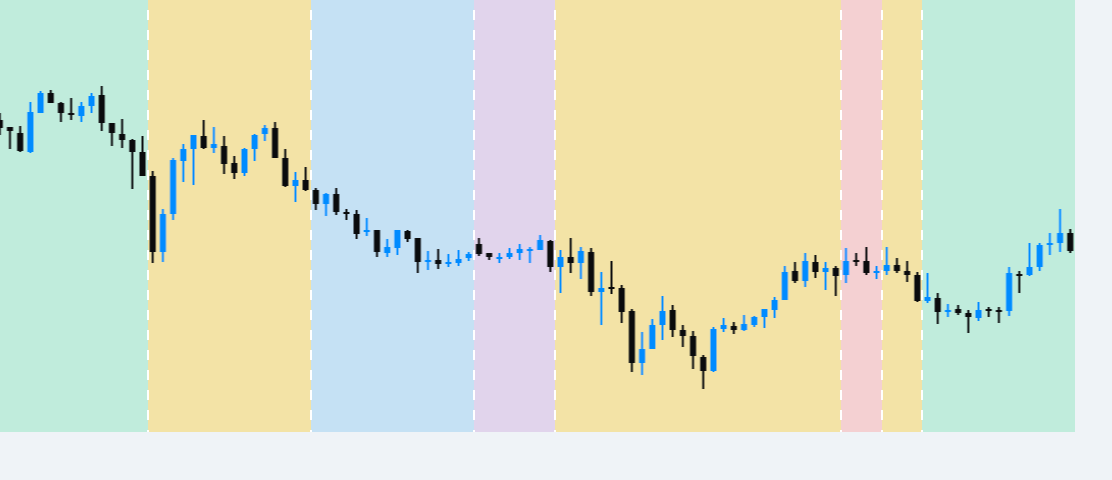
Arrêtez de deviner quelle session de marché est actuellement active. Trading Sessions Indicator vous permet de visualiser directement sur votre graphique les principales sessions Forex : Sydney, Tokyo, Londres et New York . L’indicateur colore automat…
/indicator/indicator-sessions-7
Zalen WaveTrend Overlayimage
Zalen WaveTrend Overlay
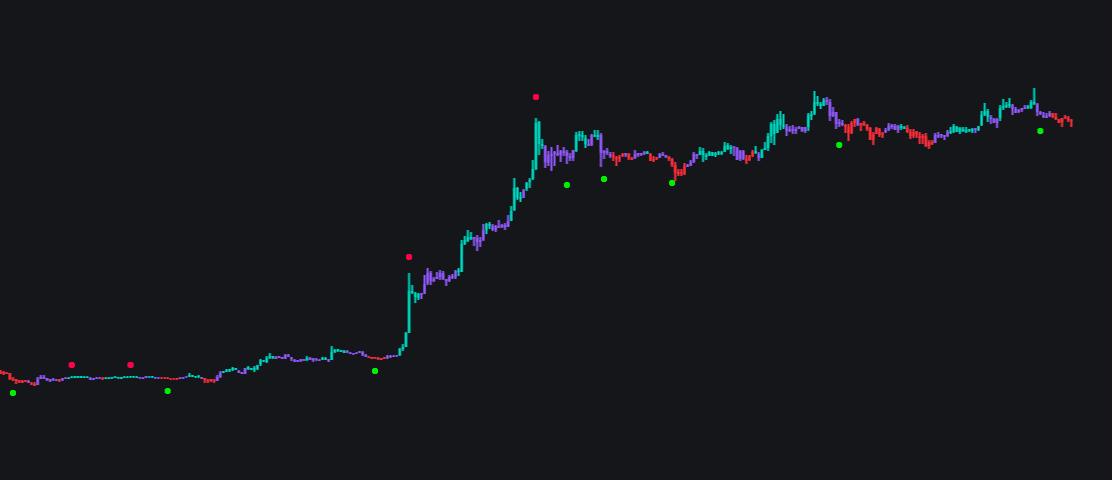
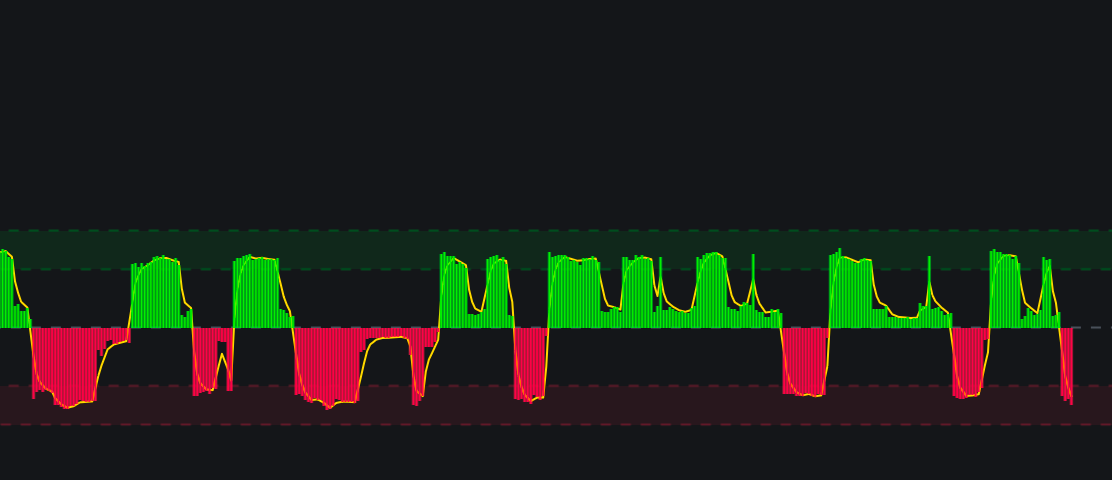
Zalen WaveTrend Overlay is a clean momentum and trend visualization tool designed to bring WaveTrend-style market structure directly onto the price chart. Instead of relying on a separate oscillator pane, the indicator translates momentum and trend cond…
/indicator/zalen-wavetrend-overlay-53
Zalen EMA Trend Cloudimage
Zalen EMA Trend Cloud
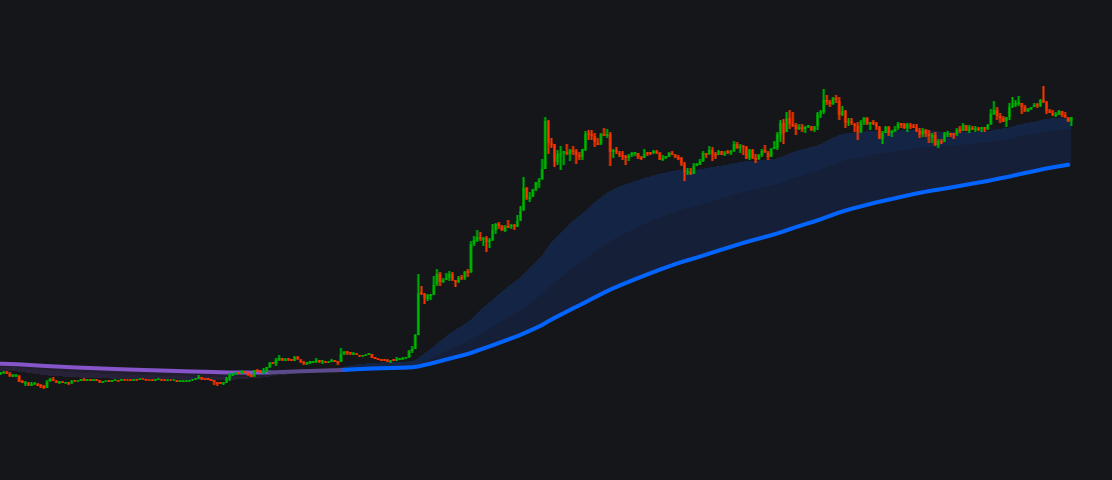
Zalen EMA Trend Cloud is a clean trend-following overlay designed to make market direction instantly readable without cluttering your chart. The indicator combines three configurable exponential moving averages — 50, 100 and 200 EMA by default — into a …
/indicator/zalen-ema-trend-cloud-59
Lawrence Horizon Trackerimage
Lawrence Horizon Tracker
Lawrence Horizon Tracker is a dynamic trend-following indicator designed to spot high-probability entries. It combines Fast (9) and Slow (21) Simple Moving Average crossovers with a 200 Exponential Moving Average trend filter. Bullish BUY and Bearish SE…
/indicator/lawrence-horizon-tracker-45
SMC-by-atif-bhaiimage
SMC-by-atif-bhai
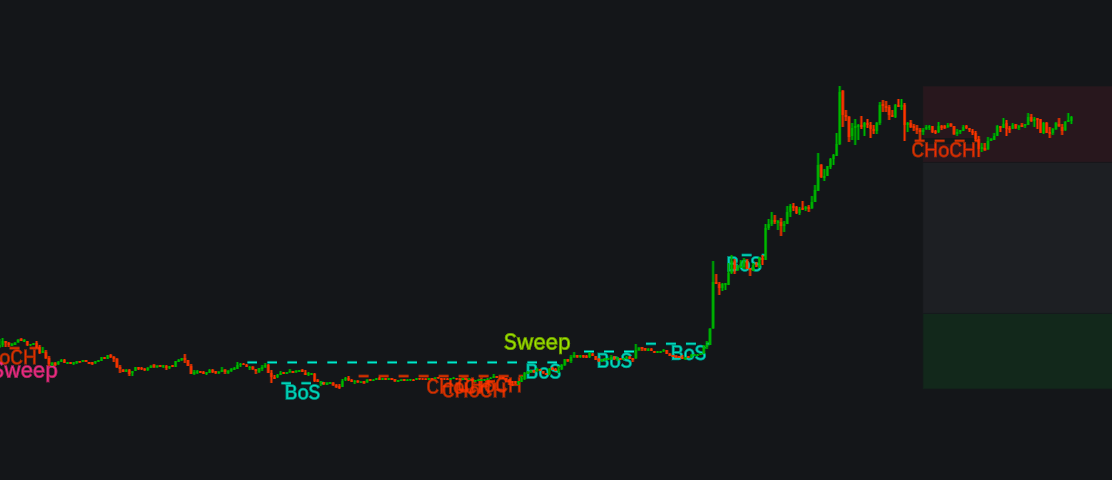
Smart Money Concepts, Order block, FVG, Liquidity Sweeps, BoS, CHoCh, Premium and discount zones, Notifications. Here's how it all works: Detection logic ("perfect" OB) Bullish OB  — triggers when a strong bullish candle (body > avg_body × multiplier) br…
/indicator/smc-by-atif-bhai-78
ATR Adaptive ZigZagimage
ATR Adaptive ZigZag
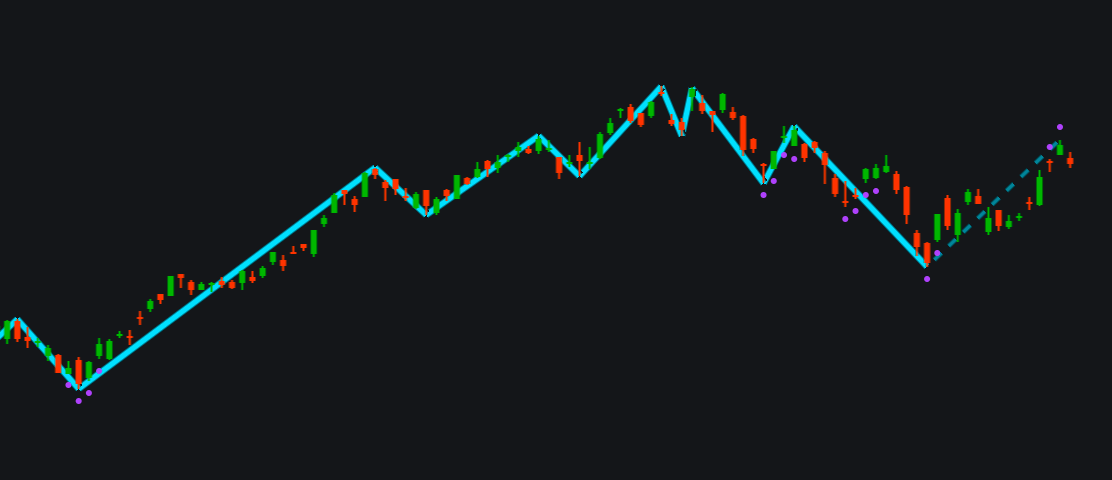
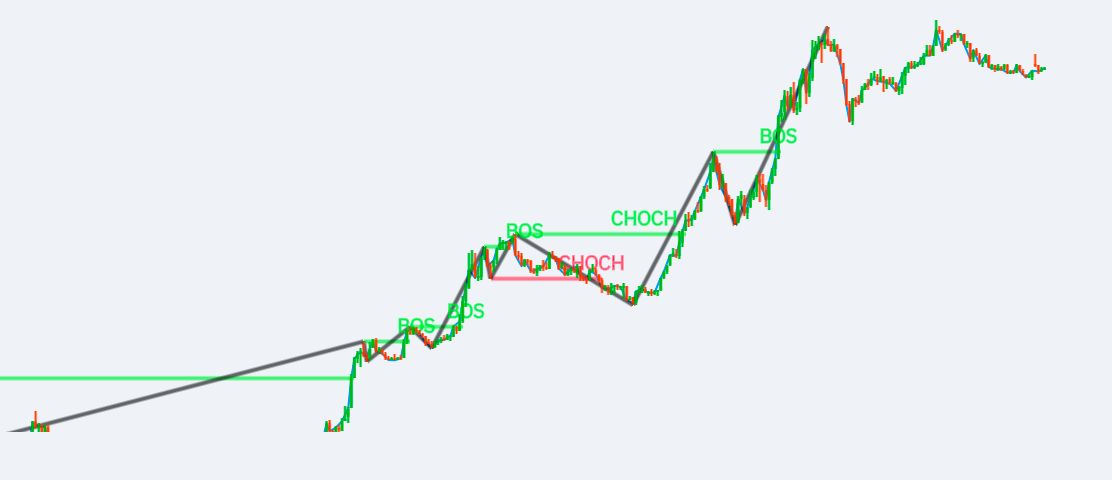
ATR Adaptive ZigZag is a chart-overlay indicator for reading market structure across changing volatility conditions. It reduces small price fluctuations into a sequence of meaningful swing legs while preserving a live view of the move that is still devel…
/indicator/atr-adaptive-zigzag-20
Average True Range Stop Loss Finderimage
Average True Range Stop Loss Finder
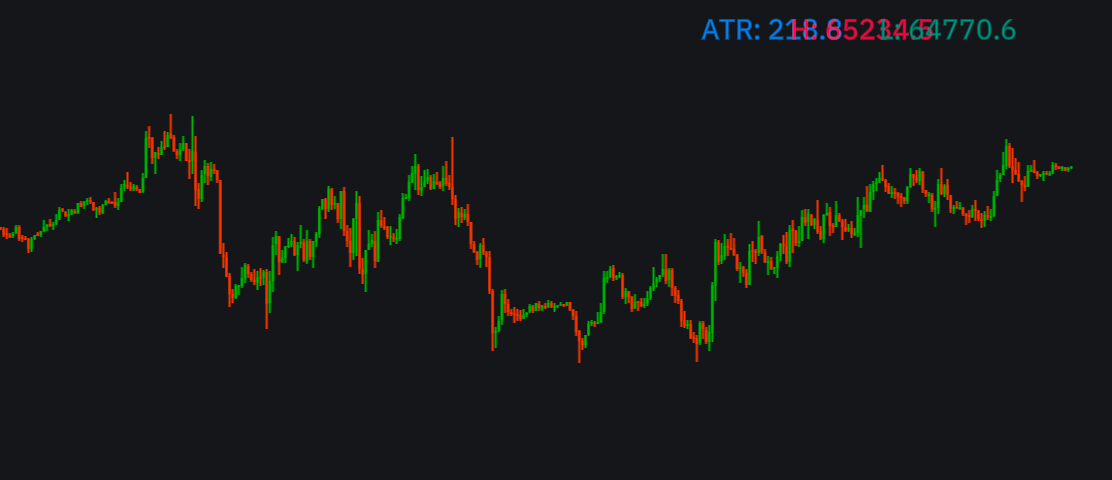
This is a volatility-based stop-loss indicator that plots two dynamic price levels using the Average True Range (ATR): a High Stop above the market and a Low Stop below it. Instead of a fixed pip or point distance, the stop level automatically widens whe…
/indicator/average-true-range-stop-loss-finder-18
Struct Edge v1image
Struct Edge v1
Struct Edge [InsightEdge]  Market Structure is one of the core concepts in price action analysis, helping traders understand the underlying trend and identify potential shifts in market direction. This indicator automatically detects significant swing hi…
/indicator/struct-edge-v1-70
ICT Smart Money POI & Entry Suiteimage
ICT Smart Money POI & Entry Suite
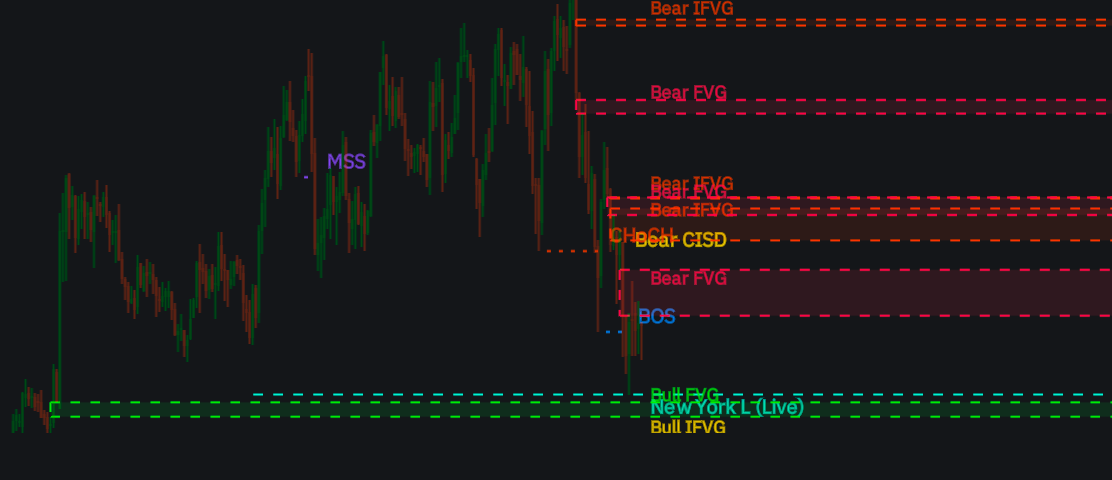
ICT Smart Money POI & Entry Suite ICT Smart Money POI & Entry SuiteICT Smart Money POI & Entry Suite is an all-in-one chart overlay designed for traders who use ICT and Smart Money Concepts. It automatically maps market structure, liquidity, institutiona…
/indicator/ict-smart-money-poi-entry-suite-97
Confluence Power Scoreimage
Confluence Power Score
Confluence Power Score A confluence-based technical indicator that combines three complementary analysis factors into a single, easy-to-read score — so you don't have to watch multiple separate indicators on your chart. 📈 Trend — via a fast/slow EMA c…
/indicator/confluence-power-score-6
Session Assist v1image
Session Assist v1
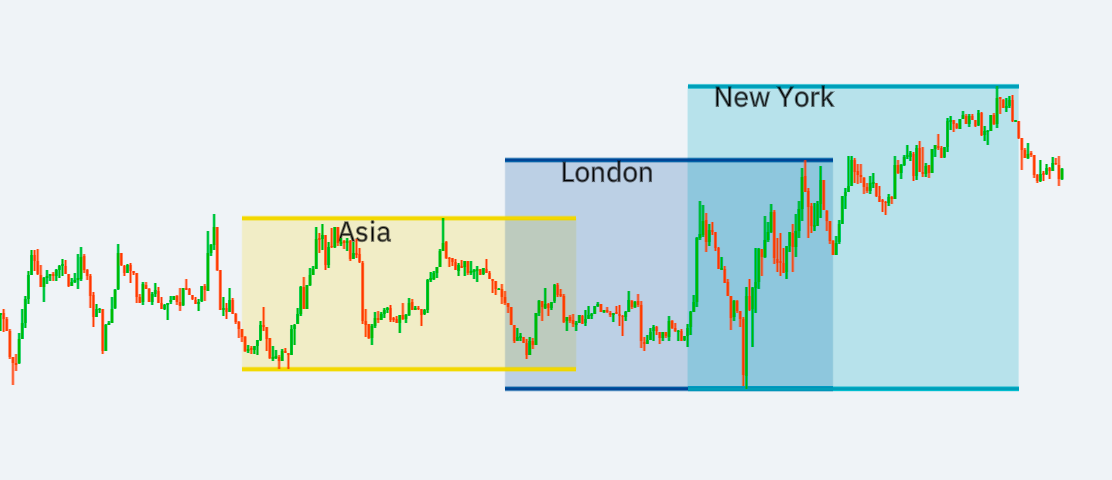
Session Assist Session Assist is a lightweight trading session indicator designed to help traders visualize the three major forex trading sessions—Asia, London, and New York—directly on the chart. As each session unfolds, the indicator continuously track…
/indicator/session-assist-v1-72