Text (Alt + Shift + T)
How to Use
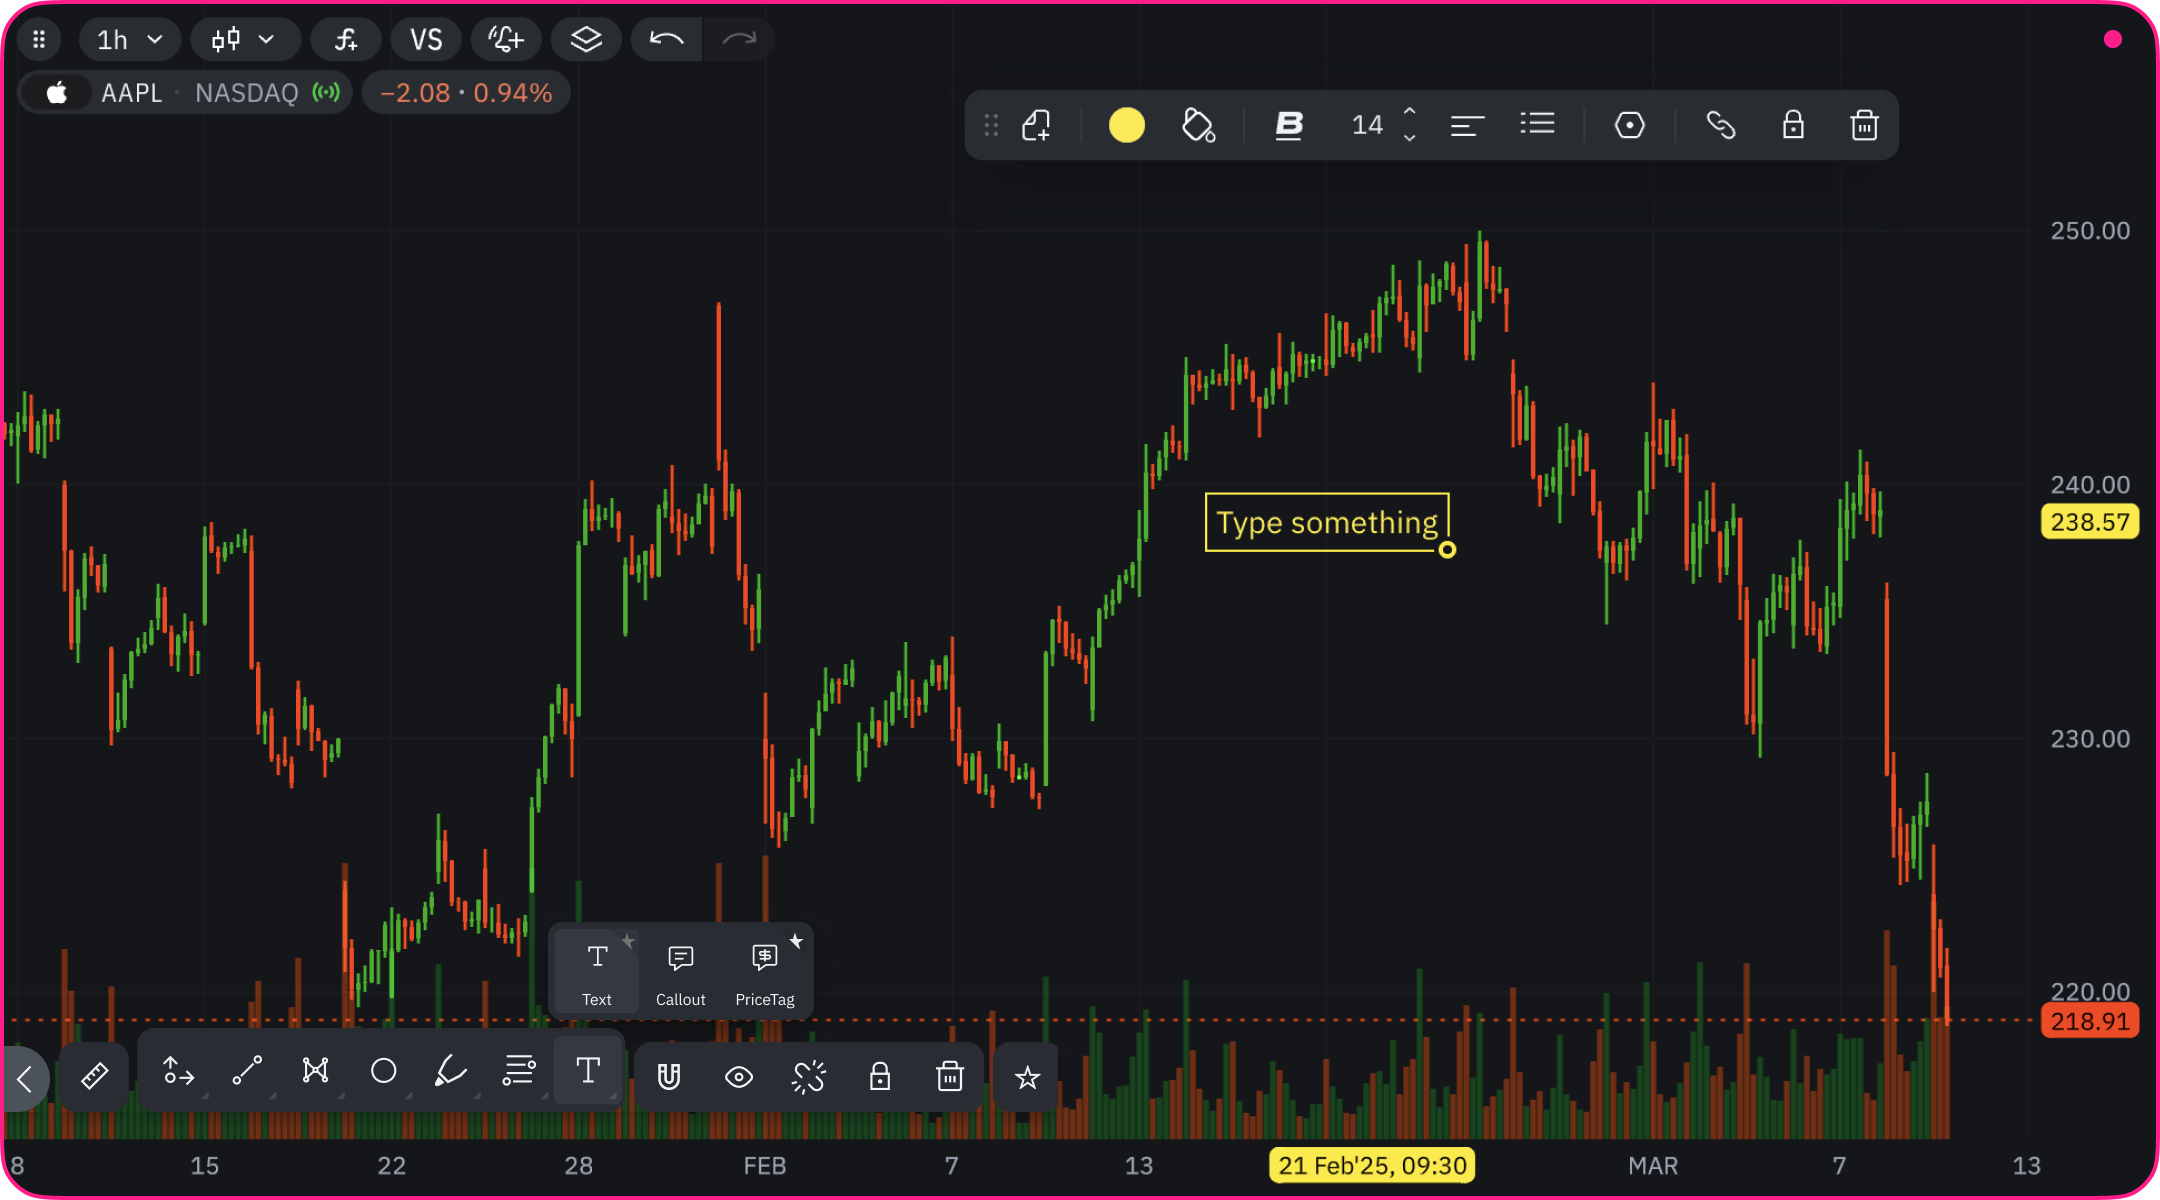
- Select the Text tool from the drawing toolbar
- Click on the chart where you want to place your text
- Type your message
- Click outside the text box to confirm
Practical Applications
- Add trading notes to specific price levels
- Mark important events on the chart
- Record analysis observations
- Create custom labels for patterns
- Document trend characteristics
Customization Options
- Add and edit text directly on the chart or by using the dedicated text editor block found in the specific text settings menu
- Text formatting:
- Bold, italic, underline, strikethrough
- Font size adjustment
- Text alignment (left, center, right)
- Color settings:
- Text color
- Background color
- List formatting:
- Bulleted lists
- Numbered lists
Precise Positioning
- Set exact price level in the Parameters settings
- Adjust position after placement by dragging
Callout (Alt + Shift + Y)
How to Use
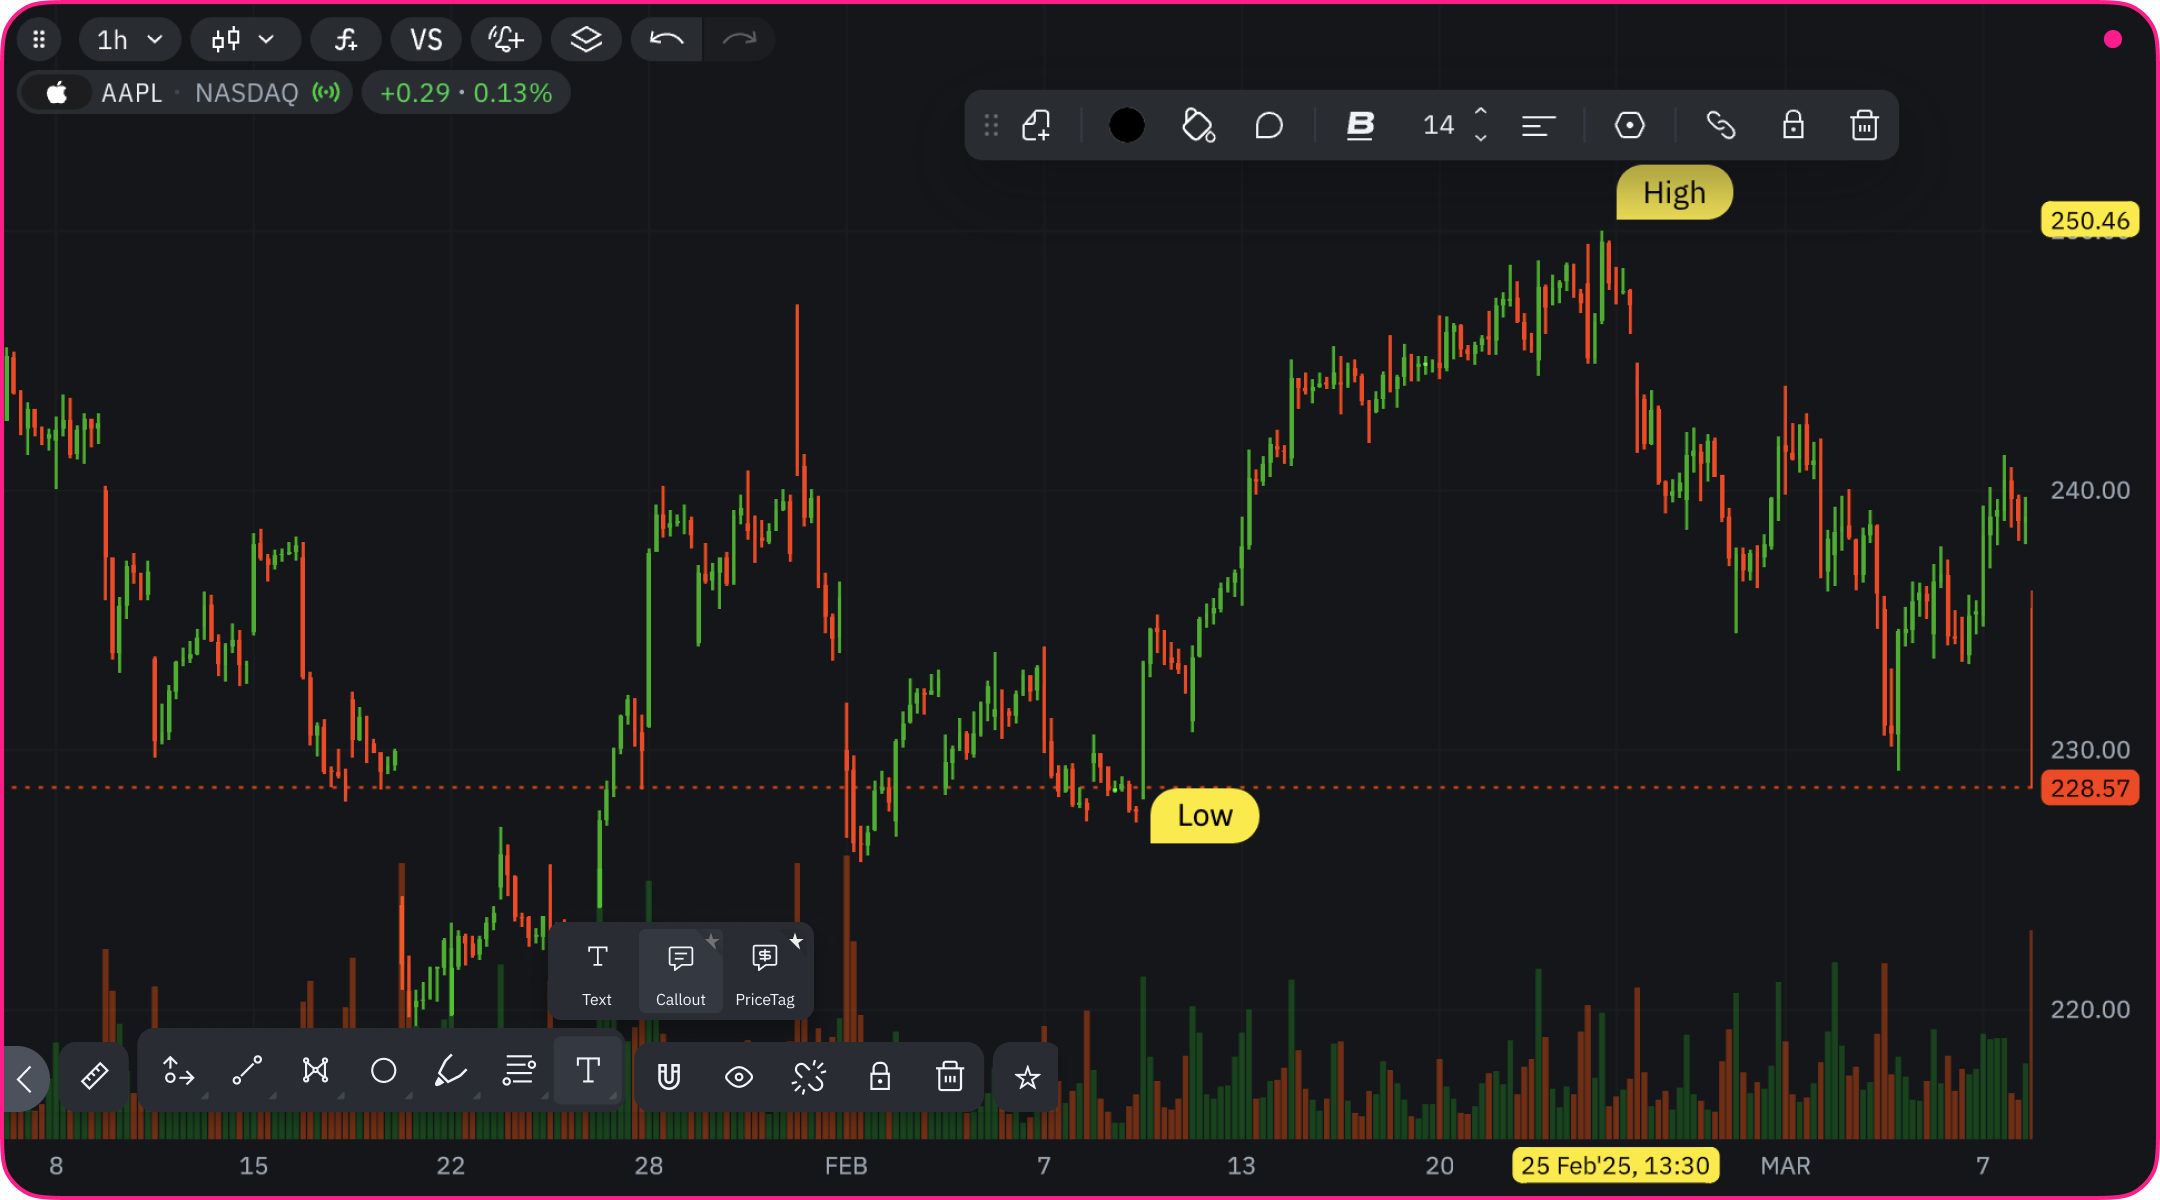
- Select the Callout tool
- Click on the chart to place the callout
- Type your message
- Adjust the direction of the pointer as needed
Practical Applications
- Point to specific candlestick patterns
- Highlight breakout points
- Indicate entry/exit signals
- Call attention to gap areas
- Mark exact reversal points
Customization Options
- Same text formatting options as Text tool:
- Bold, italic, underline, strikethrough
- Font size adjustment
- Text alignment options
- Color settings:
- Text color
- Background color
- Pointer position:
- Up, down, left, right
- Upper right, upper left
- Lower right, lower left
Precise Positioning
- Set exact price level in Parameters settings
- Reposition both text box and pointer after placement
Price Tag (Alt + Shift + G)
How to Use
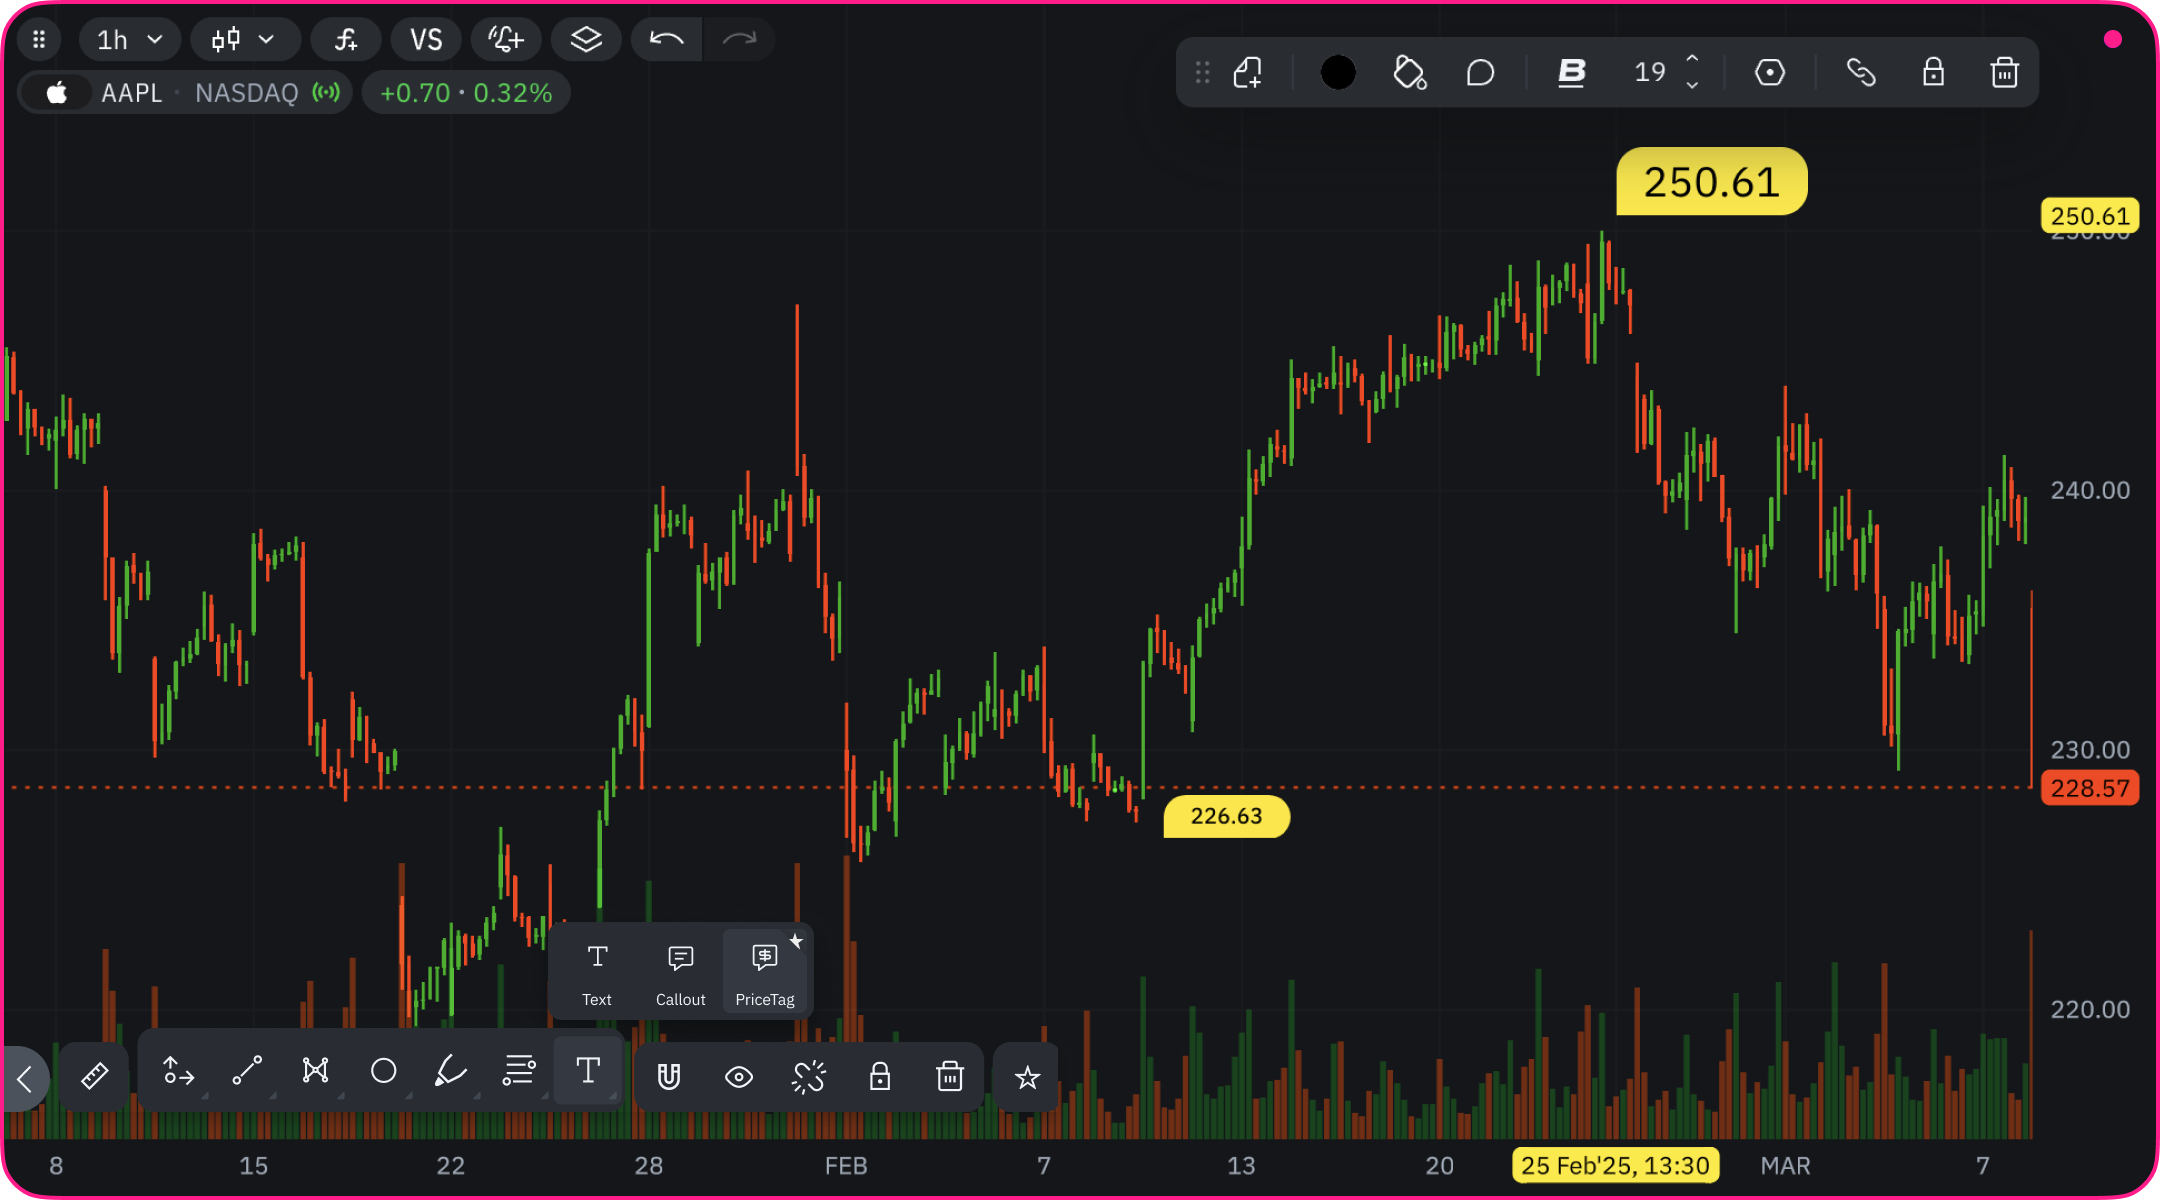
- Select the Price Tag tool
- Click on the chart at the desired price level
- Add custom text if needed
- Adjust position as required
Practical Applications
- Mark support and resistance levels
- Highlight important price thresholds
- Annotate historical highs and lows
- Label price targets
- Mark stop-loss or take-profit levels
Customization Options
- Text formatting options:
- Bold, italic, underline, strikethrough
- Font size adjustment
- Text alignment choices
- Color settings:
- Text color
- Background color
- Pointer position:
- Up, down, left, right
- Upper right, upper left
- Lower right, lower left
Precise Positioning
- Set exact price level in Settings
- Fine-tune position after placement
Editing Text from the Settings Panel
You don’t need to redraw a text object to change its wording. Any drawing that contains a text box — the Text, Callout, and Price Tag tools, as well as line, circle, and rectangle drawings — can be edited from its settings panel:- Select the drawing on the chart.
- Open its settings panel.
- Edit the text directly in the text-editor block, then adjust formatting (font, size, color, alignment) in the same panel.