Pen (Alt + P)
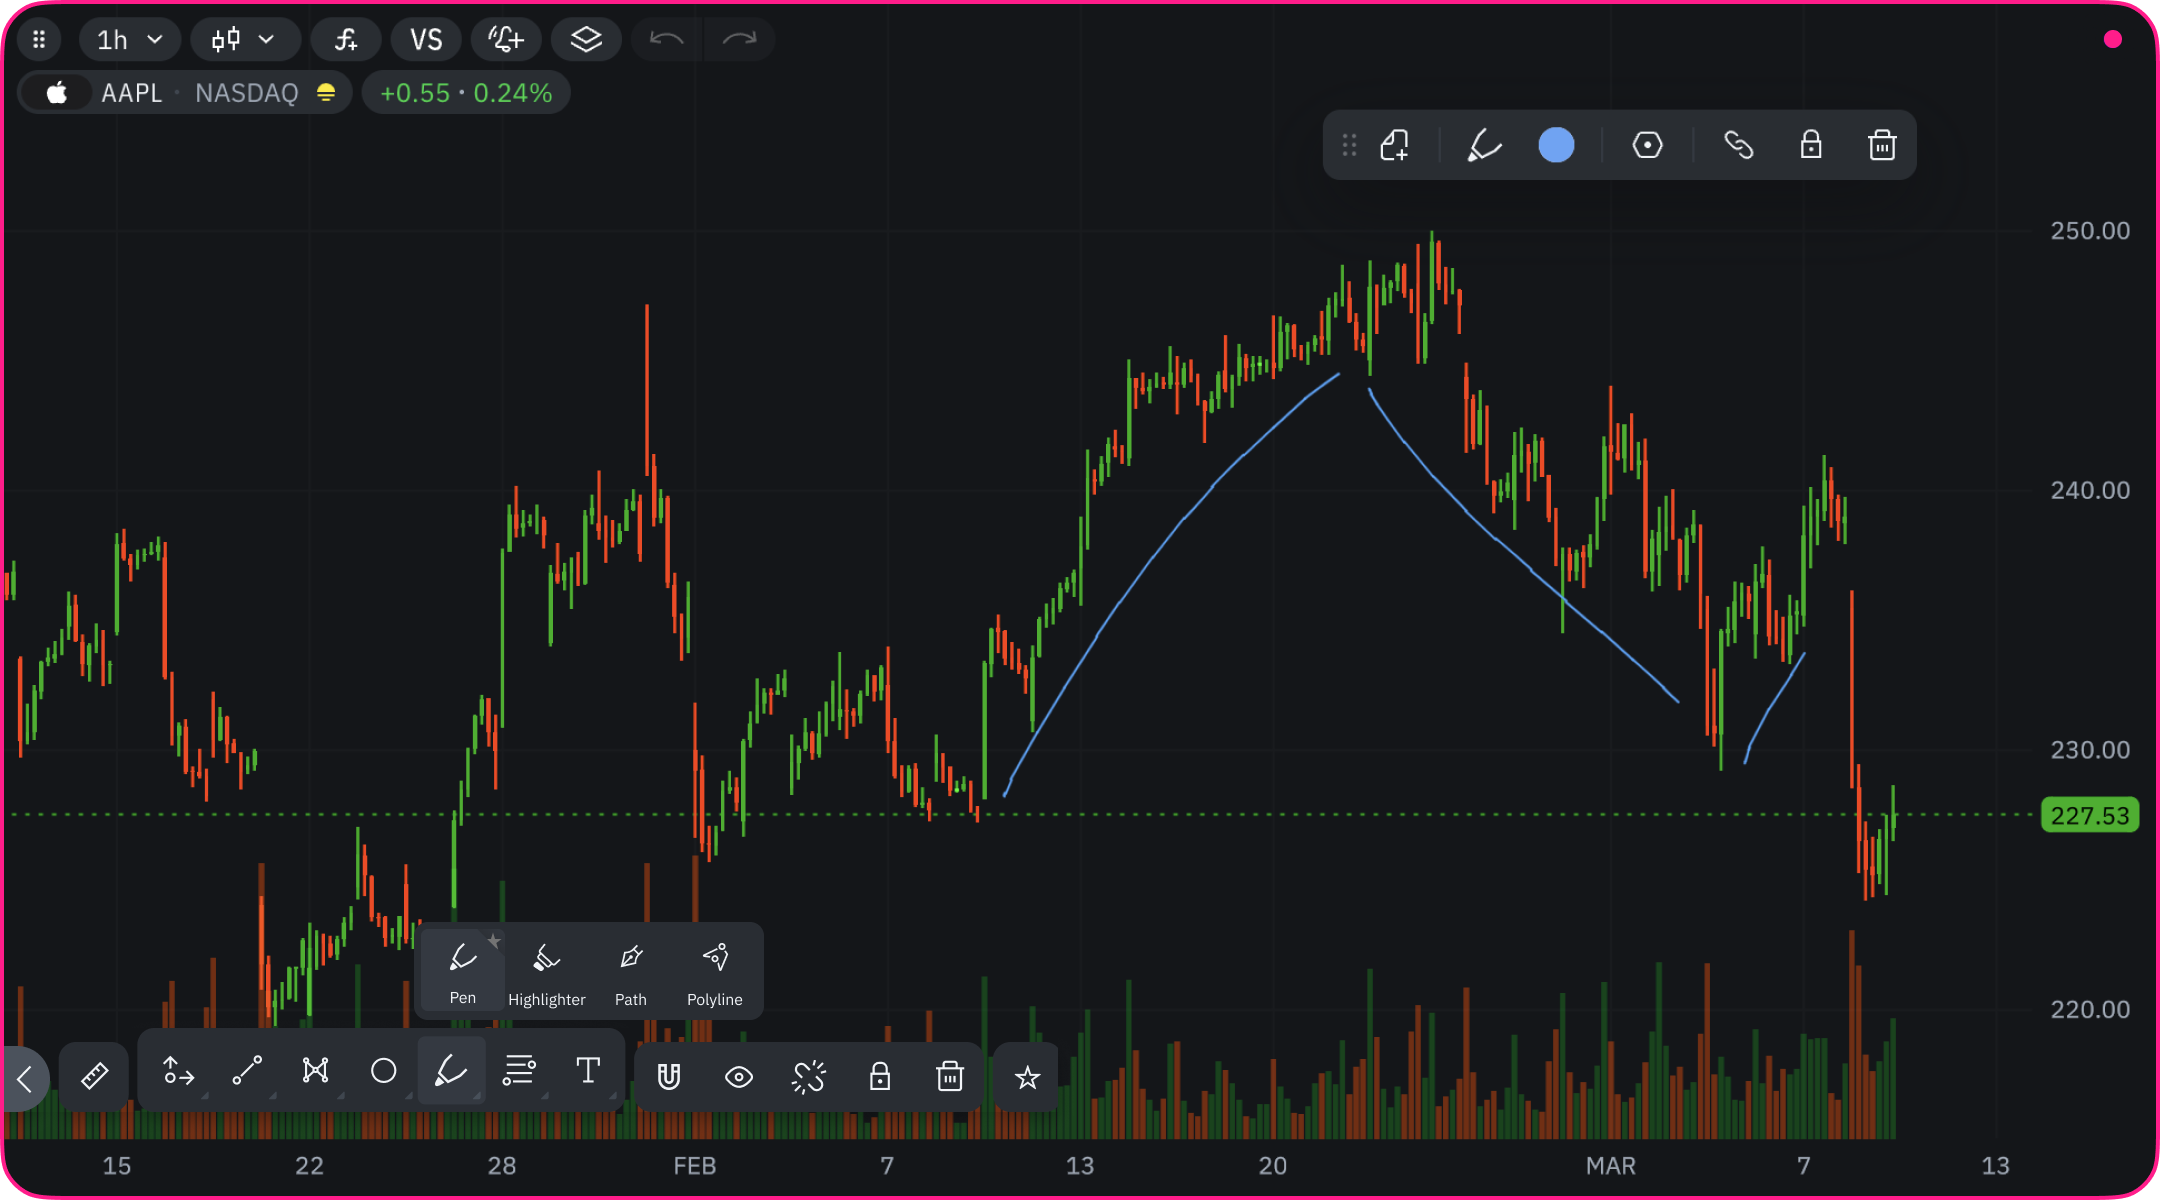
The Pen tool allows for completely freeform drawing on your chart, similar to drawing with a pen on paper. It creates a continuous line that follows your mouse movement exactly.How to Use
- Select the Pen tool from the drawing toolbar
- Click and hold on the chart where you want to begin drawing
- Move your mouse while holding down the button to create your line
- Release to complete the drawing
Practical Applications
- Create custom annotations
- Draw attention to irregular patterns
- Circle multiple areas with a single tool
- Add personalized notes and markings
- Sketch potential price trajectories
Customization
- Adjust line color
- More customization options coming soon
Highlighter (Alt + I)
The Highlighter creates semi-transparent colored areas to emphasize important regions on your chart without obscuring the underlying price action.How to Use
- Select the Highlighter tool
- Click and hold where you want to begin highlighting
- Drag across the chart area you want to emphasize
- Release to complete the highlight
Practical Applications
- Mark important price zones
- Highlight historical areas of interest
- Emphasize potential accumulation/distribution regions
- Create visual reference points
- Mark important news events or earnings periods
Customization
- Choose highlight color
- Fixed transparency for maximum readability
Path (Alt + Shift + P)
The Path tool creates a connected series of straight line segments. Unlike the freeform Pen tool, Path creates precise, connected straight lines between each click.How to Use
- Select the Path tool
- Click to set the starting point
- Click each subsequent point to create connected line segments
- Double-click or press Enter to complete the path
Practical Applications
- Create complex trendlines with multiple segments
- Draw irregular support/resistance zones
- Chart custom price channels
- Map out potential price targets
- Create detailed annotations with exact positioning
Customization
- Line color selection
- Additional style options coming in future updates
Polyline Tool (Alt + N)
The Polyline tool creates an open-ended series of connected line segments. Similar to Path but designed for creating open shapes rather than closed figures.How to Use
- Select the Polyline tool
- Click to place the first point
- Click to add each additional point
- Double-click or press Enter to finish
Practical Applications
- Draw complex price projections
- Create multi-segment trendlines
- Map zigzag patterns
- Chart irregular market structures
- Connect multiple key price points
Customization
- Line color selection
- More customization features coming soon