Quick Measure (Shift + M)
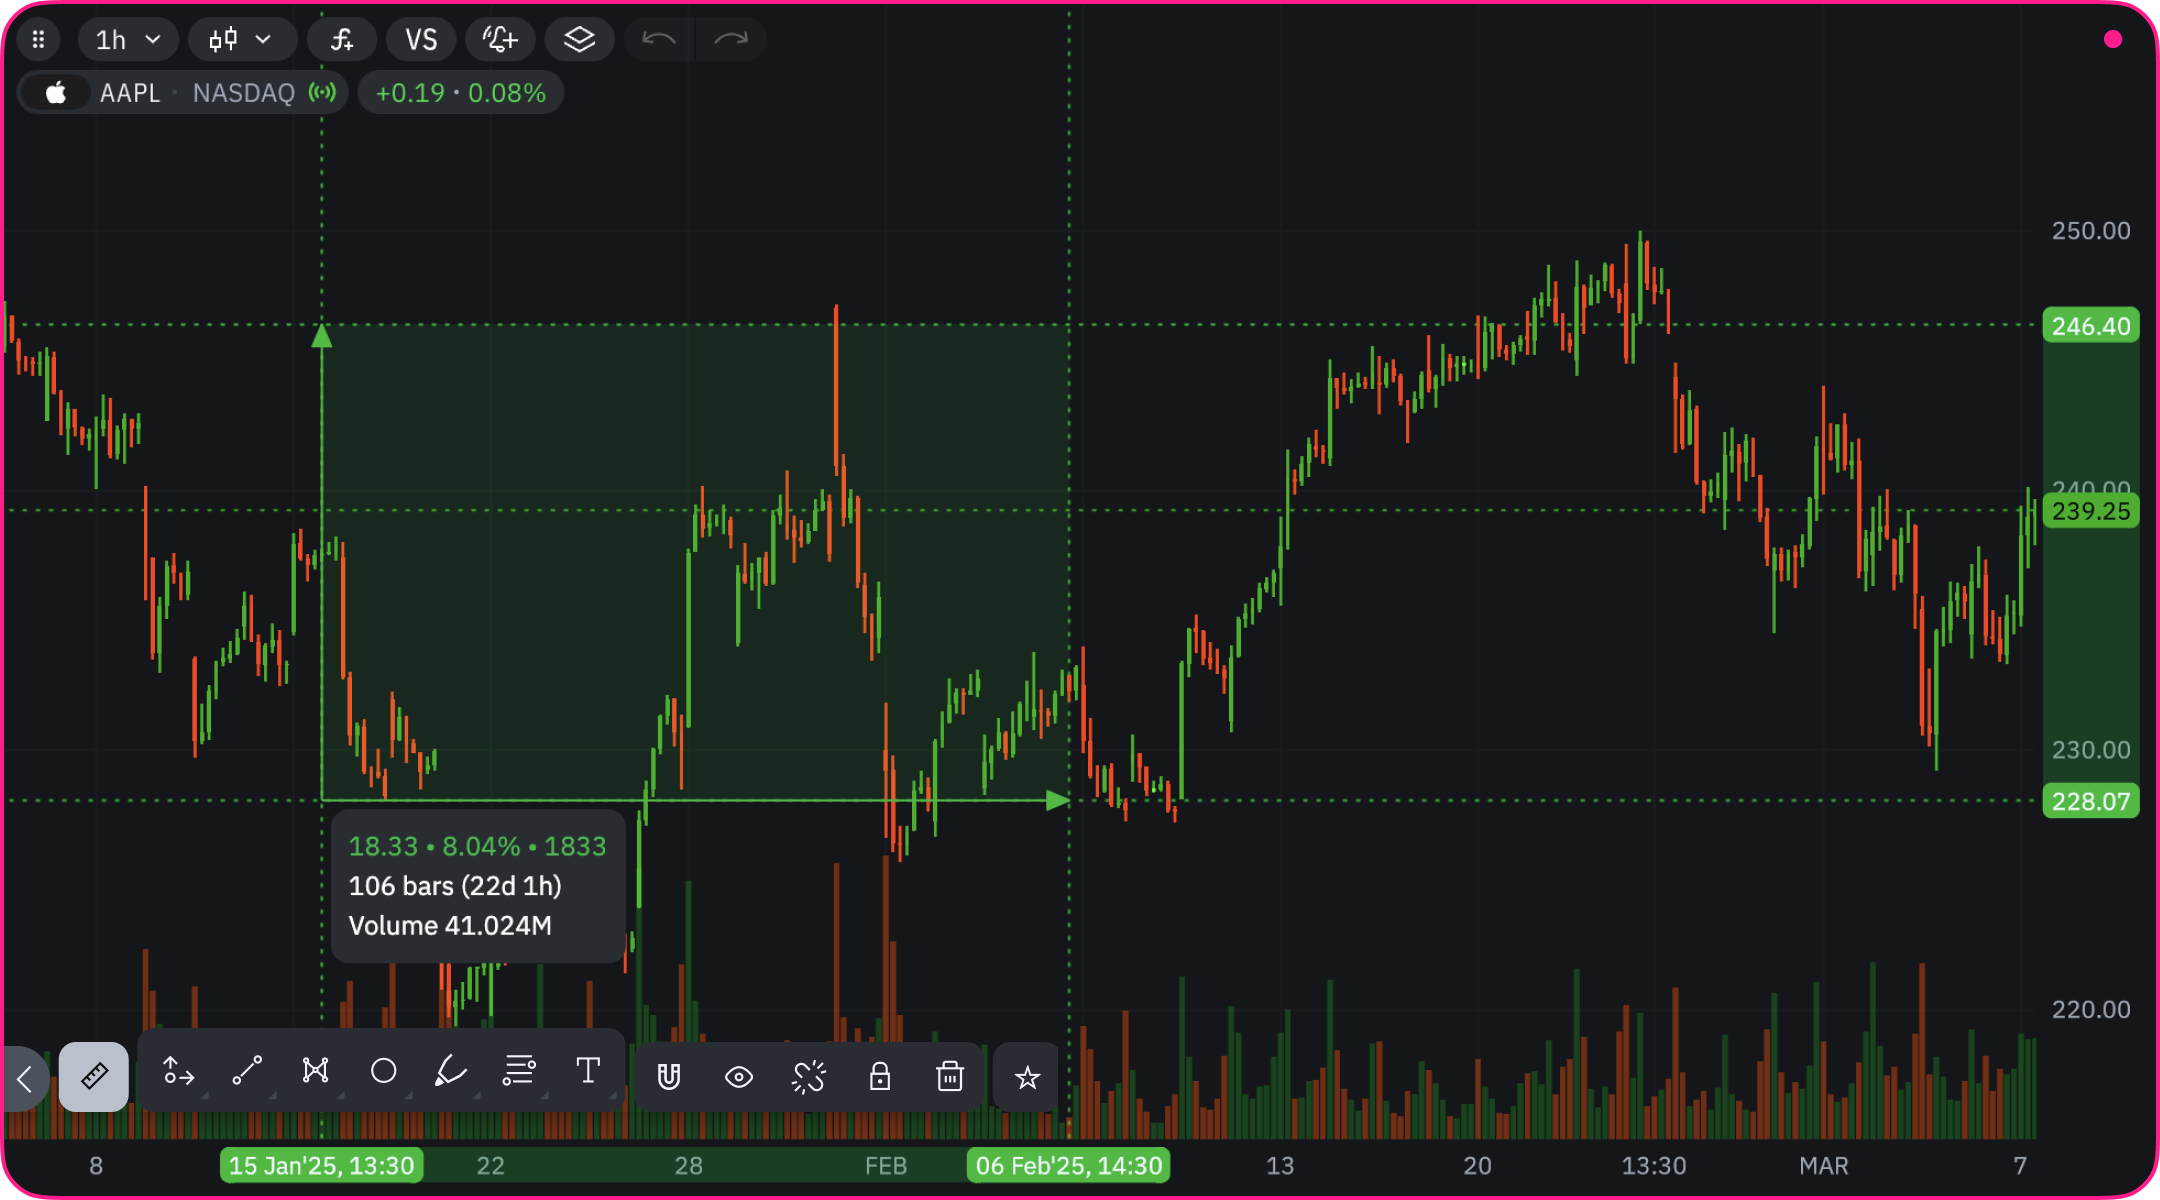
- Click starting point
- Click endpoint
- View measurement data:
- Price change (absolute, percentage, ticks)
- Bar count (days and hours)
- Trading volume (if available)
Date & Price
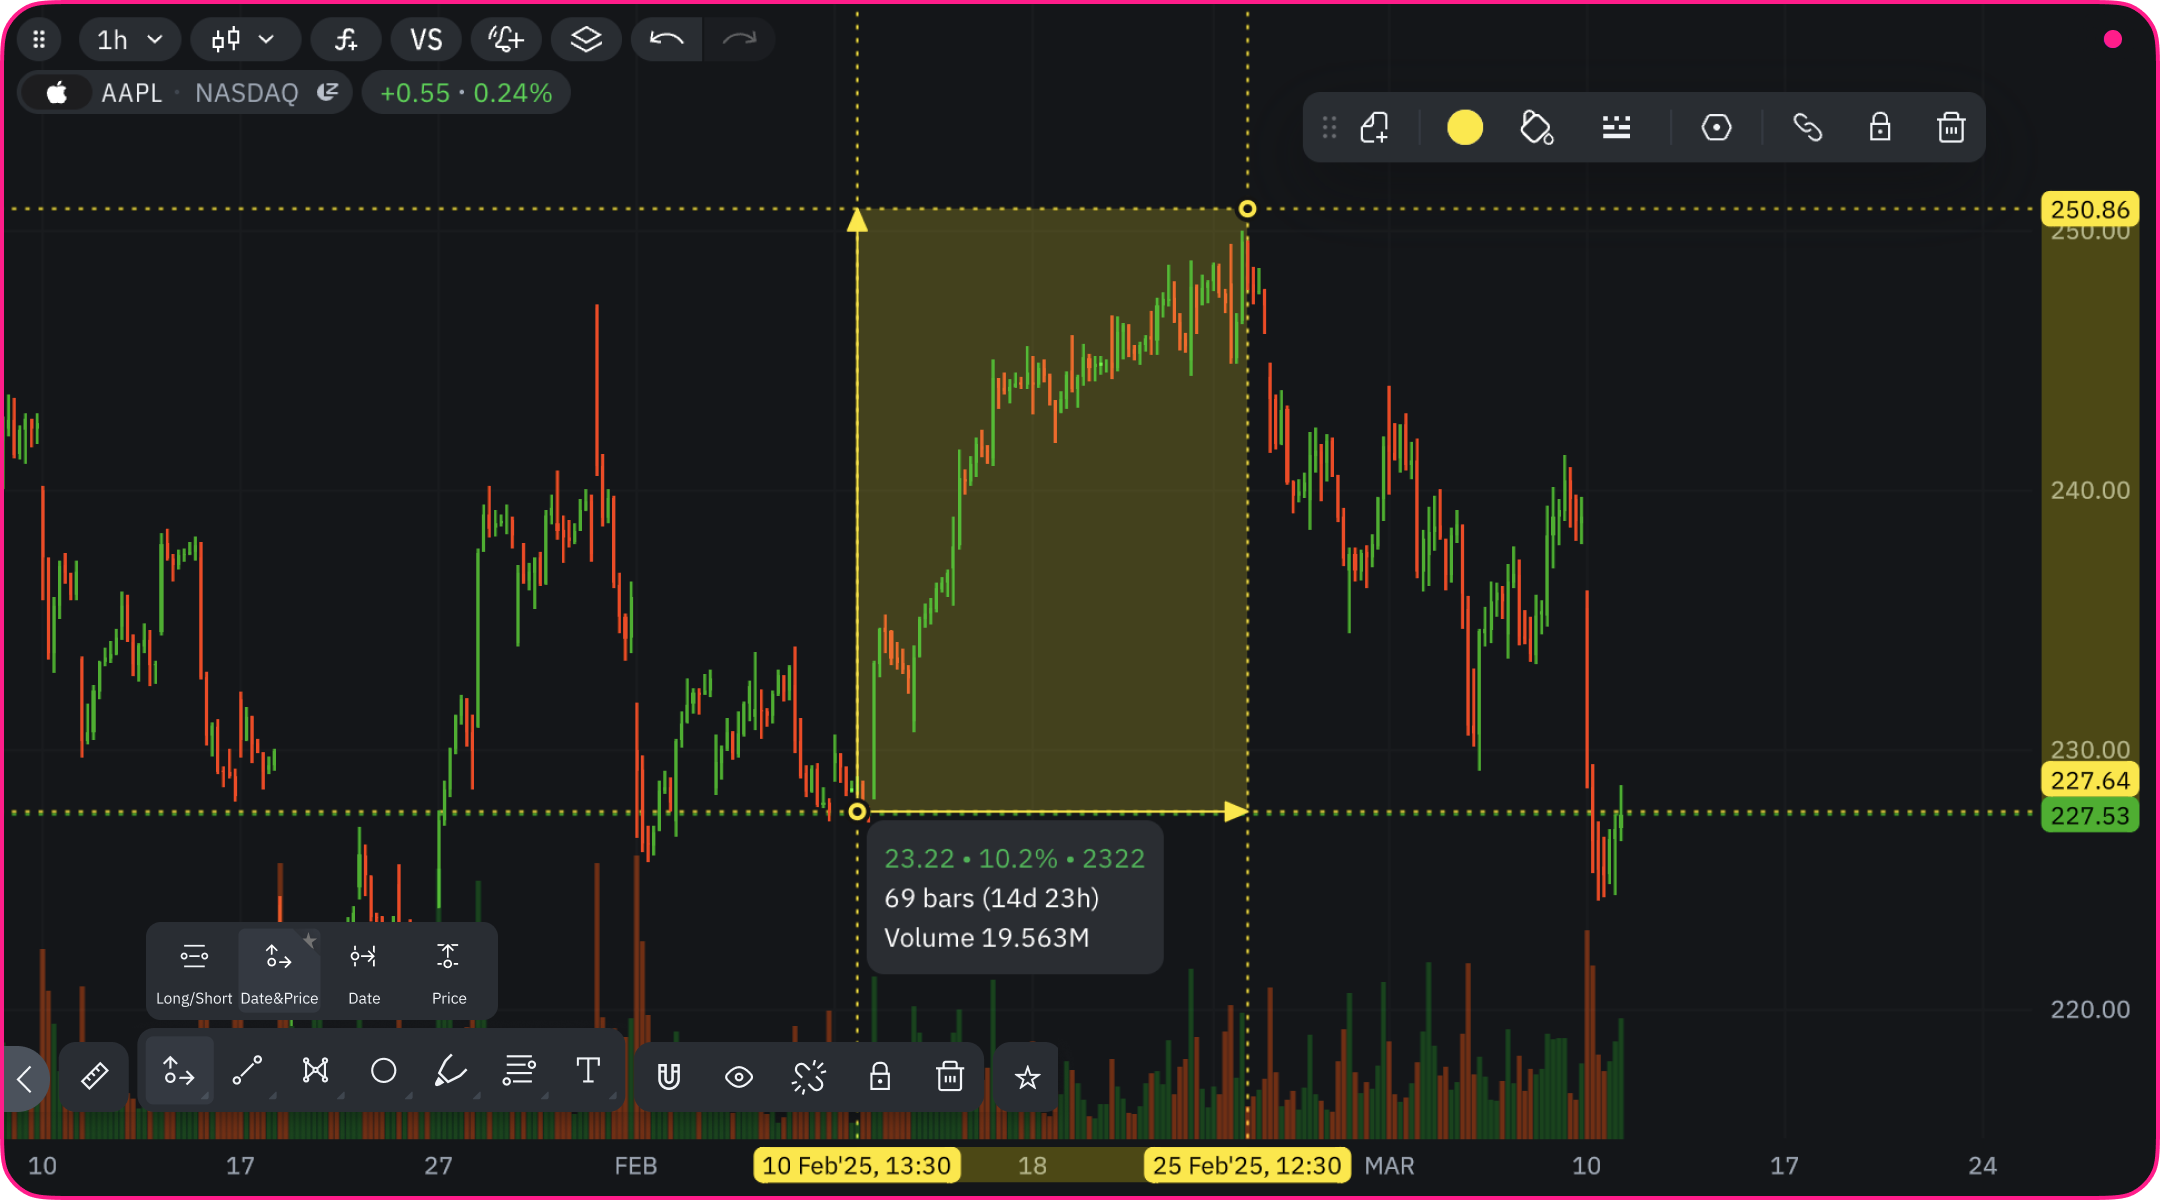
- Measures both price changes and time periods
- Shows distance in bars/time and price movement
- Displays results in absolute values and percentages
Date Only (Alt + D)
Focuses on temporal measurements:- Counts bars between points
- Converts to weeks/days/hours (any chosen timeframe on the chart)
- Perfect for timing analysis
Price Only (Alt + Shift + M)
Concentrates on price movements:- Shows vertical price changes
- Displays movement in absolute values
- Includes percentage calculations
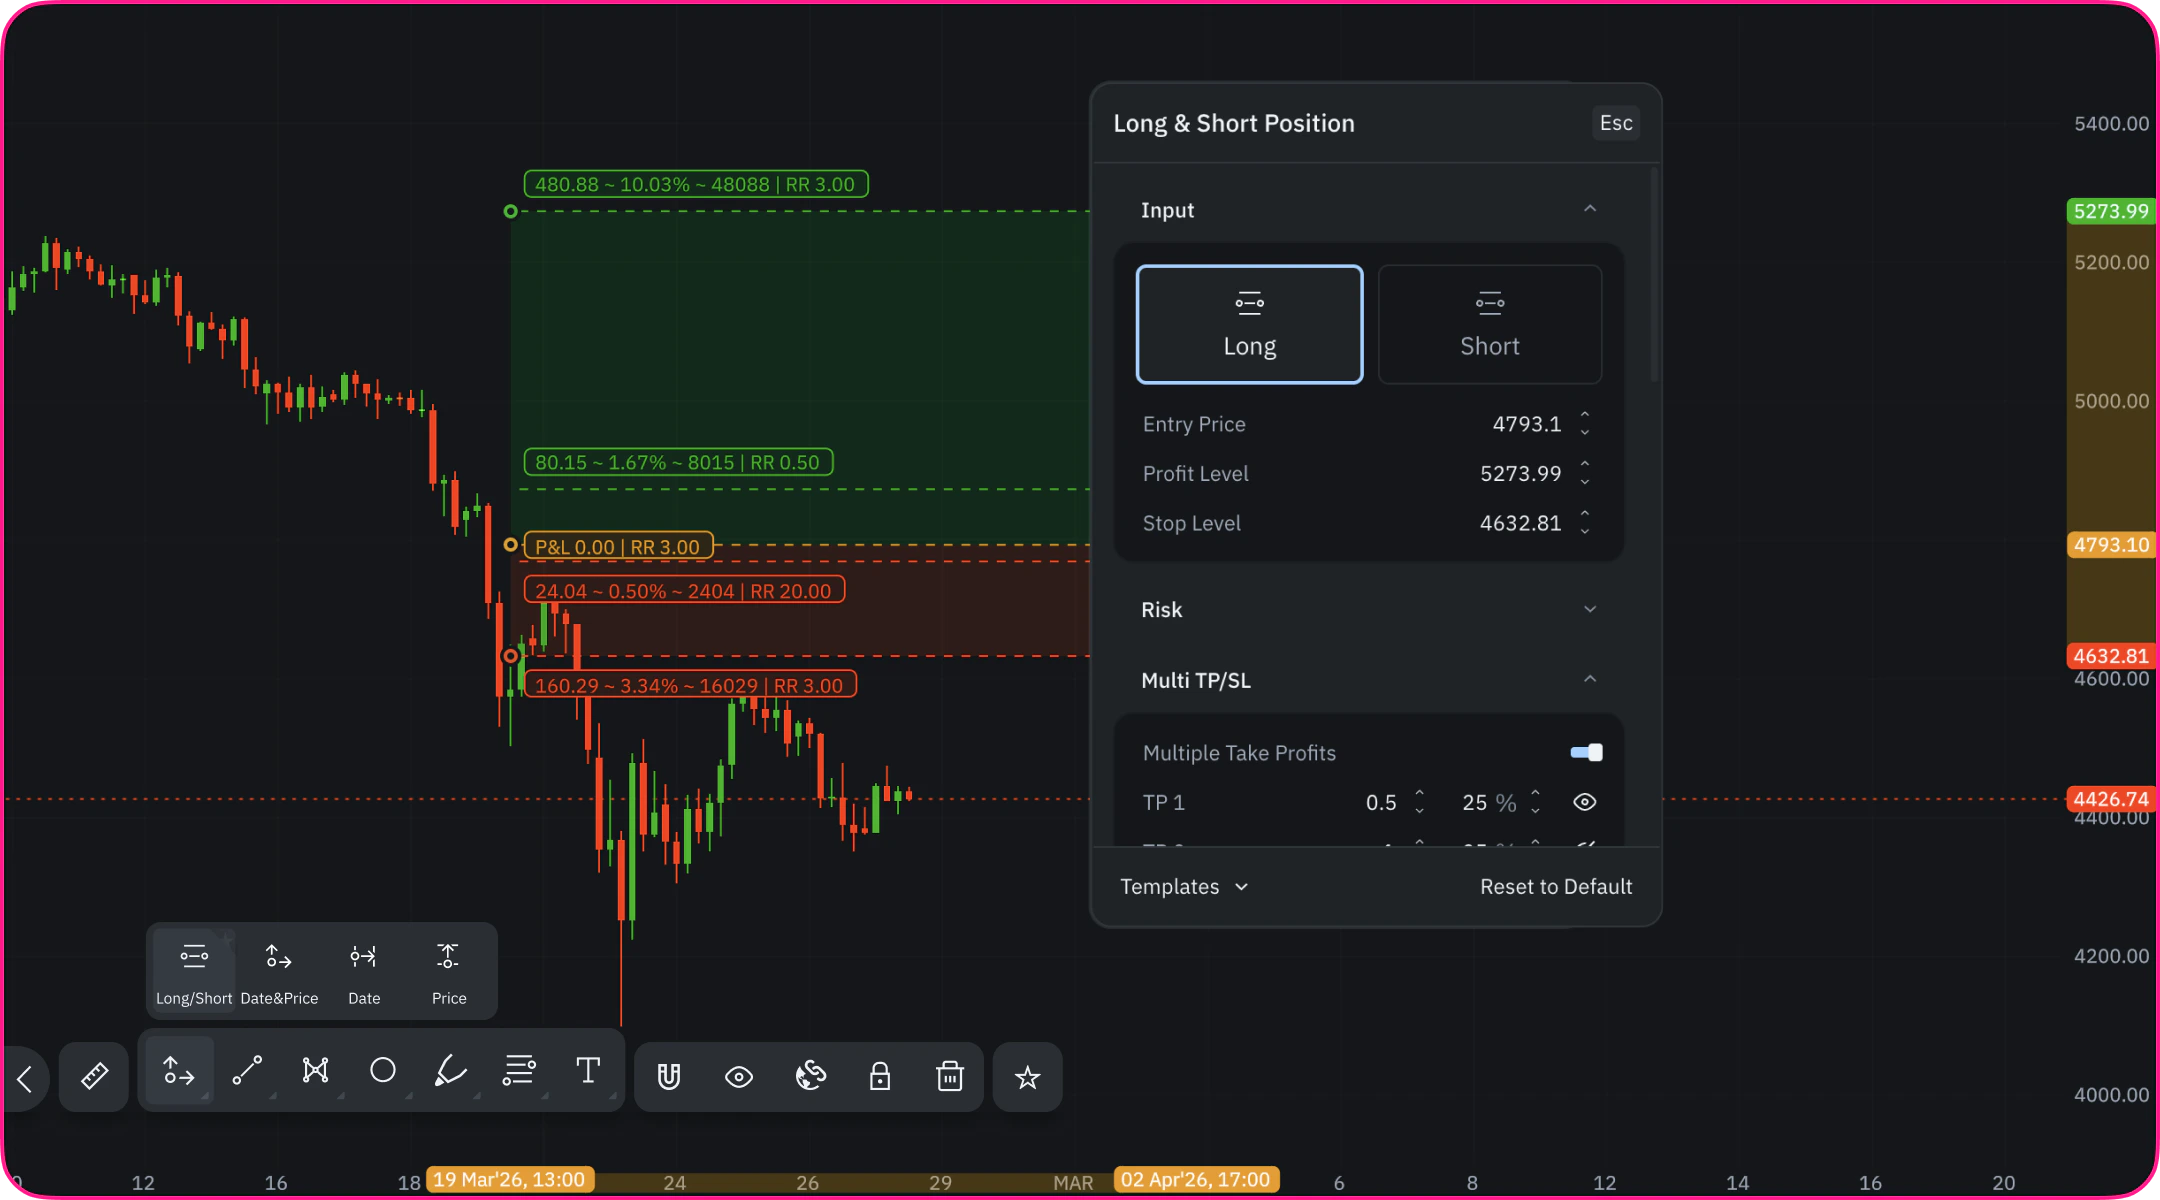
Long-Short Tool (Alt + L)
Visualize trade scenarios and evaluate risk/reward — now with support for multiple Take-Profit and Stop-Loss levels.Basic Usage
- Select entry point
- Drag upward for a long, downward for a short
- View dynamic PnL and risk metrics as you move
Key Features
- Visual TP/SL zones on the chart
- Support for multiple TP and SL levels
- Partial position closure calculation
- Floating real-time PnL display
- Risk Ratio visualization
Risk & Sizing Settings
- Account-based sizing: Configure position size based on account size and risk percentage
- Multi-level exits: Set specific prices and volumes for each take-profit or stop-loss step
- Live feedback: Changes instantly reflected on chart
Risk Ratio Modes
-
Fixed Mode
- Lock a ratio like 2:1 or 3:1
- Prevent accidental edits
- Ideal for strict risk frameworks
-
Flexible Mode
- Freely adjust ratio directly on chart
- Fine-tune values in the settings panel
- Recalculate instantly based on market move
Long-Short Tool Customization
- Set custom colors for entries, exits, and zones
- Adjust markers per TP/SL level
- Save setups as templates for reuse
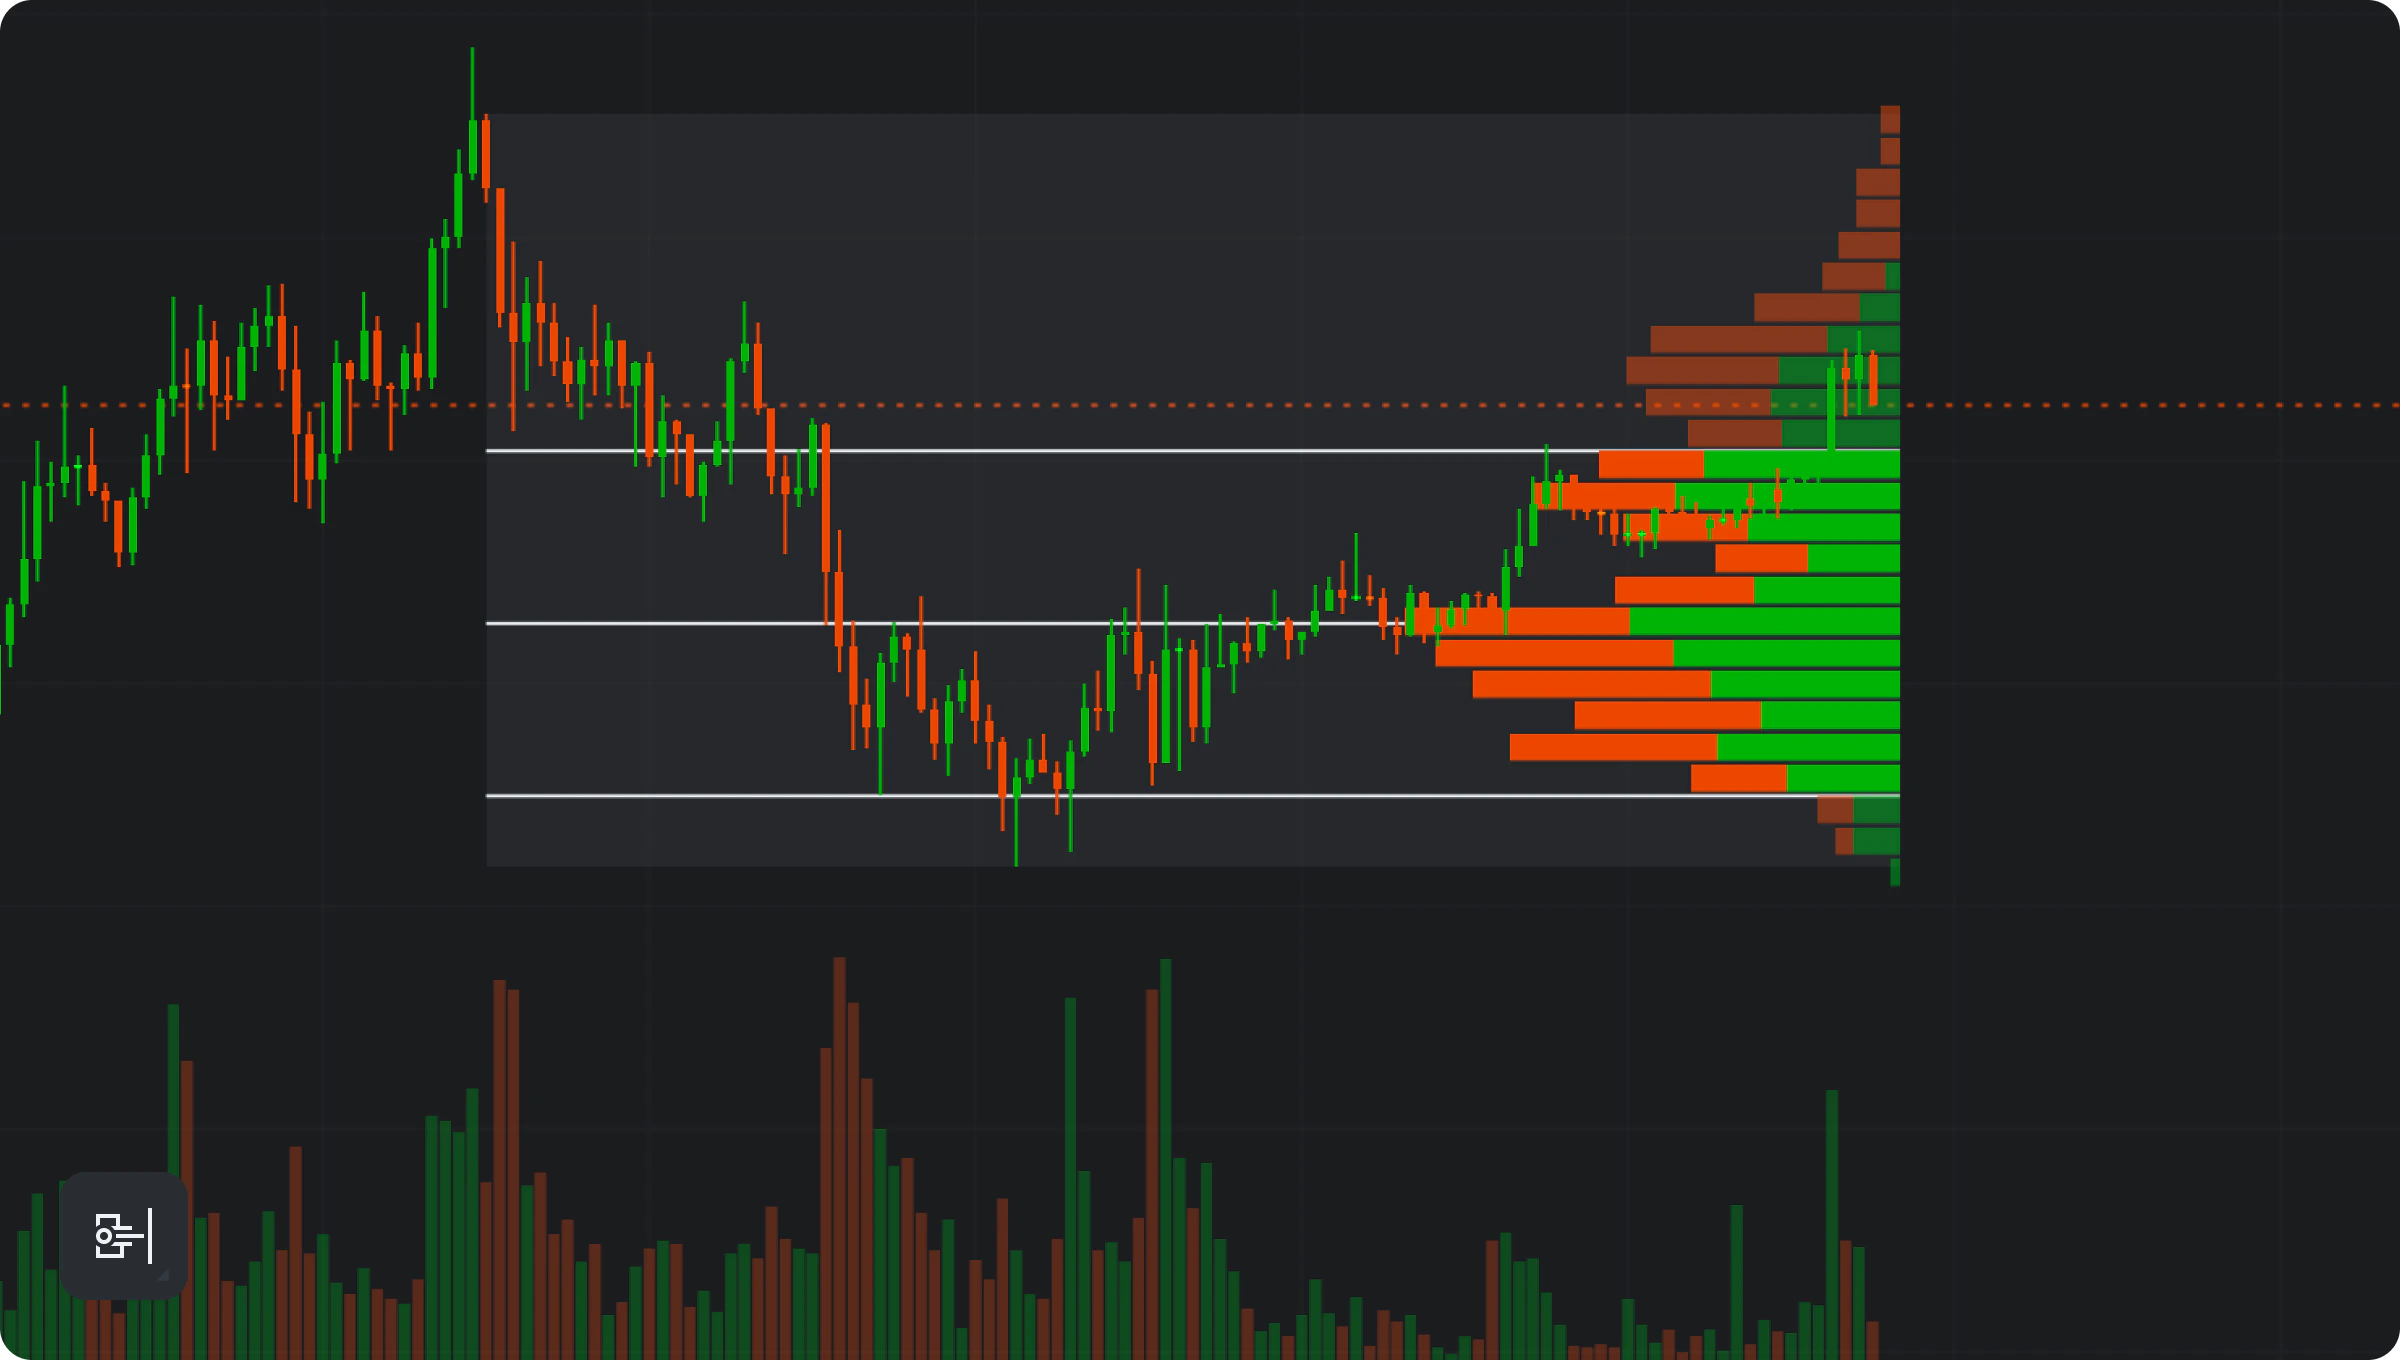
Fixed Range Volume Profile
Fixed Range Volume Profile has just been released. Some behavior may change, and bugs are possible. If you notice an issue, please report it in our Discord or email us at support@takeprofit.com.
What Fixed Range Volume Profile Shows
The tool calculates volume only inside the range you select on the chart. It displays:- Volume histogram — horizontal bars showing traded volume at each price level
- Up volume — volume associated with upward price movement
- Down volume — volume associated with downward price movement
- Point of Control (POC) — the price level with the highest traded volume in the selected range
- Value Area High (VAH) — the upper boundary of the main value area
- Value Area Low (VAL) — the lower boundary of the main value area
- Selected range background — the area used for the volume profile calculation
How to Add Fixed Range Volume Profile
- Open a chart.
- Open the Drawing Tools toolbar.
- Select Fixed Range Volume Profile.
- Click the chart to set the start point of the range.
- Move the cursor to the end of the area you want to analyze.
- Click again to place the profile.
How to Read the Profile
The profile is attached to the selected range.- Longer horizontal bars show price levels with higher traded volume.
- Shorter bars show price levels with lower activity.
- The POC highlights the most actively traded price level.
- VAH and VAL mark the upper and lower boundaries of the value area.
- The profile can help identify areas where price previously accepted, rejected, or consolidated.
Common Use Cases
Use Fixed Range Volume Profile to:- Analyze volume inside a trend leg
- Review consolidation zones
- Identify high-volume support or resistance areas
- Compare volume distribution before and after a breakout
- Study where buyers and sellers were most active during a selected move
Adjusting the Range
After placing the tool, you can adjust the selected range directly on the chart.- Drag the range handles to change the start or end point.
- Move the selected area to analyze a different part of the chart.
- Use the settings panel for more precise control.
Style Settings
Open the tool settings to customize how the profile is displayed. Available style options include:- Histogram box — show or hide the selected range background
- Value area up — color for upward volume inside the value area
- Value area down — color for downward volume inside the value area
- Volume up — color for upward volume outside the value area
- Volume down — color for downward volume outside the value area
- Value — show or hide volume values on the profile
- POC — show, hide, or style the Point of Control line
- VAH — show, hide, or style the Value Area High line
- VAL — show, hide, or style the Value Area Low line
- Bar width — adjust the visual width of the profile bars
Coordinates
The Coordinates section allows you to review or adjust the selected range more precisely. It includes:- From — the start date of the selected range
- To — the end date of the selected range
Templates
You can save your preferred Fixed Range Volume Profile appearance as a template. Templates are useful when you want to reuse the same:- Colors
- POC / VAH / VAL visibility
- Histogram display style
- Bar width
Practical Tips
- Use the tool on clearly defined market structures, such as impulses, pullbacks, ranges, or breakout zones.
- Compare the POC with visible support and resistance levels.
- Watch how price reacts when it returns to VAH, VAL, or the POC.
- Use higher timeframes for broader structure and lower timeframes for execution details.
- Combine the profile with price action, trendlines, and other drawing tools for context.
Customization Options
All measurement tools share these settings:- Line properties:
- Color selection
- Line style (solid, dashed, dotted)
- Line thickness
- Background color
- Template saving
- Drawing sync
- Lock option to prevent accidental changes