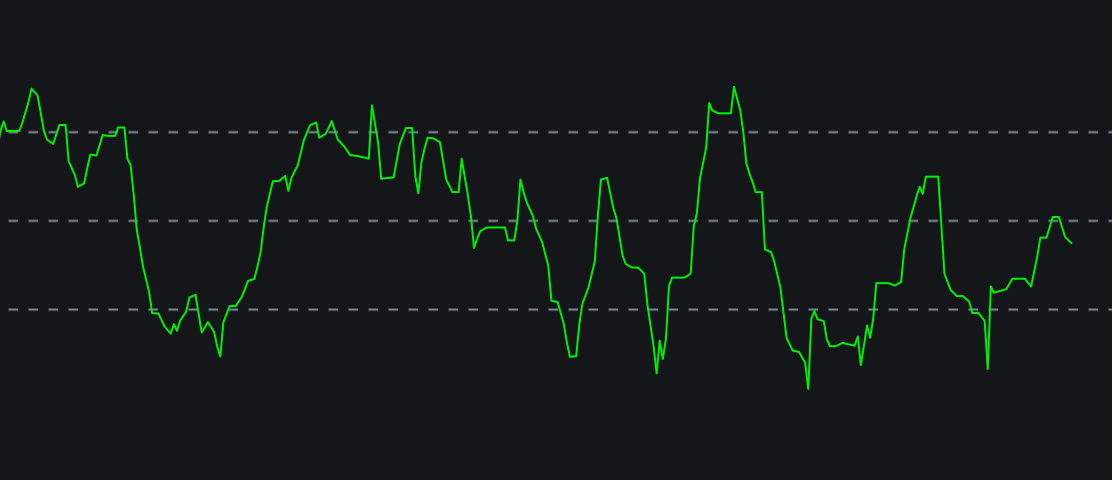
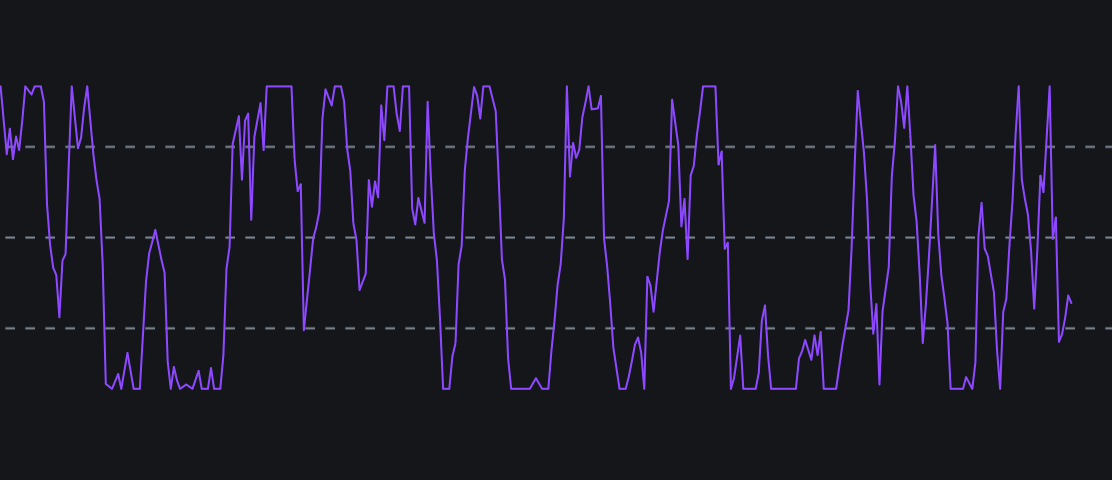
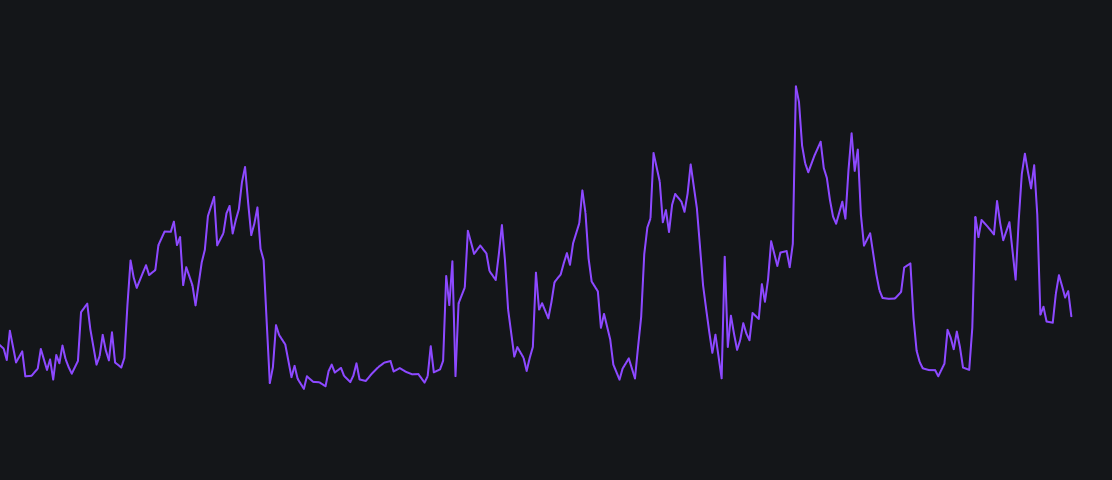
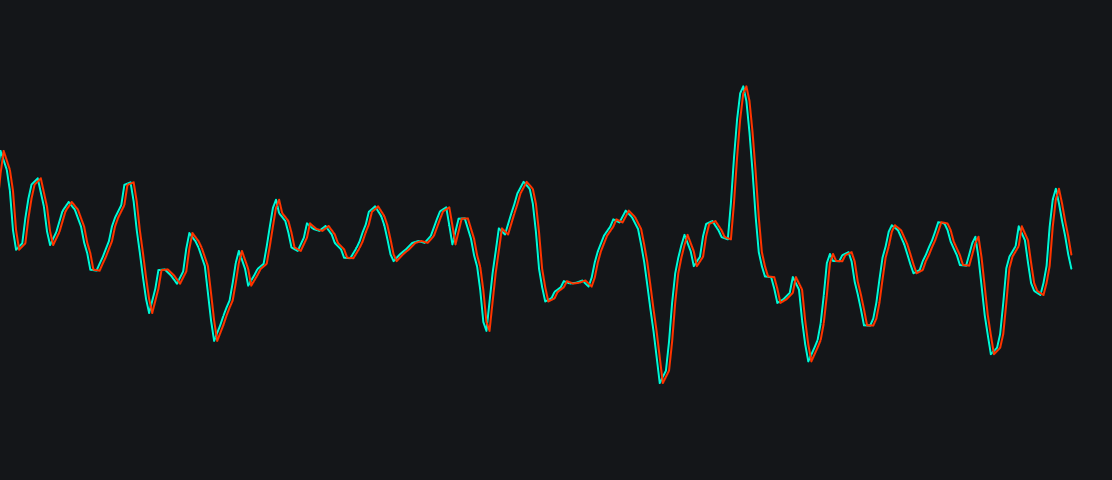
Platform Promo Image
Alerts Promo Image

Community-Driven Trading Platform

Flexible Workspaces, Advanced Charting, Custom Indicators, Cloud Alerts, Screeners, and Financials

Dive In
Community Screeners image

Community Screeners

Undervalued Stocksimage
current ratio (fy) 1.5 to 2
roe (fy) ≥ 15%
p / e 12 to 20
Screener
One more variation of screener with undervalued stocks
Undervalued Stocks
undervalued-stocks-33
High-Growth Companies with Strong Fundamentalsimage
roe (mrq) ≥ 12%
current ratio (mrq) ≥ 1
p / b (ttm) ≤ 4
dividend yield ≤ 4%
debt / equity (mrq) ≤ 1.5
operating cash flow ≥ 0
revenue ≥ 15%
Screener
Screen for rapidly growing companies (15%+ revenue growth) with healthy financials and reasonable valuations.
High-Growth Companies with Strong Fundamentals
high-growth-companies-with-strong-fundamentals-57
Peter Lynch Growth at Fair Priceimage
eps basic (cagr 5y) 15% to 30%
roe (mrq) ≥ 15%
current ratio ≥ 1
debt / equity ≤ 0.6
p / e ≤ 15
net margin ≥ 10%
Screener
A variation of Lynch's strategy focusing on profitable growing companies with strong financials.
Peter Lynch Growth at Fair Price
peter-lynch-growth-at-fair-price-80
Dividend-Paying Companiesimage
dividends per share ≥ 0.1
Screener
Explore our heatmap view - usually a standalone feature, but at TakeProfit.com, it’s built right into your screener!
Dividend-Paying Companies
dividend-paying-companies-21
Community Indicators image

Community Indicators

Elder's Force Index (FI) image
Indicator
The  Force Index (FI)  is a technical analysis indicator that combines price movement and volume to assess the strength of buying or selling pressure in a financial instrument. Below is a structured breakdown of its use, effectiveness, and algorithm: Use…
Elder's Force Index (FI)
/indicator/elder-s-force-index-fi-79
Bollinger Band Touch Marker image
Indicator
Bollinger Band Touch Marker  This is a modified Bollinger Band indicator which changes color when the bands are touched or broken.  Settings: Source Periode Multiplikator
Bollinger Band Touch Marker
/indicator/bollinger-band-touch-marker-6
Ultimate MA - MultiTF image
Indicator
This all-in-one moving average indicator combines all essential moving average types and advanced features into one tool, making it the only moving average indicator you'll ever need. This solution eliminates the need to switch between multiple indicator…
Ultimate MA - MultiTF
/indicator/ultimate-ma-multitf-10
Simple Crossover Signal Bars for Visual Backtesting image
Indicator
Adjustable Moving Averages  Bars for Visual Backtesting You can use it in conjunction with the simple bands indicator to create a template. You need to add both indicators to your workspace or channel. Check it out below to see how it relieves eye stra…
Simple Crossover Signal Bars for Visual Backtesting
/indicator/simple-crossover-signal-bars-for-visual-backtesting-16
Simple Crossover Band image
Indicator
The Simple Crossover Bands indicator is designed to visually represent the relationship between two customizable moving averages directly on the price chart. When the faster moving average (Fast MA) crosses above the slower moving average (Slow MA), a …
Simple Crossover Band
/indicator/simple-crossover-band-68
Squeeze Momentum image
Indicator
This indicator is an adaptation of John Carter's "TTM Squeeze" volatility indicator, described in chapter 11 of his book Mastering the Trade. Unlike Carter's original method, which uses a simple momentum indicator, this version applies a linear regressio…
Squeeze Momentum
/indicator/squeeze-momentum-75
MACD + Histogram image
Indicator
Boost your Trading Insights with the MACD + Histogram Indicator The MACD + Histogram indicator is your powerful tool for identifying trend shifts and gauging momentum strength in real-time. Combining the MACD Line, Signal Line, and dynamic Histogram, thi…
MACD + Histogram
/indicator/macd-histogram-33
Custom VWAP - usage example of indie.Schedule class image
Indicator
We have recently released an update to Indie language 4.4 , which now includes new types for managing time periods: indie.schedule.ScheduleRule ,  indie.schedule.Schedule  and  indie.TradingSession . The "Custom VWAP" indicator demonstrates the usage o…
Custom VWAP - usage example of indie.Schedule class
/indicator/custom-vwap-usage-example-of-indie-schedule-class-23
Sma-Ema Crossover - usage example of indie.Var[T] image
Indicator
With the recent update to  Indie language 4.3 , we've introduced the  indie.Var[T]  container. This new container type functions similarly to  indie.MutSeries[T] , but it has a single-value history depth, making it ideal for storing and updating the curr…
Sma-Ema Crossover - usage example of indie.Var[T]
/indicator/sma-ema-crossover-usage-example-of-indie-var-t-90
Green/Red Bar Count - usage example of indie.Var[T] image
Indicator
This update of  "Green/Red Bar Counts"  indicator showcases the latest feature in  Indie language 4.3 , the  indie.Var[T]  container. In this implementation: State Tracking : The  indie.Var[T]  container counts consecutive green (up) or red (down) bars w…
Green/Red Bar Count - usage example of indie.Var[T]
/indicator/green-red-bar-count-usage-example-of-indie-var-t-93
ZLEMA image
Indicator
ZLEMA ZLEMA stands for Zero Lag Exponential Moving Average, developed by John Ehlers and Rick Way. Unlike a standard Exponential Moving Average, ZLEMA aims to minimize the inherent lag typically associated with moving averages and other trend-following i…
ZLEMA
/indicator/zlema-14
Volume Flow Indicator image
Indicator
The Volume Flow Indicator (VFI), developed by Markos Katsanos, is based on the popular On Balance Volume (OBV) but features three important enhancements: VFI values provide clear signals: positive readings indicate bullish conditions, while negative read…
Volume Flow Indicator
/indicator/volume-flow-indicator-76
Community Posts image

Community Posts

MOCA in Shopping Area.image
MOCA in Shopping Area.
The market in general, including Crypto, was shaken downwards due to the issue of US tariffs. But at MOCA it gives us the opportunity to continue accumulating at very low prices. This type of news is excellent for making Spot PURCHASES and reducing Risk by staying away from the Futures Market.
MOCA in Shopping Area.
After elections market comment: TSLAimage
After elections market comment: TSLA
Crazy German story: German magazines are currently showing how to get rid of Tesla from globally/US investing ETFs or hedge its upside with a short position corresponding to the Tesla share of the ETF to turn Tesla into a +-0 position. 
After elections market comment: TSLA
INDIAN MARKET
In the dynamic world of the Indian stock market, knowing when to take profits is as crucial as identifying the right stock. Timing is key, and emotions often play a big role. Here’s how you can master this art:
INDIAN MARKET
XRP- good newsimage
XRP- good news
Rippel has now reached the minimum target of an Elliott wave 3. (Fibonacci extension 1.618 Level from wave 1 ) The minimum target was completed by a classic ABCD, which is on its way to a 161 rebound.  Nice Support from 13 Level
XRP- good news
$ALGO looking for a breakoutimage
$ALGO looking for a breakout
With the latest $ALGO Governance round ending this week, the layer one crypto is looking like it will break resistance in the coming weeks.  
$ALGO looking for a breakout
Trump, Bitcoin 92k, XAU ATH O_o
Donald Trump ignited one of the biggest crypto frenzies in history. Since his return to politics, he positioned himself as the ultimate advocate for digital assets, rallying investors and promising to make America the global leader in crypto. From Bitcoin to NFTs, he preached financial revolution—until he stopped.
Trump, Bitcoin 92k, XAU ATH O_o
BTC Trades
The Coin entered the Demand Zone (Marked in Green). It should go up, at least according to Technical Analysis.
BTC Trades
XAUUSD: Maintain Range Trading
✅Yesterday, gold closed with a cross star candlestick. Although it once dropped to a low of 2633, it rebounded and closed above 2645 at the end of the trading day, close to the opening price. The overall trend continued to fluctuate slowly, and the key support level below was near 2605, which was the critical point for the short-term long and short competition. The daily trend shows that gold has not yet broken through the range of fluctuations. The current fluctuation pattern is the main one, and attention should be paid to the driving effect of the Fed's interest rate decision on the market.
XAUUSD: Maintain Range Trading
MOCA SuperTrendimage
MOCA SuperTrend
MOCA remains below the SuperTrend, it is the perfect area for Accumulation and Spot Purchases.
MOCA SuperTrend
Adobeimage
Adobe
In this area there is the option of a new wolf's mouth to approach the 13th retracement of the black swan. The middle line of the trend channel would be a relevant resistance.
Adobe
Understand the best Multi-Timeframe Pattern System (2/2)image
Understand the best Multi-Timeframe Pattern System (2/2)
In the first video, we talked about what Multi-Timeframe Logic is and how we use Clusterzones to generate protectable, high CRV entries. This video is more about how the different timeframes are interconnected with each other and how you can use that to your advantage in your trading. 
Understand the best Multi-Timeframe Pattern System (2/2)
Crypto Trading Tips
1. Create a Personal Trading Journal: Keep track of all your trades, strategies, and market observations. This will help you learn from your successes and mistakes.
Crypto Trading Tips
MOCA in Shopping Area.image
MOCA in Shopping Area.
The market in general, including Crypto, was shaken downwards due to the issue of US tariffs. But at MOCA it gives us the opportunity to continue accumulating at very low prices. This type of news is excellent for making Spot PURCHASES and reducing Risk by staying away from the Futures Market.
MOCA in Shopping Area.
Trump, Bitcoin 92k, XAU ATH O_o
Donald Trump ignited one of the biggest crypto frenzies in history. Since his return to politics, he positioned himself as the ultimate advocate for digital assets, rallying investors and promising to make America the global leader in crypto. From Bitcoin to NFTs, he preached financial revolution—until he stopped.
Trump, Bitcoin 92k, XAU ATH O_o
MOCA SuperTrendimage
MOCA SuperTrend
MOCA remains below the SuperTrend, it is the perfect area for Accumulation and Spot Purchases.
MOCA SuperTrend
After elections market comment: TSLAimage
After elections market comment: TSLA
Crazy German story: German magazines are currently showing how to get rid of Tesla from globally/US investing ETFs or hedge its upside with a short position corresponding to the Tesla share of the ETF to turn Tesla into a +-0 position. 
After elections market comment: TSLA
Adobeimage
Adobe
In this area there is the option of a new wolf's mouth to approach the 13th retracement of the black swan. The middle line of the trend channel would be a relevant resistance.
Adobe
INDIAN MARKET
In the dynamic world of the Indian stock market, knowing when to take profits is as crucial as identifying the right stock. Timing is key, and emotions often play a big role. Here’s how you can master this art:
INDIAN MARKET
Understand the best Multi-Timeframe Pattern System (2/2)image
Understand the best Multi-Timeframe Pattern System (2/2)
In the first video, we talked about what Multi-Timeframe Logic is and how we use Clusterzones to generate protectable, high CRV entries. This video is more about how the different timeframes are interconnected with each other and how you can use that to your advantage in your trading. 
Understand the best Multi-Timeframe Pattern System (2/2)
XRP- good newsimage
XRP- good news
Rippel has now reached the minimum target of an Elliott wave 3. (Fibonacci extension 1.618 Level from wave 1 ) The minimum target was completed by a classic ABCD, which is on its way to a 161 rebound.  Nice Support from 13 Level
XRP- good news
Crypto Trading Tips
1. Create a Personal Trading Journal: Keep track of all your trades, strategies, and market observations. This will help you learn from your successes and mistakes.
Crypto Trading Tips
BTC Trades
The Coin entered the Demand Zone (Marked in Green). It should go up, at least according to Technical Analysis.
BTC Trades
$ALGO looking for a breakoutimage
$ALGO looking for a breakout
With the latest $ALGO Governance round ending this week, the layer one crypto is looking like it will break resistance in the coming weeks.  
$ALGO looking for a breakout
XAUUSD: Maintain Range Trading
✅Yesterday, gold closed with a cross star candlestick. Although it once dropped to a low of 2633, it rebounded and closed above 2645 at the end of the trading day, close to the opening price. The overall trend continued to fluctuate slowly, and the key support level below was near 2605, which was the critical point for the short-term long and short competition. The daily trend shows that gold has not yet broken through the range of fluctuations. The current fluctuation pattern is the main one, and attention should be paid to the driving effect of the Fed's interest rate decision on the market.
XAUUSD: Maintain Range Trading