Community Indicators

Community Indicators

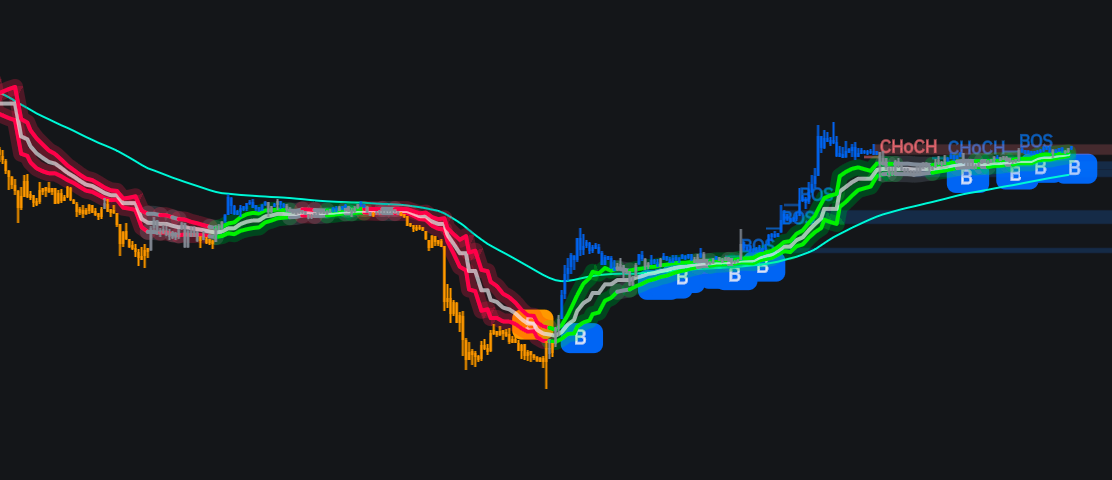
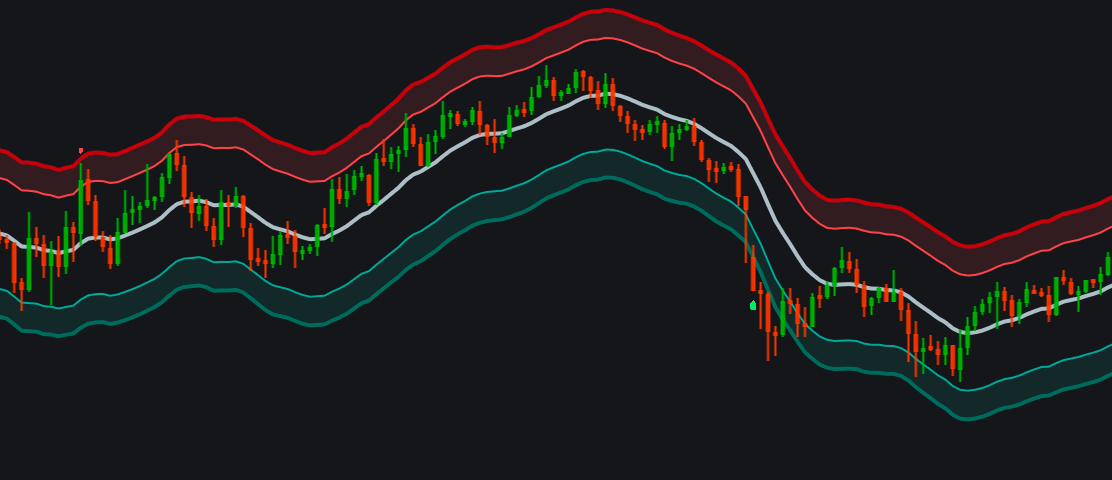
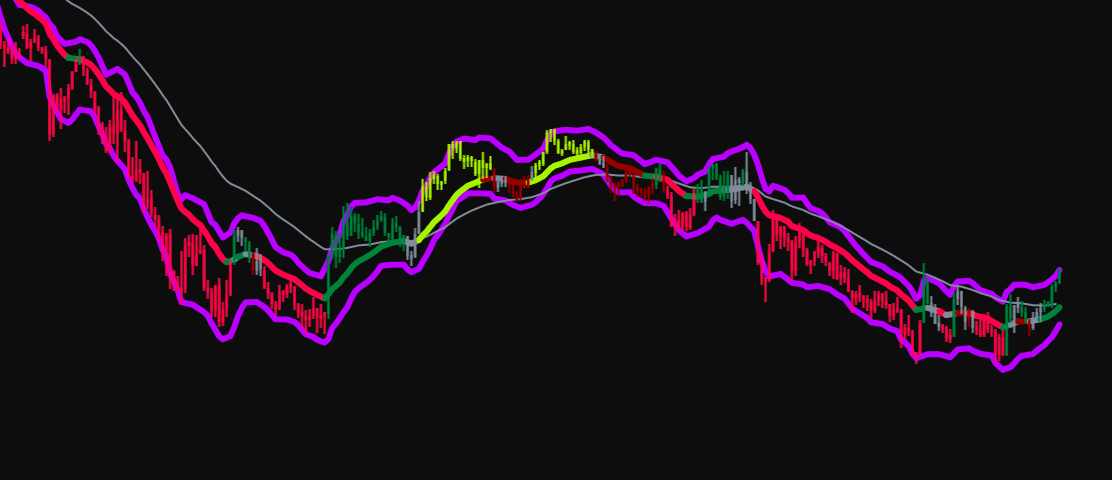
Trend Clapper V2 (@encryption)image
Trend Clapper V2 (@encryption)
Less clutter. Clearer signals. Smarter trading decisions. Trend Clapper V2 is my personal trading indicator, built around one simple philosophy: "The simpler the setup, the clearer the signal." Instead of overwhelming your chart with unnecessary informat…
/indicator/trend-clapper-v2-encryption-0
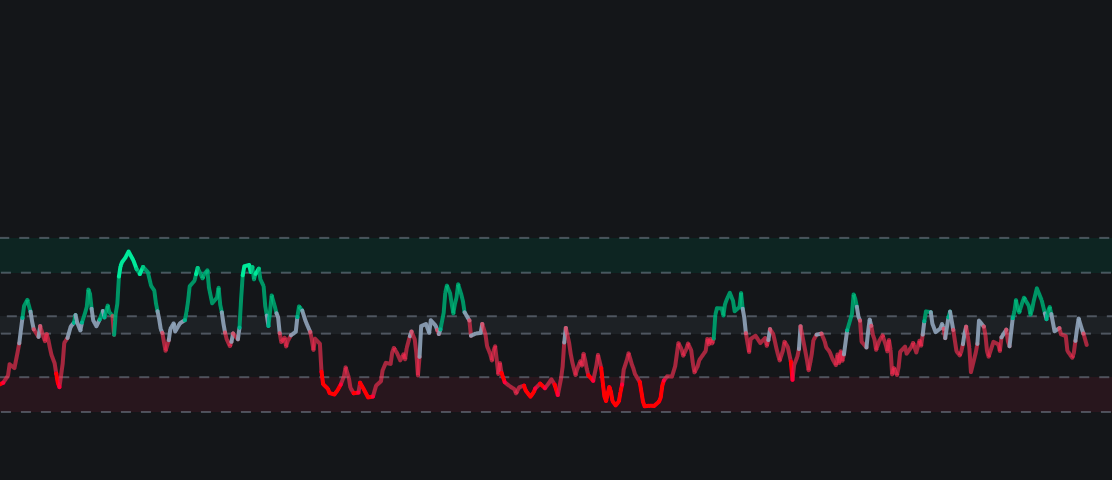
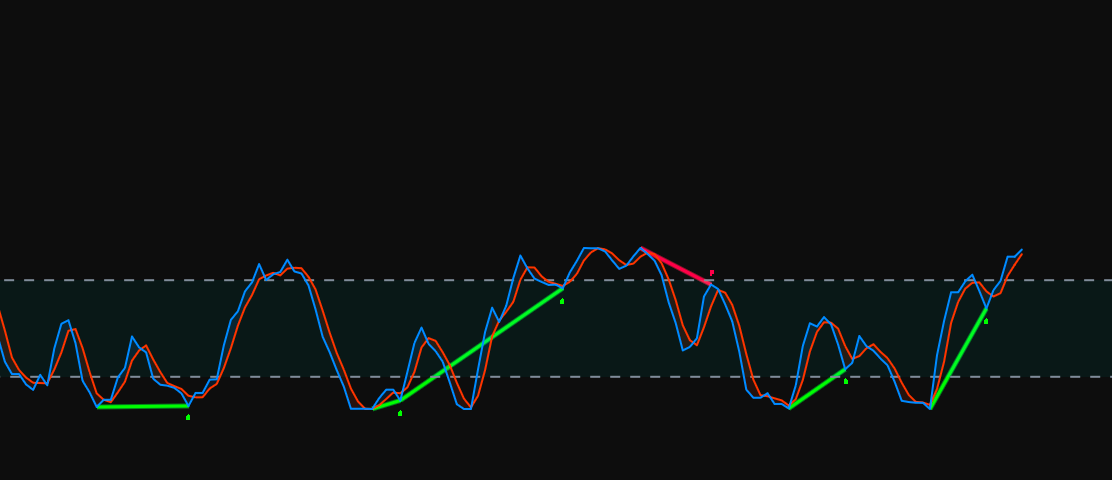
Stochastic RSI With Divergences (@encryption)image
Stochastic RSI With Divergences (@encryption)
This indicator to combine a Stochastic RSI oscillator with divergence detection, so you can spot potential trend reversals early instead of just watching momentum. It plots a K line and a D line, highlights overbought/oversold zones, and marks regular an…
/indicator/stochastic-rsi-with-divergences-encryption-40
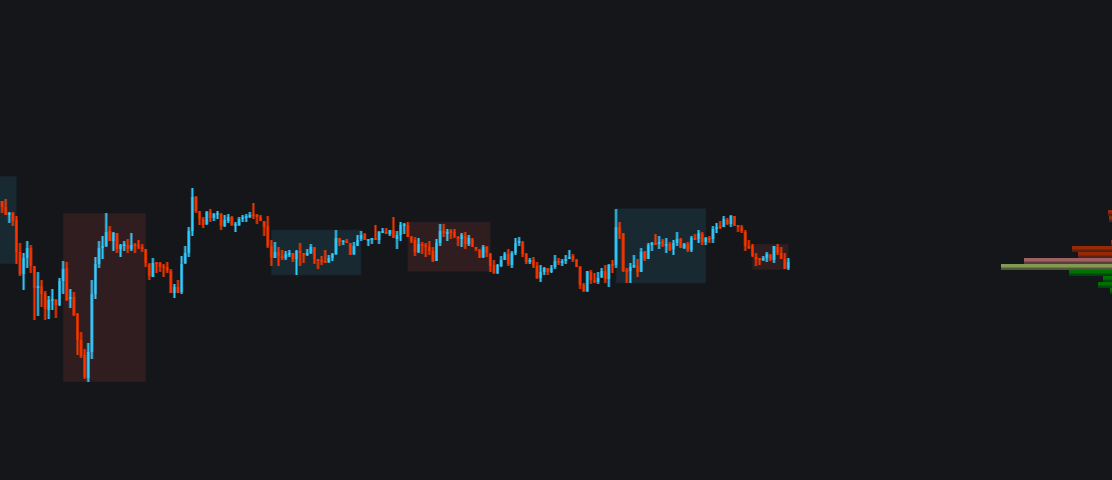
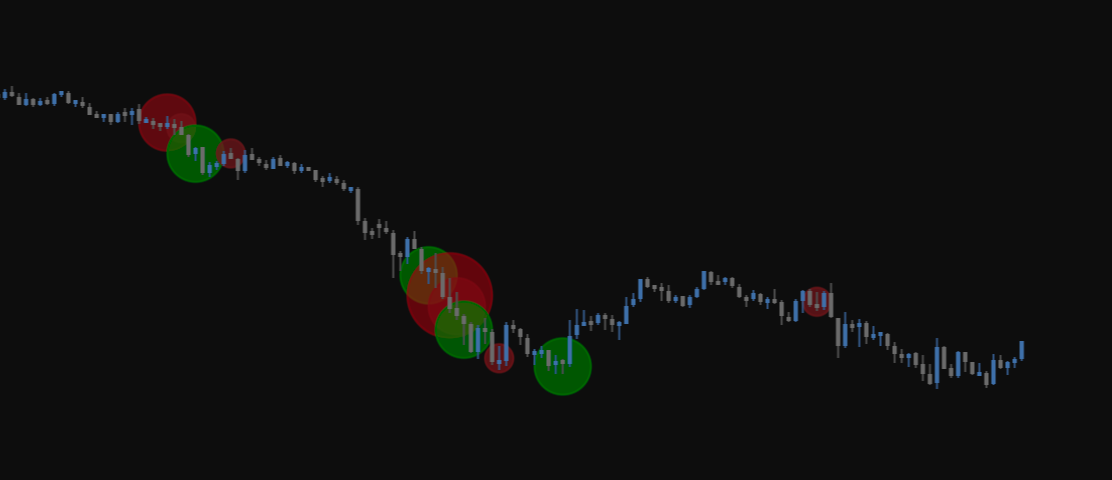
Absorption Bubbles (@encryption)image
Absorption Bubbles (@encryption)
Absorption Bubbles indicator for TakeProfit. I created it to spot when one side tried to push price further and got absorbed, so you can see rejection happening on a candle instead of just how much volume traded. How it works Standard volume shows one ba…
/indicator/absorption-bubbles-encryption-0
CDAI Smart Scalper Proimage
CDAI Smart Scalper Pro
CDAI Smart Scalper Pro SPMA Trend Analysis • Smart Money Concepts • Clear BUY/SELL Signals CDAI Smart Scalper Pro is a technical analysis indicator designed to help active traders identify directional market conditions, confirmed SPMA gap setups, and pot…
/indicator/cdai-smart-scalper-pro-18
MTF MTG Zones - higher-timeframe mitigation zonesimage
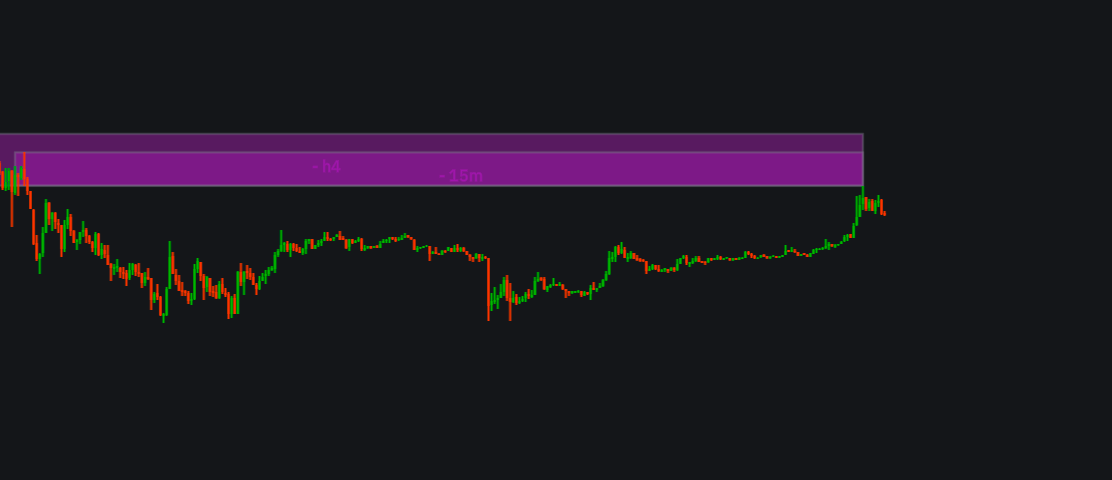
MTF MTG Zones - higher-timeframe mitigation zones
What it shows MTG zones (mitigation zones, a type of order block) from up to four higher timeframes: 15m, 1H and 4H by default, with 1D optional. A bullish zone ( + h1 ) is the last down candle before a strong move up that left a gap. A bearish zone
/indicator/mtf-mtg-zones-higher-timeframe-mitigation-zones-48
My Scriptimage
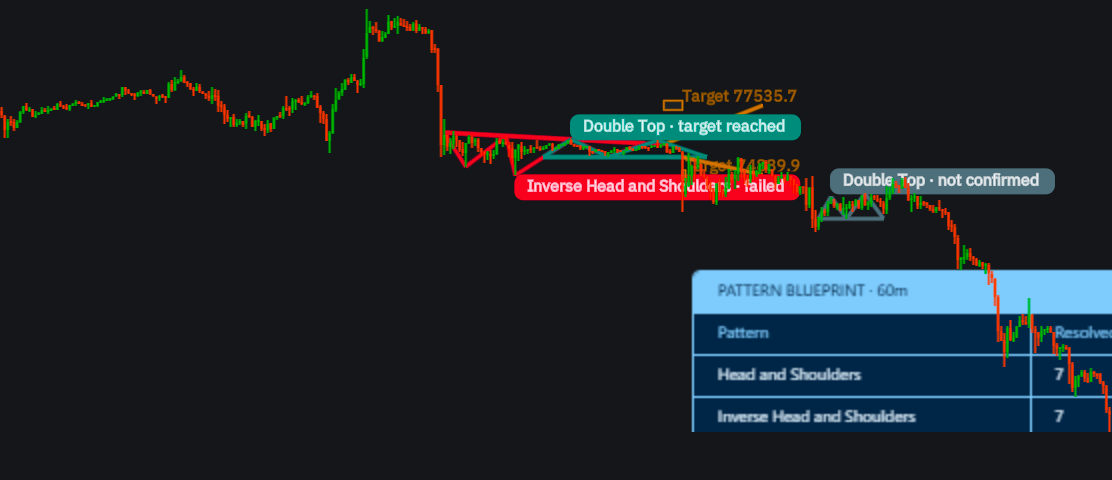
My Script
What it does  Patterns: Head & shoulders and inverse head & shoulders, with checks on shoulder symmetry, neckline tilt and the lead-in swing. Double top and double bottom, where the two tops must be within 15% of the pattern height of each other. Every…
/indicator/my-script-65
My Script(1)image
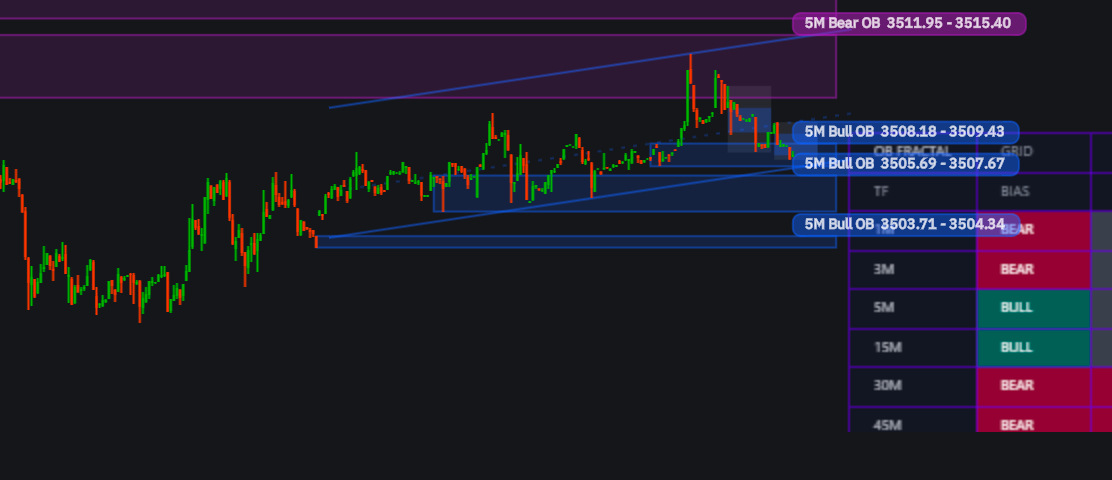
My Script(1)
What it shows: Bias dashboard (bottom right): one row each for 1M, 3M, 5M, 15M, 30M, 45M, 1H, 4H and D, with BIAS and SIGNAL columns, plus a purple ALL TF row. BIAS follows the direction of the last time a candle on that timeframe closed beyond its…
/indicator/my-script-1-88
ORB looping by Eka Ryan_ACG (Free Limited Time)image
ORB looping by Eka Ryan_ACG (Free Limited Time)
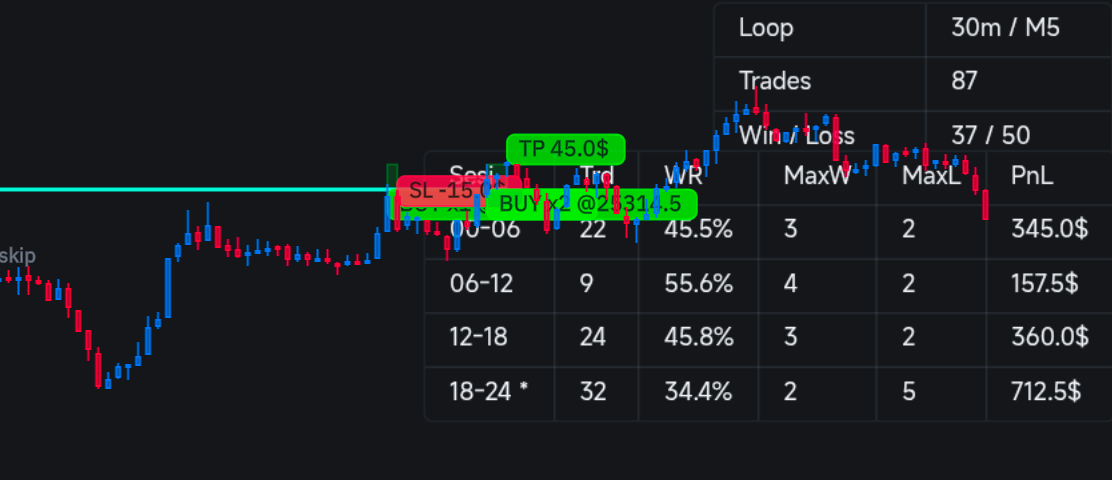
YRRA (Yang Rungkd Rungkad Aja) Strategy OBR dengan sistem revenge trading martingle, menjaga equity tetap positif dan memaksa equity tetap positif, tapi beresiko di market sideways berkepanjangan maka semakin banyak entry gagal maka margin semakin banyak…
/indicator/orb-looping-by-eka-ryan-acg-free-limited-time-62
ORB looping by Eka Ryan_ACGimage
ORB looping by Eka Ryan_ACG
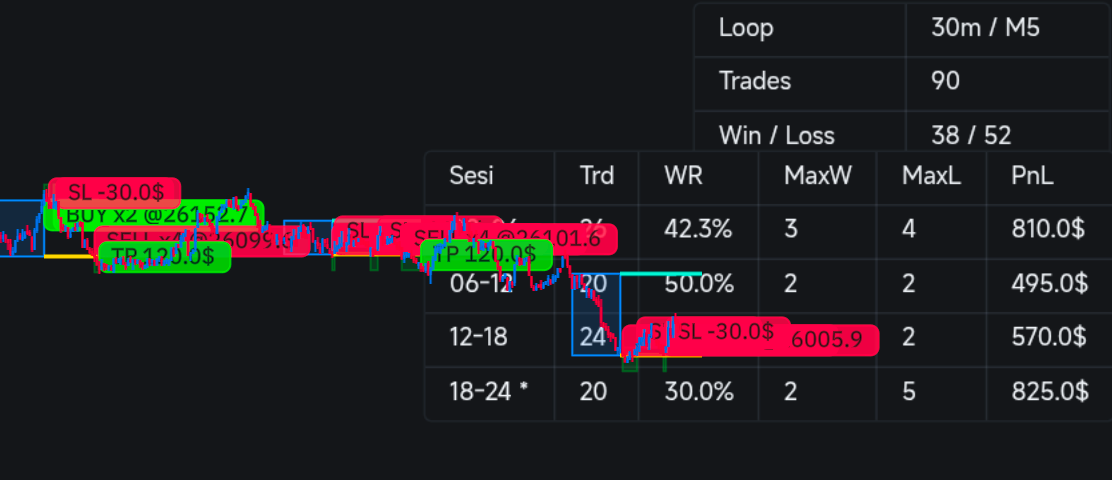
Strategy ORB for trading futures NQ. Optimise parameter. SL 30 Tick TP 60 Tick QTY Start 2 Indonesian Language Good for propfirm trader.
/indicator/orb-looping-by-eka-ryan-acg-20
TradingCOP BIAS Confirmation - V3.094image
TradingCOP BIAS Confirmation - V3.094
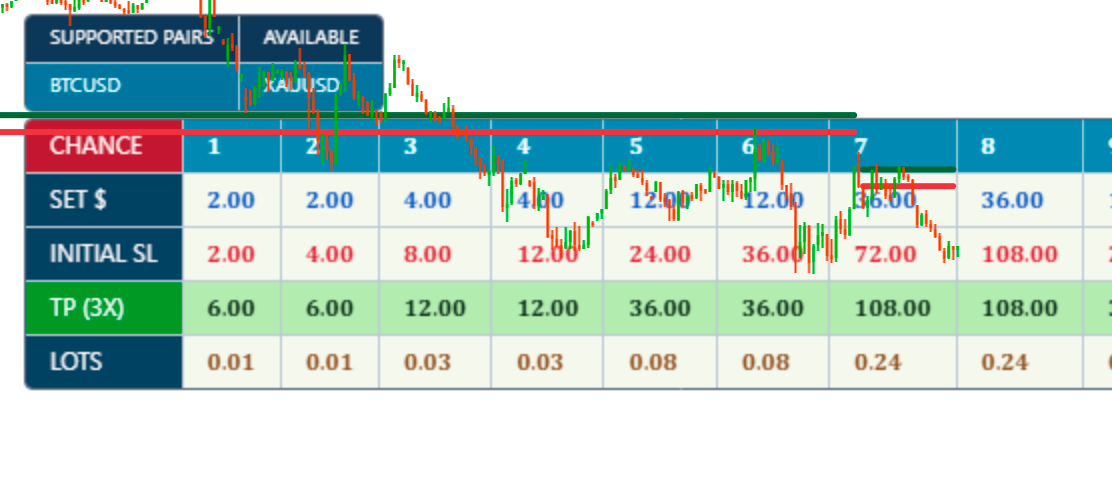
TradingCOP BIAS Confirmation - V3.094 TradingCOP BIAS Confirmation displays daily Swing levels, manually configured SD levels, and a recovery planning table in one chart overlay. Swing levels The indicator uses the daily M5 candle that opens at 05:00 UT…
/indicator/tradingcop-bias-confirmation-v3-094-60
Trading Sessionsimage
Trading Sessions
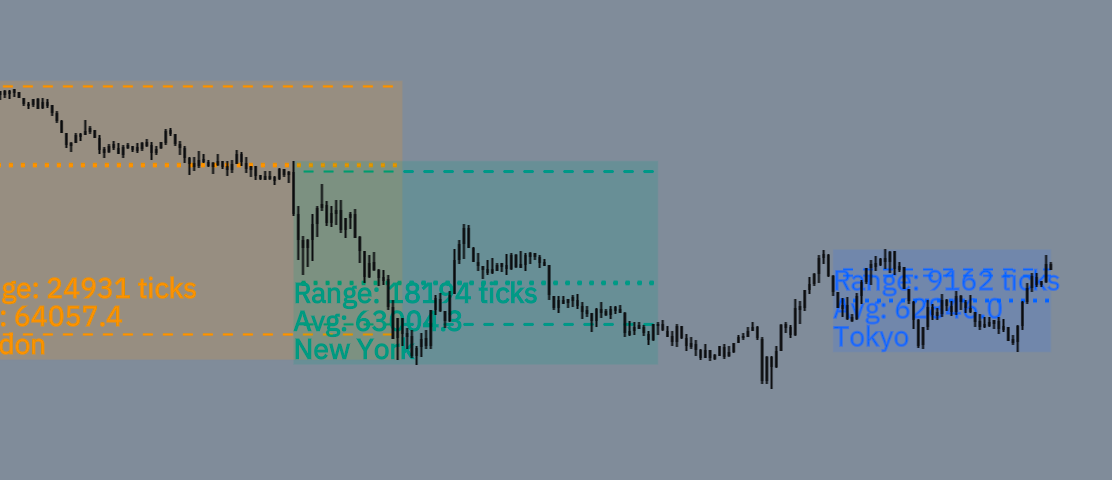
The Trading Sessions indicator provides a  visual representation of three major global financial trading sessions : Tokyo, London, and New York. It automatically identifies each session using its respective local timezone, accounting for daylight saving …
/indicator/trading-sessions-43
Smart Channel [METIS]image
Smart Channel [METIS]
Smart Channel [METIS] Adaptive smart channel around the price, with signals at the boundaries The indicator plots a central line and two boundary levels above and below it: inner and outer. When the price breaks through a boundary, a triangle signal appe…
/indicator/smart-channel-metis-80
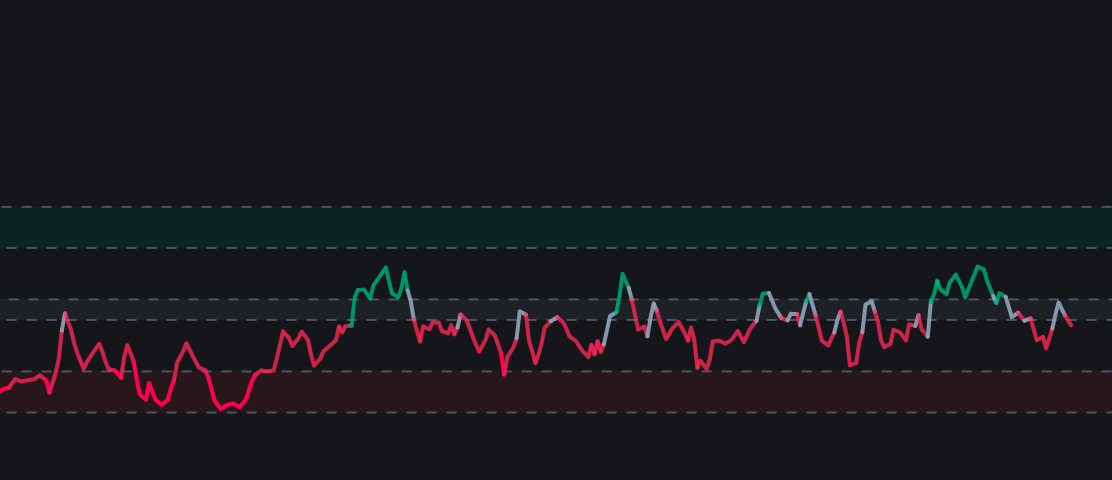
Pressure X image
Pressure X
PRESSURE X — Multi-Factor Market Pressure OscillatorPRESSURE X is a custom confluence-based technical indicator designed to visualize bullish and bearish market pressure through a single oscillator. Key features 0–100 pressure scale. Dynamic bullish an…
/indicator/pressure-x-24
Pressure X image
Pressure X
PRESSURE X — Multi-Factor Market Pressure OscillatorPRESSURE X is a custom confluence-based technical indicator designed to visualize bullish and bearish market pressure through a single oscillator. Key features 0–100 pressure scale. Dynamic bullish an…
/indicator/pressure-x-92
Two Trading Sessionsimage
Two Trading Sessions
# indie:lang_version = 5 from indie import indicator, MainContext, TimeFrame, time_frame_unit from indie import color, param from indie.color import rgba from indie.schedule import ScheduleRule, Schedule, ALL_DAYS from indie.drawings import Rectangle, Ab…
/indicator/two-trading-sessions-30