Fills
The area between any two plots can be filled with a color (often semi-transparent). To use this feature there is a@plot.fill decorator and a plot.Fill class.
In the first place the @plot.fill decorator declares which two plots should be used for filling. Optionally
it may have a color argument, which should be used if a single-colored fill is desired.
Single-colored fill
The simplest possible use case fills the space between two plot lines: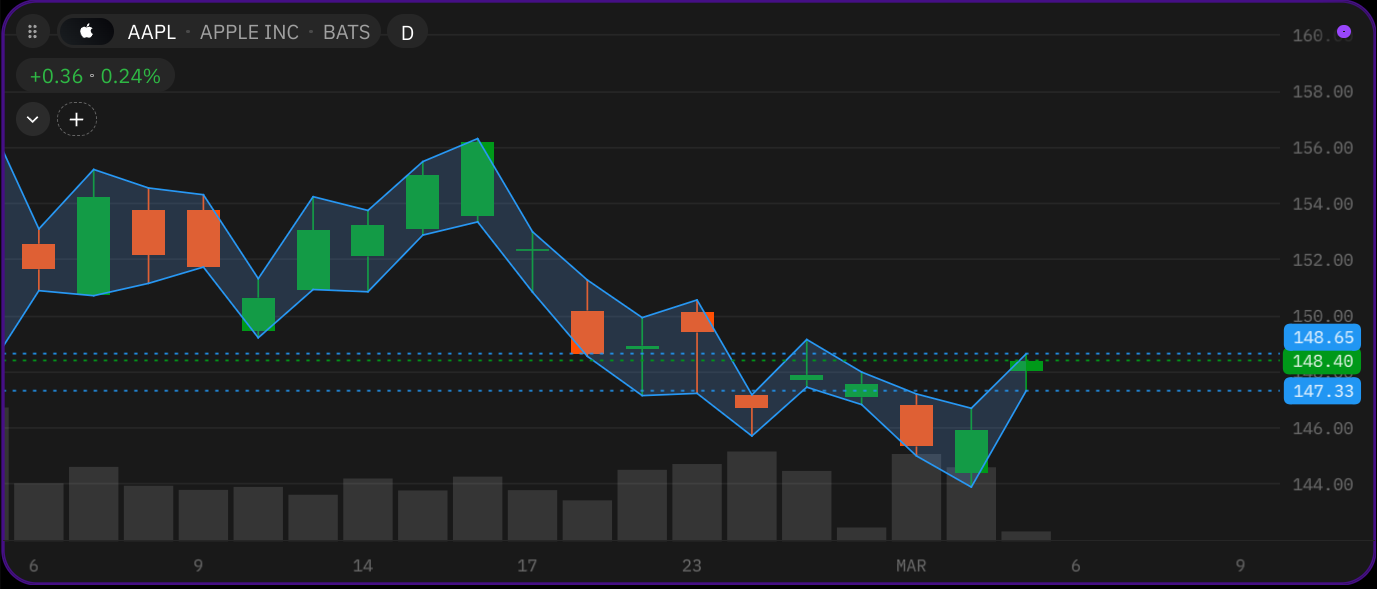
@plot.fill decorator and plot.Fill object always must be used together. Even in simple cases of a
single-colored fill where the plot.Fill object is constructed with all default values (i.e. with no arguments plot.Fill()).
This is because @plot.fill occupies one output slot in the return tuple, the same way @plot.line or @plot.marker do.
Unlike @level and @band, which are purely static decorators and require no return value, each @plot.fill must have
a corresponding plot.Fill() in the return. This also means that plot.Fill(color=c) can override the static color
from the decorator per bar, as shown in the “Multicolored fill” section below.
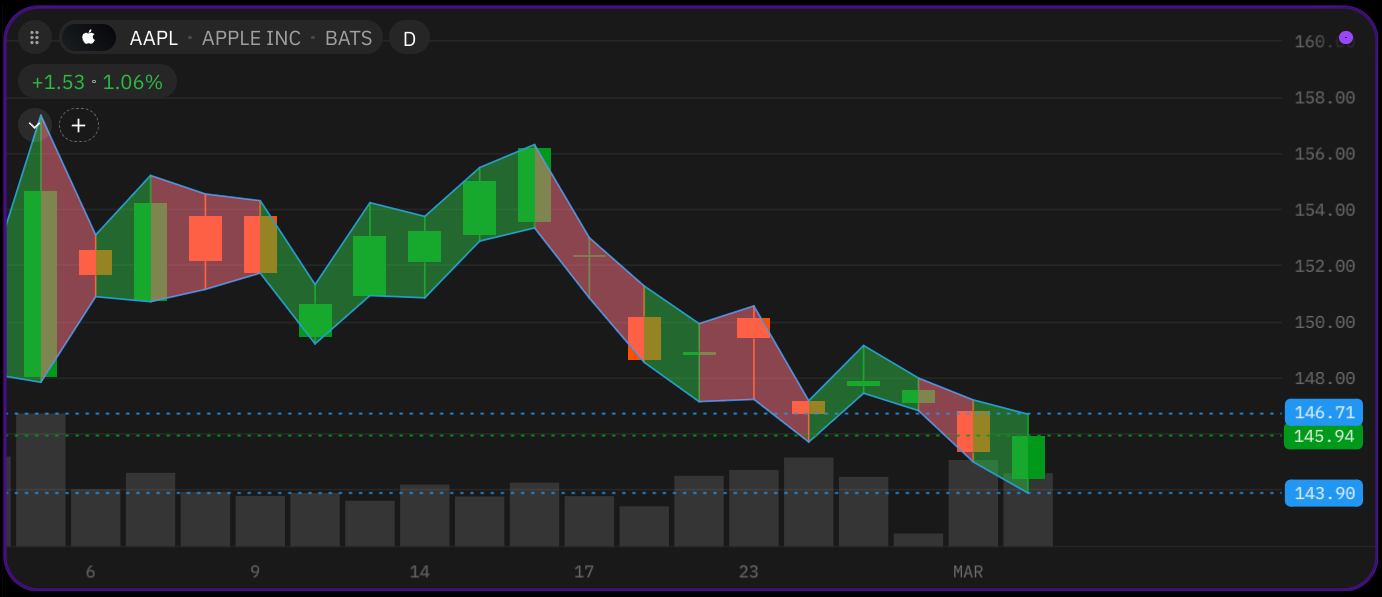
Multicolored fill
If a multicolored fill is needed, then the color value should be calculated in theMain function code and passed as
argument to a plot.Fill object returned by the Main function.
Multicolored fill with an offset
plot.Fill() has an optional parameter offset: int. It may be used to shift the coloring to the left (if offset is
negative) or to the right (if offset is positive):
offset only affects multi-color fills and has no effect on single-color ones.
Fill combined with markers
When using@plot.fill alongside @plot.marker, each decorator needs its own return value.
Count all @plot.* decorators — the return tuple must have the same number of items.
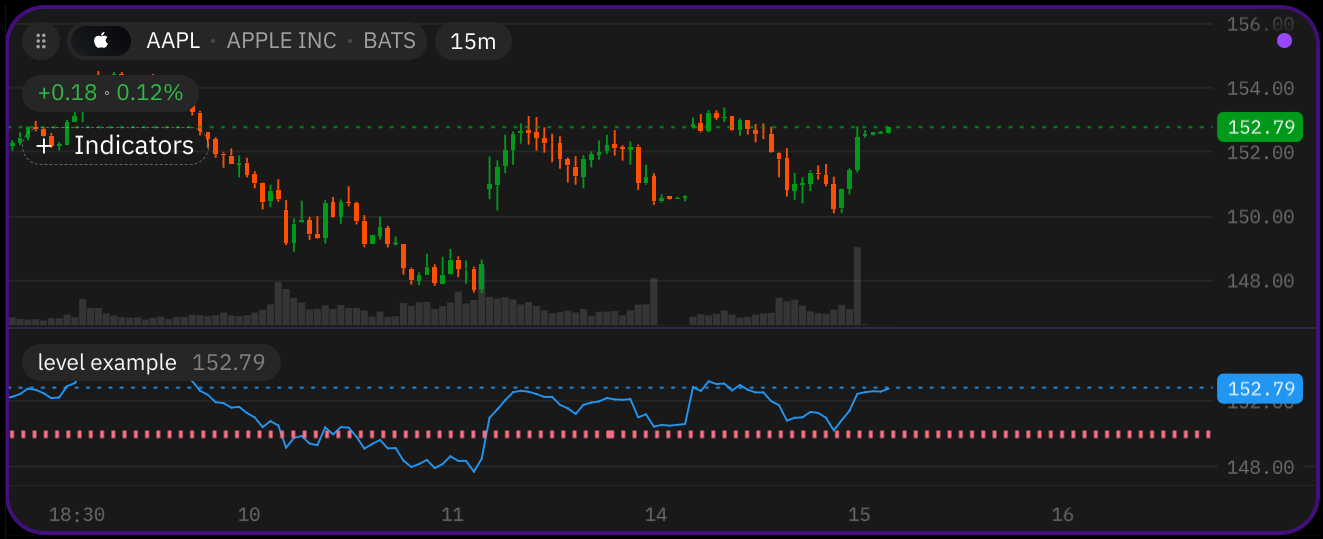
Levels
@level() decorator creates a level (horizontal line).
value— Value of the level on the indicator’s vertical scaletitle— Human-readable title which is visible in the indicator’s Settings panel.line_color— Color of the line.line_style— Style of the line. It is represented as enum value of typeline_style.line_width— Width of the line.
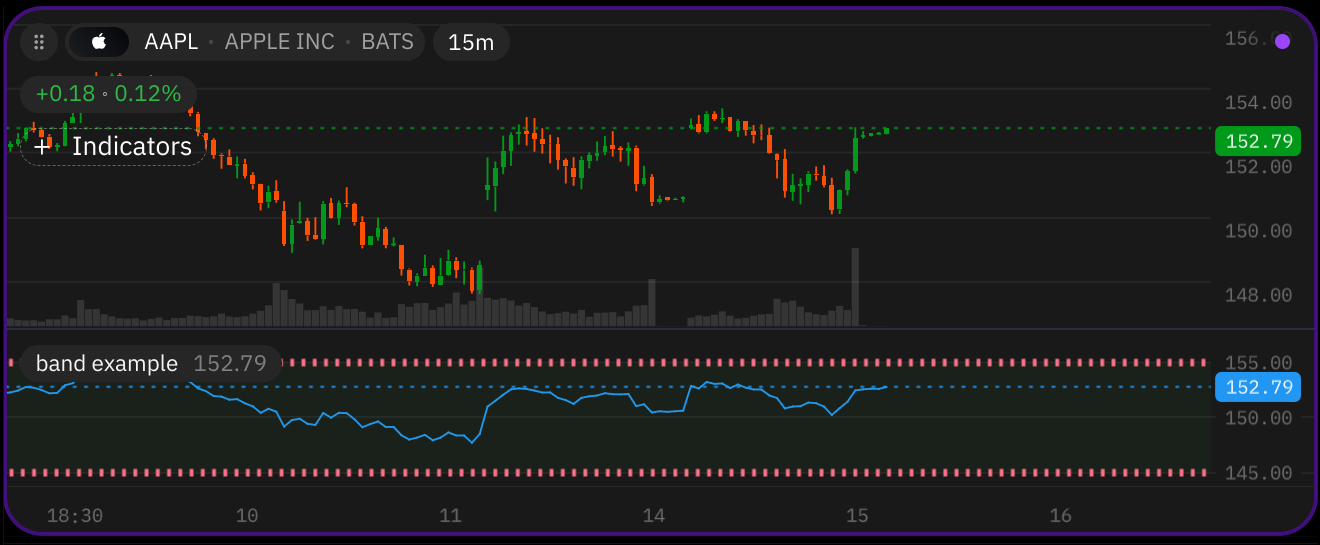
Bands
@band() decorator creates a band (two horizontal lines usually with a semi-transparent fill in between them).
value1— Value of the first horizontal line of a band on a vertical scale of an indicator.value2— Value of the second horizontal line of a band on a vertical scale of an indicator.title— Human-readable title which is visible in the indicator’s Settings panel.fill_color— Color of the background.line_color— Color of the line.line_style— Style of the line. It is represented as enum value of typeline_style.line_width— Width of the line.