This guide provides ready-to-use solutions for common drawing tasks in Indie indicators. Each pattern addresses a specific visualization need with working code examples.

Key Concepts for Drawing in Indie

Before diving into patterns, let’s recall these essential concepts that affect how drawings work in Indie.

Two Execution Phases: History vs Realtime

Indie indicators run in two distinct phases:
  1. History calculation: Each bar is processed once sequentially from left to right. Drawing objects are created and remain stable.
  2. Realtime updates: When new intrabar data arrives, the indicator re-executes for the current bar multiple times.
Code that works perfectly during history calculation can break during realtime updates. Always consider both phases when writing drawing code, and test your indicators on instruments with realtime updates on 1m timeframe for several minutes to catch potential issues.

Chart State Rollbacks

During realtime updates, when new intrabar data arrives:
  1. The chart state rolls back to what it was at the beginning of the current bar
  2. Your indicator’s calc() function executes again with updated data
If you created a drawing during an intrabar update, the rollback will remove it. If you erased a drawing during an intrabar update, the rollback will restore it.

When and Why to Use Var for Drawings

The mismatch between chart rollbacks and class field persistence creates a critical problem: class fields retain references to drawings that may no longer exist after a rollback. This can lead to runtime errors when trying to erase non-existent objects, or duplicate drawings when modifying and redrawing “ghost” references. Use Var[T] when you need to:
  • Update the same drawing object across multiple bars
  • Maintain drawing references during realtime updates
  • Erase drawings created in previous executions
Simple guidelines:
  1. One-time drawings (labels on conditions): Just create and draw - no special handling
  2. Persistent drawings (info panels): Store in class fields or Var and reuse the object
  3. Erasable drawings (anything you’ll erase): Must use Var for rollback safety

Common Drawing Patterns

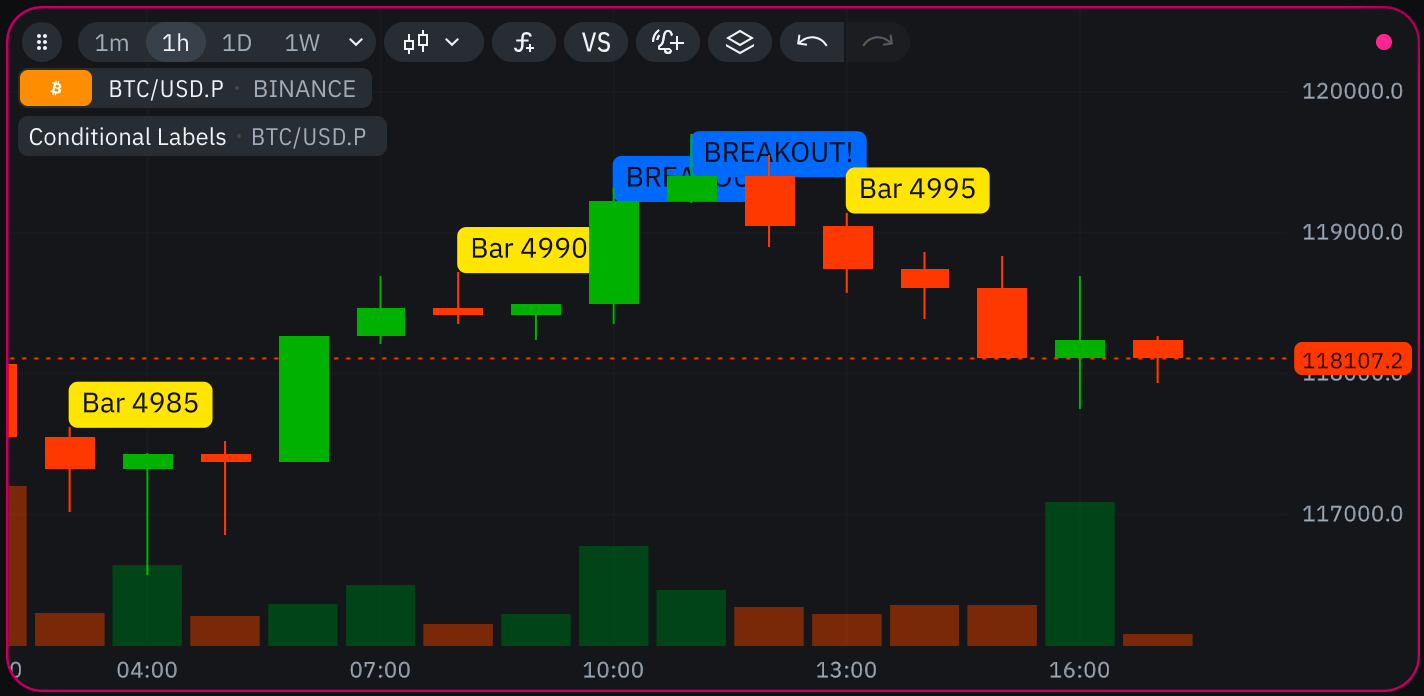
Pattern 1: Draw labels when conditions are met

Problem: You want to display labels on specific bars when certain conditions are satisfied, such as price patterns, indicator signals, or periodic intervals. Solution: Use conditional logic to check your criteria and create new label objects when conditions are met. No special object management is required.
Label breakouts and periodic bars
# indie:lang_version = 5
from indie import indicator, color
from indie.drawings import LabelAbs, AbsolutePosition
from indie.algorithms import Highest

@indicator('Conditional Labels', overlay_main_pane=True)
def Main(self):
    # Example 1: Label every 5th bar
    if self.bar_index % 5 == 0:
        self.chart.draw(LabelAbs(
            'Bar ' + str(self.bar_index),
            AbsolutePosition(self.time[0], self.high[0]),
        ))

    # Example 2: Label price breakouts
    highest_20 = Highest.new(self.high, 20)
    if self.close[0] > highest_20[1]:
        self.chart.draw(LabelAbs(
            "BREAKOUT!",
            AbsolutePosition(self.time[0], self.close[0]),
            bg_color=color.BLUE,
        ))
How it works: Labels are created when conditions are met and automatically persist on the chart. During realtime updates, the chart rolls back and re-executes, creating labels again when conditions are still true. Figure 1. Conditional Labels.

Pattern 2: Display information in fixed screen position

Problem: You want to show live statistics, indicator values, or other information that stays in a fixed position on screen regardless of chart scrolling or zooming. Solution: Create a LabelRel object once and reuse it by updating its text property. Store the label in a class field (for class-based indicators) or use Var (for function-based indicators).
# indie:lang_version = 5
from indie import indicator, Var
from indie.drawings import LabelRel, RelativePosition, vertical_anchor as va, horizontal_anchor as ha

@indicator('Info Panel', overlay_main_pane=True)
def Main(self):
    # Create label once, position it in top-right corner
    info_label_var = Var[LabelRel].new(LabelRel(
        "Initializing...",
        RelativePosition(va.TOP, ha.RIGHT, 0.1, 0.9)
    ))

    # Update content with current data
    info_label_var.get().text = "Price: " + str(self.close[0]) + "\nBar: " + str(self.bar_count)

    # Redraw to update display
    self.chart.draw(info_label_var.get())
Always reuse the same LabelRel object. Creating new relative-positioned labels on each bar will cause an error “count of relative positioned drawings exceeded the limit 100”.
Figure 2. Info Panel.

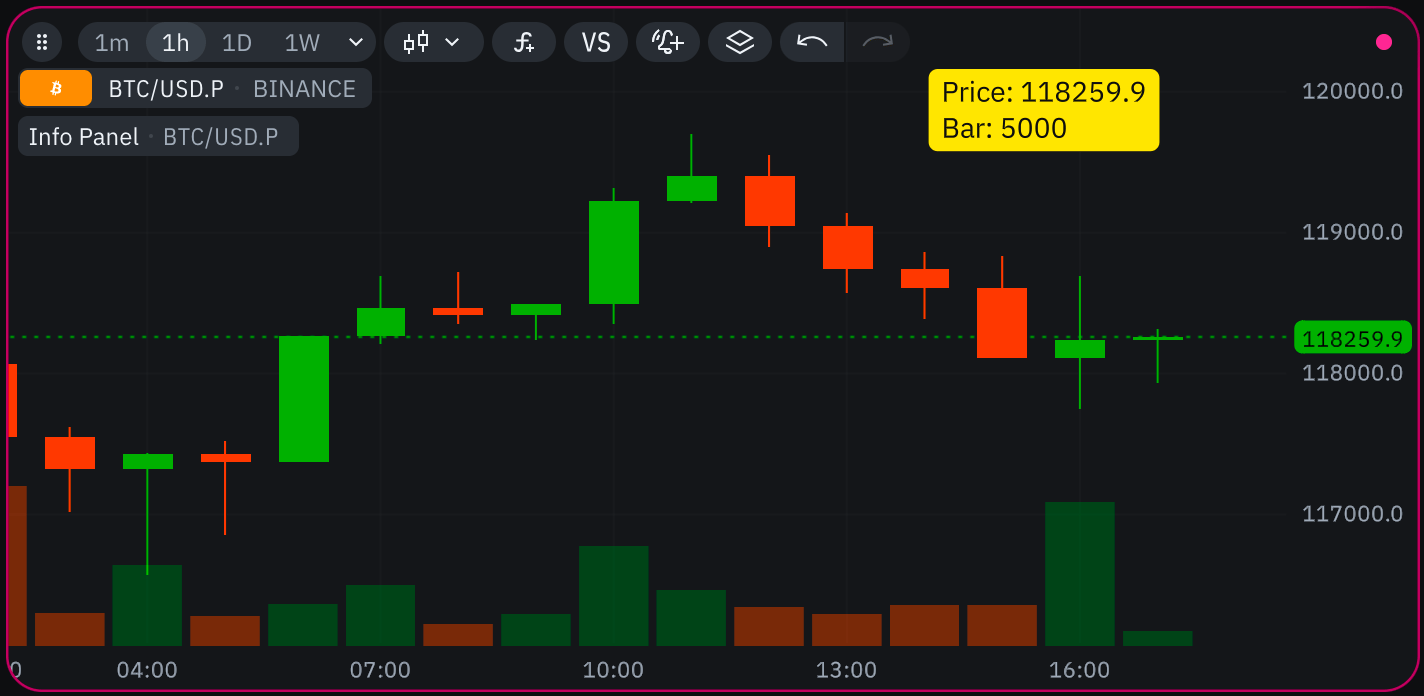
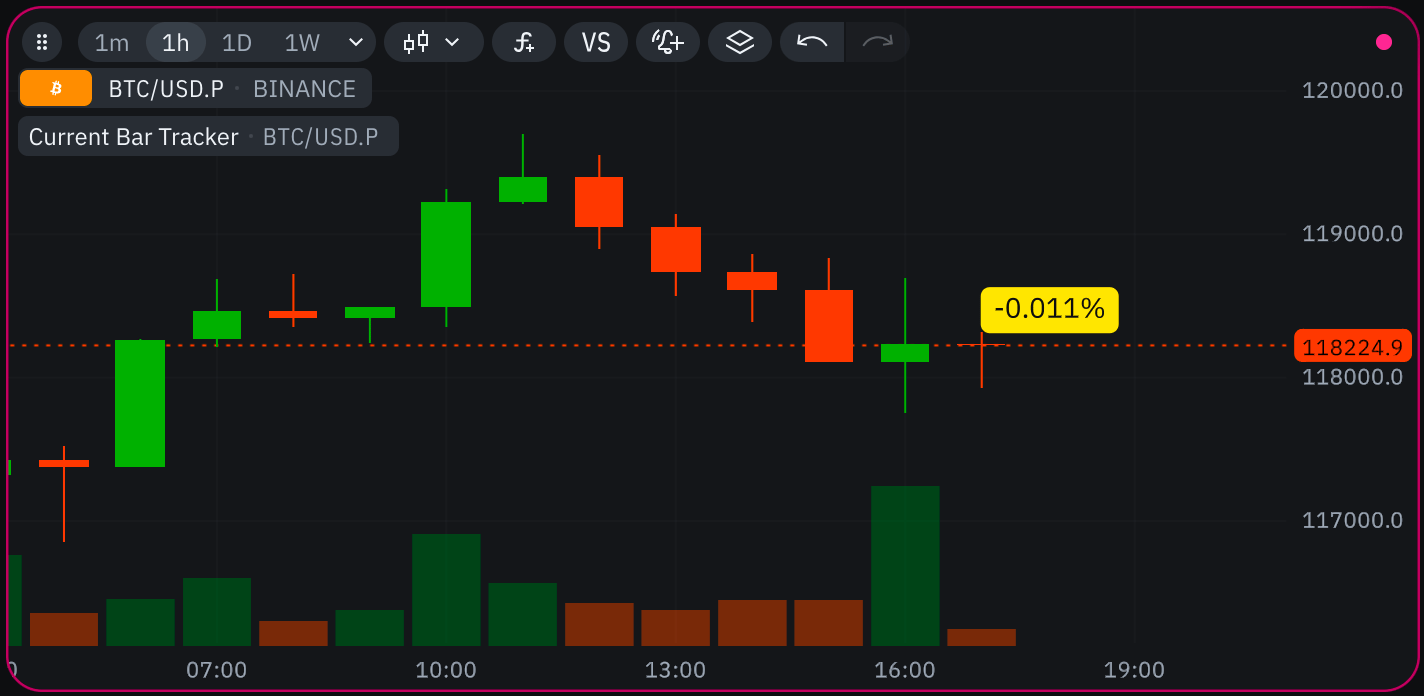
Pattern 3: Label that follows the current bar

Problem: You want a label that appears only above the most recent bar and moves with it as new bars arrive, displaying current values or active signals. Solution: Create a LabelAbs object once and update both its position and text properties on each bar to follow the current price action.
# indie:lang_version = 5
from indie import indicator, Var
from indie.drawings import LabelAbs, AbsolutePosition

@indicator('Current Bar Tracker', overlay_main_pane=True)
def Main(self):
    # Create label once with dummy position
    tracker_var = Var[LabelAbs].new(LabelAbs("Initializing", AbsolutePosition(0, 0)))

    # Calculate what to display
    price_change = self.close[0] - self.close[1]
    change_pct = (price_change / self.close[1]) * 100

    # Update both text and position
    tracker_var.get().text = str(round(change_pct, 3)) + '%'
    tracker_var.get().position = AbsolutePosition(self.time[0], self.high[0])

    # Redraw at new position
    self.chart.draw(tracker_var.get())
Key point: By reusing the same label object and updating its position, you ensure only one label exists at any time, creating a smooth tracking effect. Figure 3. Current Bar Tracker.

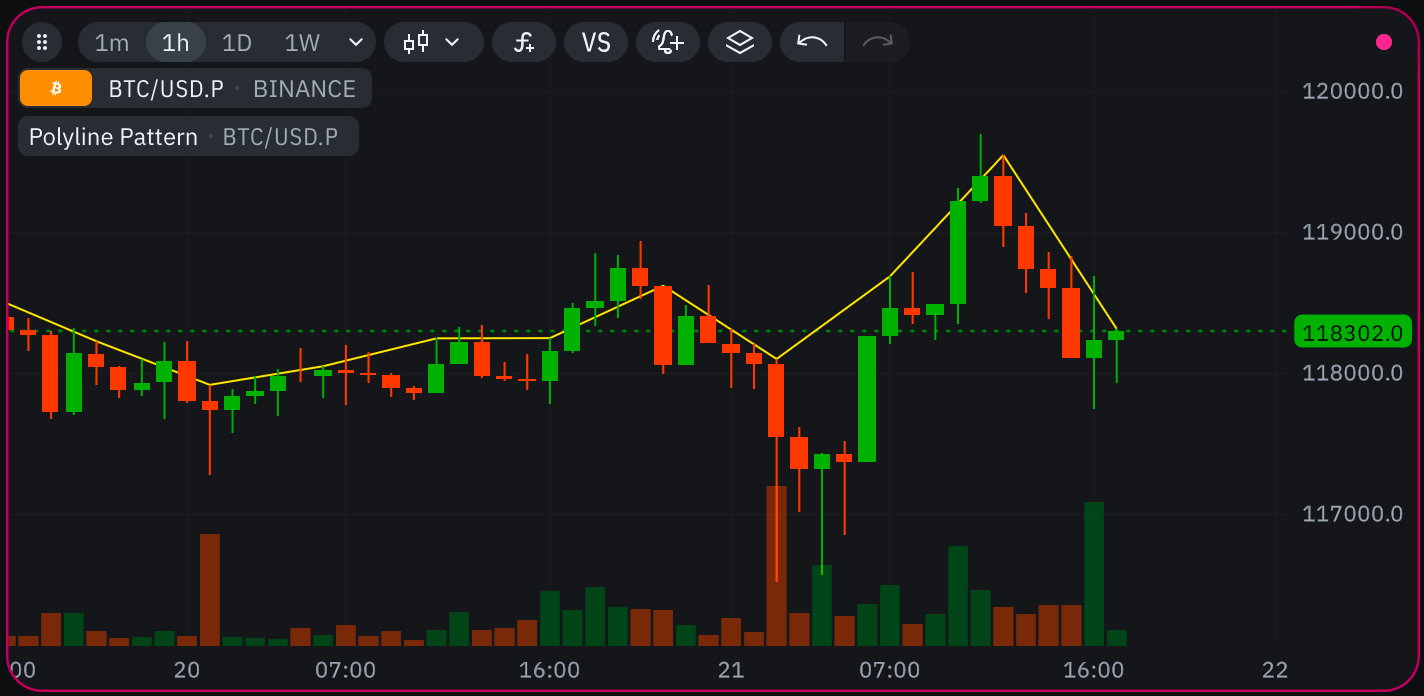
Pattern 4: Draw polyline connecting specific points

Problem: You want to create connected lines that pass through specific price points (e.g., highs every 5 bars), forming a polyline that updates as new bars arrive. Solution: Maintain only the current active segment using Var. Update the segment’s endpoint between anchor points, and create new segments at anchor points.
# indie:lang_version = 5
from indie import indicator, Var, Optional
from indie.drawings import LineSegment, AbsolutePosition

@indicator('Polyline Pattern', overlay_main_pane=True)
def Main(self):
    # Store current segment in Var for rollback safety
    current_segment = Var[Optional[LineSegment]].new(None)

    # Current point (using high for visibility)
    curr_point = AbsolutePosition(self.time[0], self.high[0])

    # Every 5th bar is an anchor point
    if self.bar_index % 5 == 0:
        start_point = curr_point  # Default for first segment

        # Continue from previous segment's endpoint if it exists
        if current_segment.get() is not None:
            start_point = current_segment.get().value().point_b

        # Create new segment
        current_segment.set(LineSegment(start_point, curr_point))

    # Between anchors: update current segment's endpoint
    elif current_segment.get() is not None:
        current_segment.get().value().point_b = curr_point

    # Draw the active segment
    if current_segment.get() is not None:
        self.chart.draw(current_segment.get().value())
Why Var is essential: During realtime updates on anchor bars, without Var the polyline would break. The segment reference must survive rollbacks to maintain continuity. Note that even if you used a class field to store the segment, you would still need to wrap it in Var[Optional[LineSegment]]. Figure 4. Polyline Pattern. What happens without Var: If you used a regular class field self.current_segment: Optional[LineSegment] instead:
  1. On anchor bar (e.g., bar 10), you create a new segment starting from the previous segment’s endpoint and save it to self.current_segment
  2. An intrabar update arrives, chart rolls back to the start of bar 10
  3. During recalculation, the code tries to create a new LineSegment, but takes its start point from self.current_segment, which was modified during the previous update and wasn’t rolled back
  4. This creates a disconnected polyline - the new segment starts from an incorrect position

Pattern 5: Safely erase drawings created on previous executions

Problem: You need to manually erase drawings that were created during previous bar updates or previous intrabar executions. This is common for temporary overlays, alerts, or any drawings that should appear and disappear based on conditions. Solution: Let’s explore this through a concrete example - creating a blinking line indicator. We’ll work through the challenges step-by-step to understand why proper erasure handling is crucial. First attempt - using class fields:
# indie:lang_version = 5
from indie import indicator, Optional, MainContext
from indie.drawings import LineSegment, AbsolutePosition, extend_type

@indicator('Blinking Line - Broken', overlay_main_pane=True)
class Main(MainContext):
    def __init__(self):
        self.is_visible = True
        self.line_segment: Optional[LineSegment] = None

    def calc(self):
        self.is_visible = not self.is_visible

        if self.is_visible:
            self.line_segment = LineSegment(
                AbsolutePosition(self.time[1], self.close[1]),
                AbsolutePosition(self.time[0], self.close[0]),
                extend_type=extend_type.RIGHT,
            )
            self.chart.draw(self.line_segment.value())
        elif self.line_segment is not None:
            self.chart.erase(self.line_segment.value())  # Runtime error!
Where it breaks: Consider this scenario:
  1. On the last update of bar N, the line is erased (is_visible was False)
  2. Bar N+1 starts with no line on the chart
  3. First execution: is_visible becomes True, line is drawn
  4. Intrabar update arrives, chart rolls back to start of bar N+1 (no line)
  5. Second execution: is_visible becomes False, tries to erase non-existent line
  6. Runtime error!
This type of error often manifests as “Error: drawing object does not exist” and only appears during realtime, making it hard to catch during development.
Second attempt - using Var for the drawing:
# indie:lang_version = 5
from indie import indicator, Optional, MainContext
from indie.drawings import LineSegment, AbsolutePosition, extend_type

@indicator('Blinking Line - Still Broken', overlay_main_pane=True)
class Main(MainContext):
    def __init__(self):
        self.is_visible = True
        self.line_segment = self.new_var(Optional[LineSegment]())

    def calc(self):
        self.is_visible = not self.is_visible

        if self.is_visible:
            self.line_segment.set(LineSegment(
                AbsolutePosition(self.time[1], self.high[1]),
                AbsolutePosition(self.time[0], self.close[0]),
                extend_type=extend_type.RIGHT,
            ))
            self.chart.draw(self.line_segment.get().value())
        else:
            if self.line_segment.get() is not None:
                self.chart.erase(self.line_segment.get().value())
            self.line_segment.set(None)
Where it still breaks: Now we hit the opposite problem:
  1. On the last update of bar N, the line is drawn (is_visible was True)
  2. Bar N+1 starts with the line on the chart
  3. First execution: is_visible becomes False, line is erased
  4. Intrabar update arrives, chart rolls back to start of bar N+1 (line is back!)
  5. Second execution: is_visible becomes True, draws another line
  6. Result: Two lines on the chart!
The working solution - always erase first:
# indie:lang_version = 5
from indie import indicator, MainContext, Optional, Var
from indie.drawings import LineSegment, AbsolutePosition, extend_type

@indicator('Blinking Line', overlay_main_pane=True)
class Main(MainContext):
    def __init__(self):
        self.is_visible = True
        self.line_segment = self.new_var(Optional[LineSegment]())

    def calc(self):
        # Always clean up first - handles all rollback scenarios
        if self.line_segment.get() is not None:
            self.chart.erase(self.line_segment.get().value())
            self.line_segment.set(None)

        # Then conditionally draw
        if self.is_visible:
            self.line_segment.set(LineSegment(
                AbsolutePosition(self.time[1], self.close[1]),
                AbsolutePosition(self.time[0], self.close[0]),
                extend_type=extend_type.RIGHT,
            ))
            self.chart.draw(self.line_segment.get().value())

        # Toggle for next execution
        self.is_visible = not self.is_visible
Why this works: The “erase-first” pattern elegantly handles all rollback scenarios. Whether the chart rolled back with or without the line, we always start fresh. This simple approach avoids complex state tracking and works reliably in both history calculation and realtime updates. Result: The line blinks with each execution - appearing when is_visible is true and disappearing when false. During realtime updates, each intrabar update toggles the visibility, creating a visual heartbeat of market activity.