The Financials widget integrates seamlessly with Stock Screener and Watchlist, allowing efficient financial analysis as you browse through instruments. Link these widgets together for instant financial data updates while reviewing your watchlist or screener results, or you can also use it independently.Documentation Index
Fetch the complete documentation index at: https://takeprofit.com/docs/llms.txt
Use this file to discover all available pages before exploring further.
Financial Data Categories
Core Reports
- Income Statement
- Company’s income, costs, profits, and losses
- Key profitability indicators
- Balance Sheet
- Assets, liabilities, shareholder equity
- Capital structure evaluation
- Cash Flow
- Cash inflows and outflows
- Free cash flow analysis
- Activity-specific cash movements
- Statistics
- Financial ratios
- Valuation metrics (P/E, P/S, P/B, etc.)
Data Periods
- Annual (Fiscal Year)
- Quarterly
- TTM (Trailing Twelve Months)
- Historical depth: 10 years annual or 12 quarters
Quarterly data may not be available for all companies.
Customizing Data Display
Display Settings
- Units: Millions (M) or Billions (B)
- Default currency: USD (more currencies coming soon)
- Decimal precision: Toggle between .0 and .00
- Layout: Switch between table/chart positions using “Swap Chart and Table”
- Hide/show chart with collapsible divider.
Table Features
- Common Size Analysis
- Convert absolute values to percentages
- Apply to entire table or specific metrics
- Compare companies of different scales
- Year-over-Year Growth
- Track growth rates
- Apply %YoY to whole table or individual metrics
- Visualization Options
- Add metrics to chart directly from table
- Chart types: Line, Area, Column, Stacked, Percent
- Separated Axis for different scale metrics
- Hide/show specific metrics.
Chart Management
Once data is on the chart:- All added metrics appear as labeled items above the chart
- Click any metric label to:
- Change visualization type
- Toggle Separated Axis
- Hide temporarily without removing
- Remove from chart completely
- Manage multiple metrics efficiently without returning to the table.
Built-in Presets
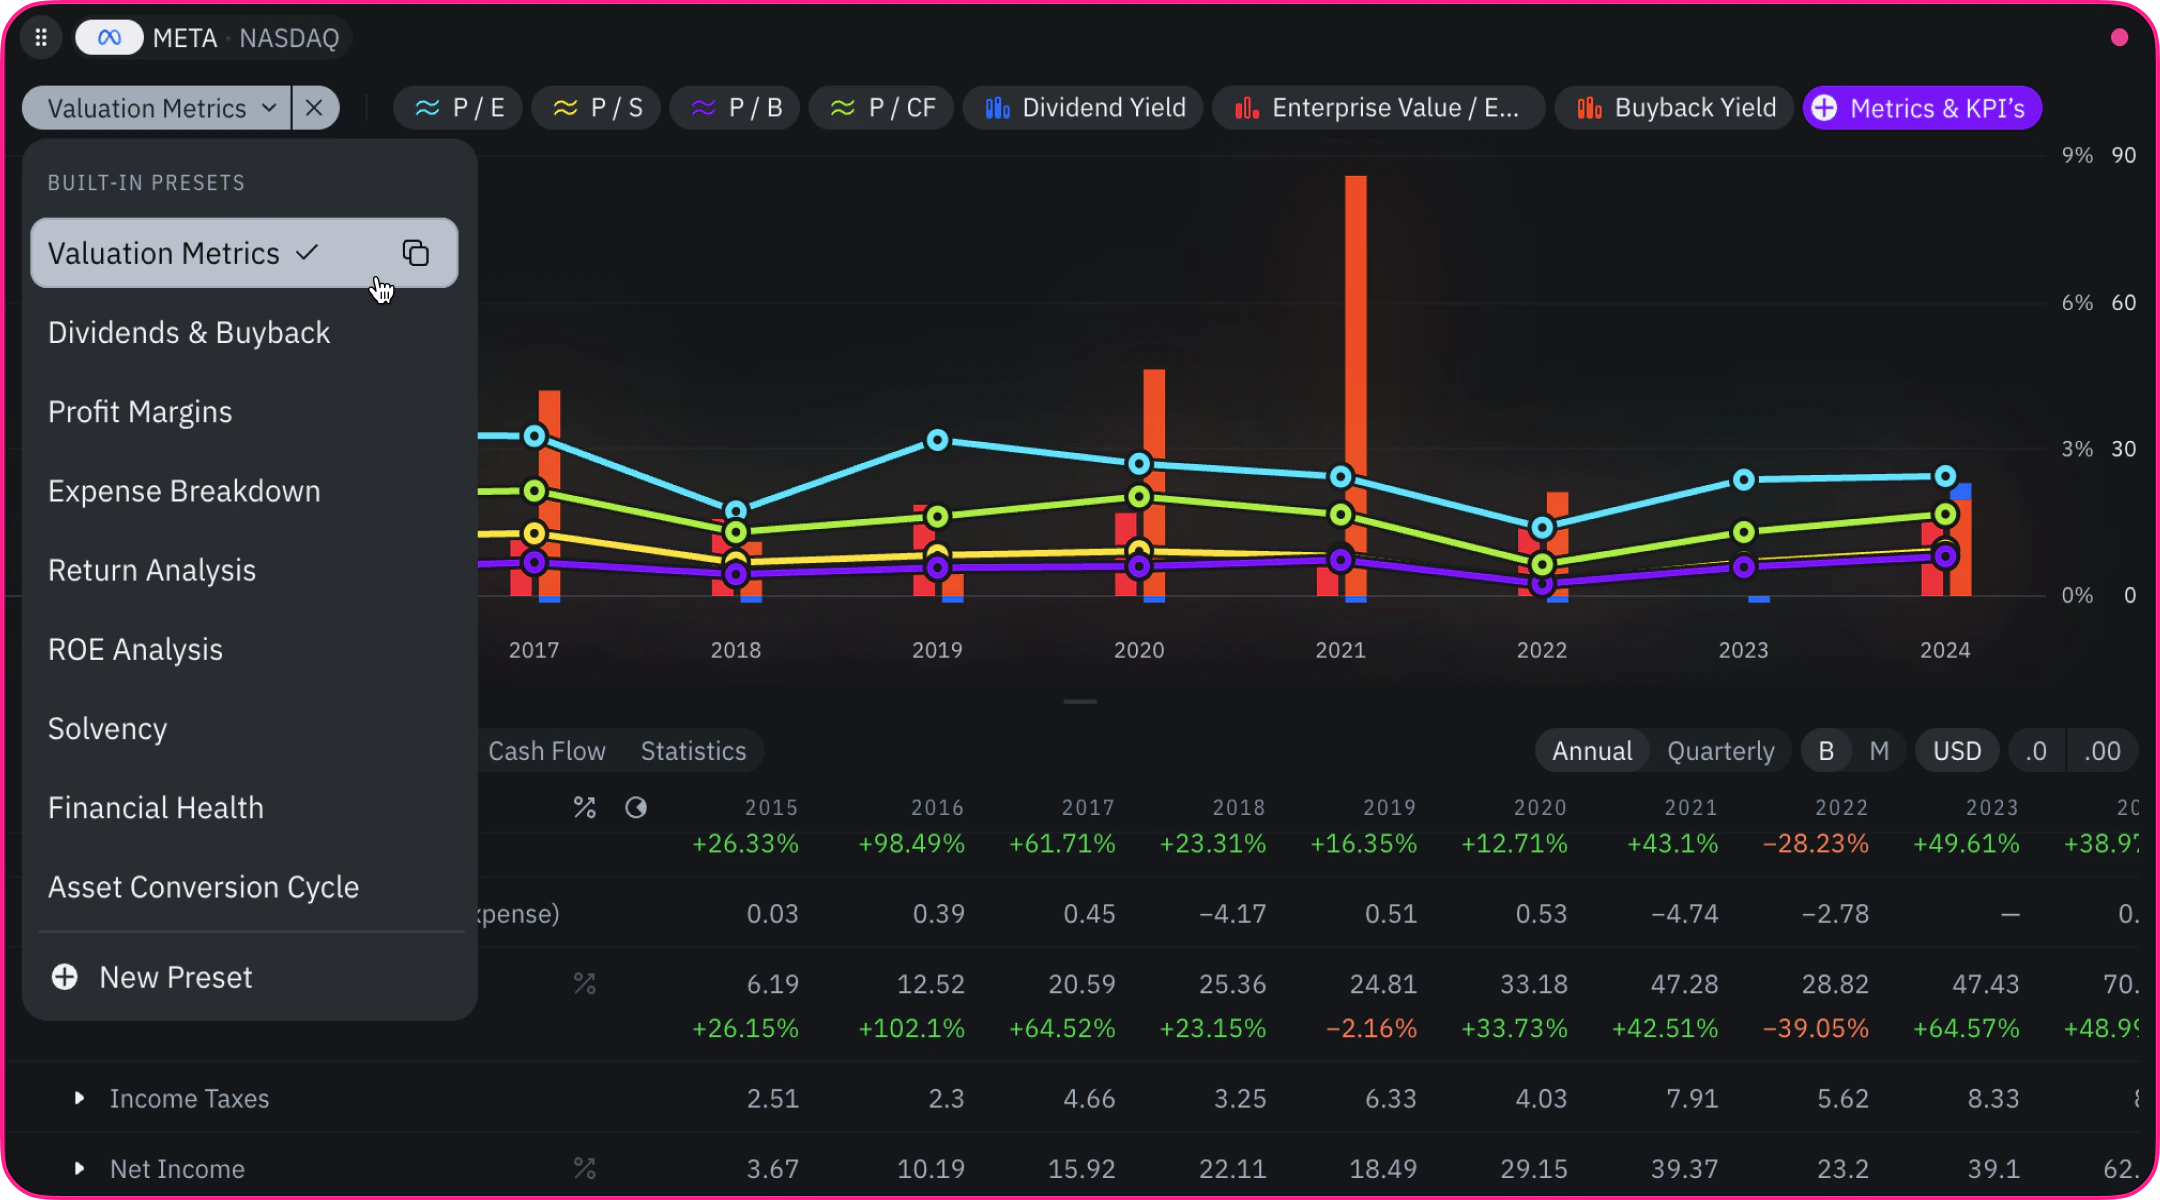
List of Built-in Presets
- Valuation Metrics
- Dividends & Buyback
- Profit Margin
- Expense Breakdown
- Return Analysis
- ROE Analysis
- Solvency
- Financial Health
- Asset Conversion Cycle.
Custom Presets
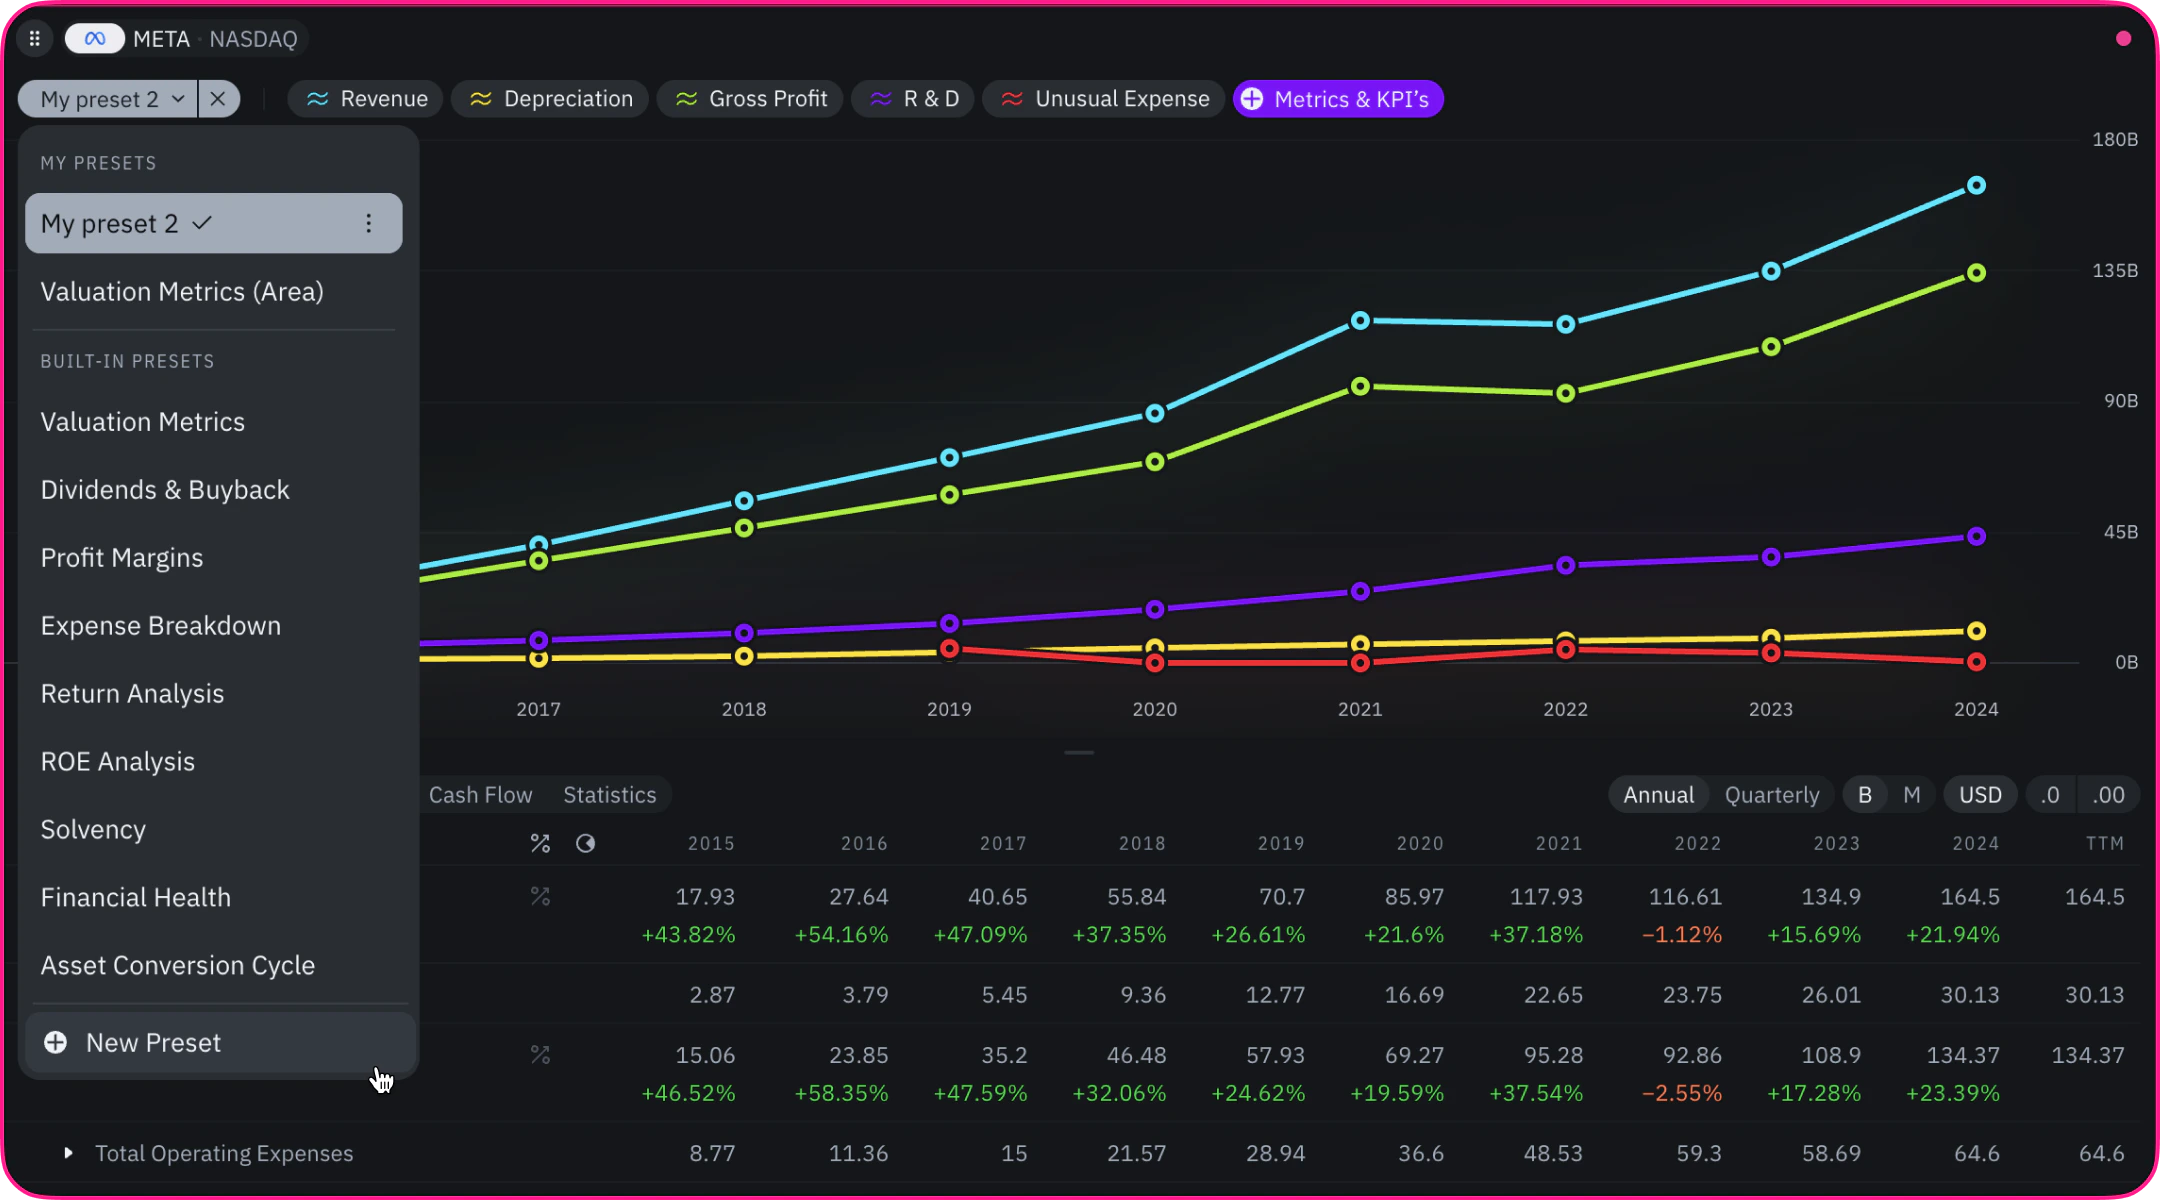
- Modify existing presets
- Create new presets from scratch
- Save and access your presets.