Honeywell International Inc (HON)image
Honeywell International Inc (HON)
Looking at the 4h Chart we can see an ABCD Pattern whose Pattern Point D represents a Liquidity run. You'll also notice a RSI Divergence highlighted on the chart. We're almost at Target 2 but there's more downside potential.
Honeywell International Inc (HON)
BTC X-ABCD Updateimage
BTC X-ABCD Update
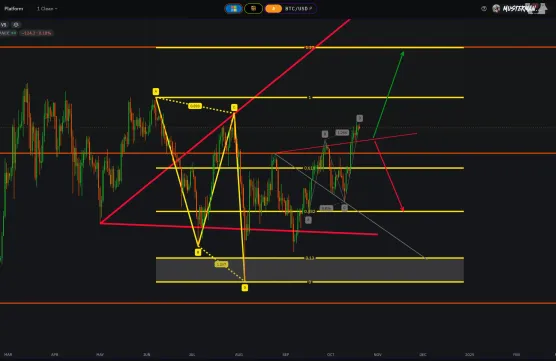
The X-ABCD has now broken rule Target 2 and there is a weak option for a new intra abcd. 
BTC X-ABCD Update
BTC RA1 after sqeezeimage
BTC RA1 after sqeeze
You can find the short setup of the previous movement here. In reaction to the squeeze, a new ABCD pattern has formed, and it has now reached rule target 1 on the 0.38 Fibonacci.
BTC RA1 after sqeeze
Unraveling the Recent Market Turmoil
As the global financial landscape continues to evolve, it’s becoming increasingly evident that we’re standing at a crossroads. The recent market turbulence has been nothing short of a rollercoaster ride, with various factors at play, each contributing to the chaotic symphony of economic uncertainty.
Unraveling the Recent Market Turmoil