

What the letters mean
Each letter is a label for one block of time, handed out in alphabetical order as the session runs: the first block is A, the second B, the third C, and so on. With the default 30-minute block size, C is the third half-hour of the session. A letter is printed at every price the market traded during that block. So:- Read a row left to right and you get the history of that price level — which blocks of the session visited it, earliest on the left, most recent on the right.
- Read a column — the same letter repeated down several rows — and you get the range the market covered during that one block of time. A tall column of a single letter means price ran through a wide range in half an hour; a short one means it barely moved.
- The length of a row is the point. A price touched by ten letters held the market for five hours; a price with one letter was passed through in a single block and rejected.
How to read a profile
- Shape — a profile that bulges in the middle means the market spent the session building value around one price. A profile stretched thin at one end shows where price went but found no acceptance.
- Profile width — the width of a profile is driven by the number of blocks on its busiest price level, not by the length of the session.
- Single letters at the edges — prices visited by exactly one block, usually the extremes of the move, are the ones the market rejected fastest.
Key levels
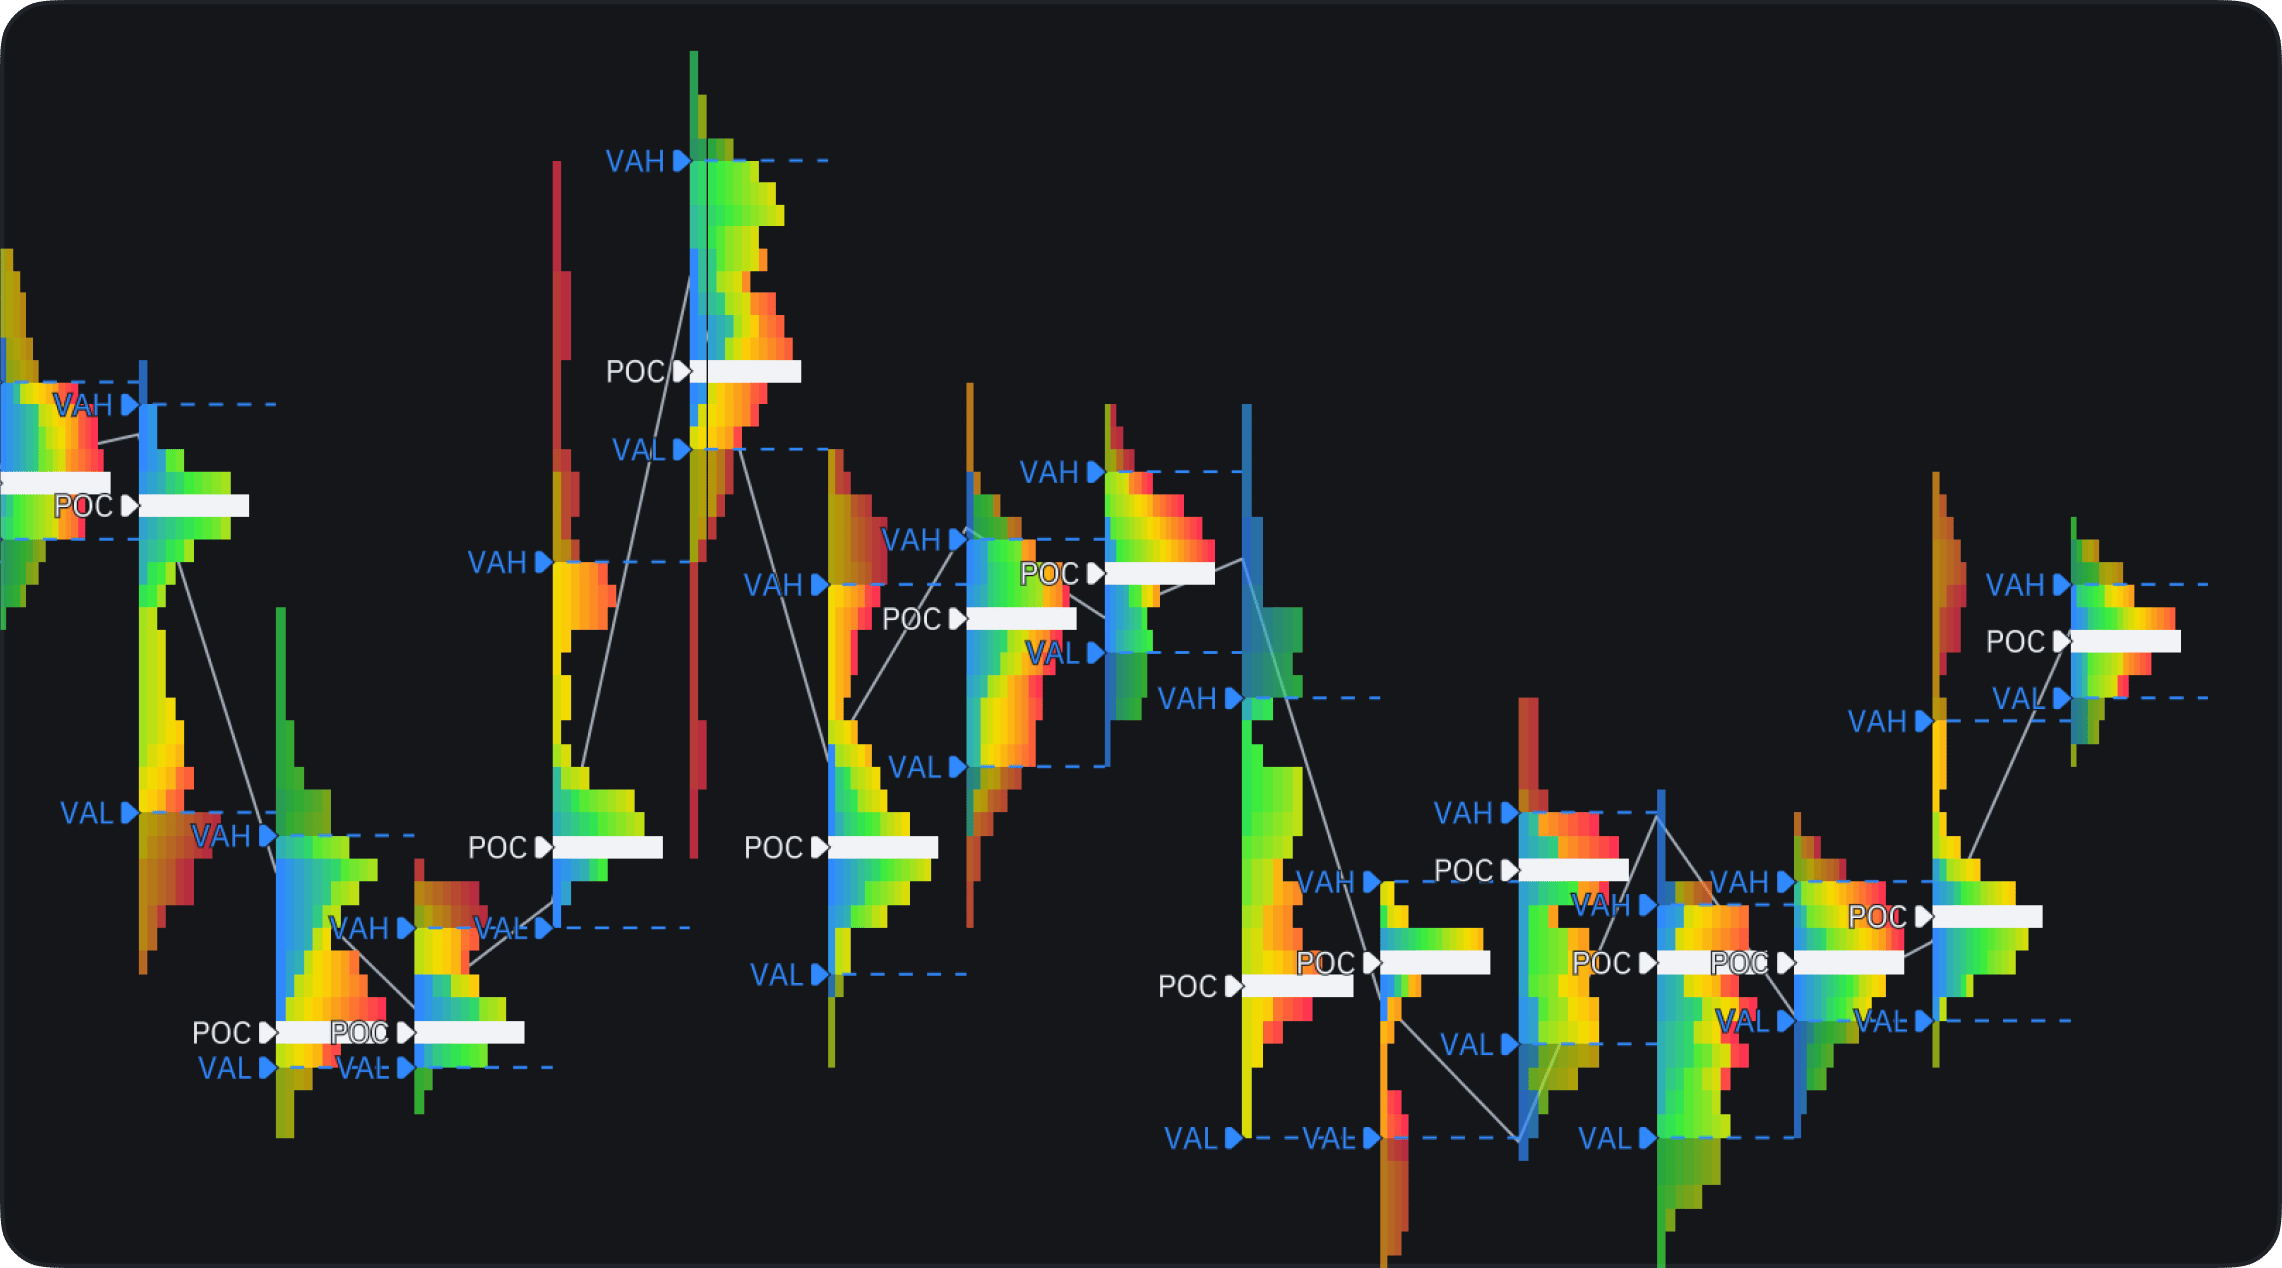
On the chart the POC is the highlighted row running through the profile, while VAH and VAL are drawn as lines at the edges of the Value Area. With Level labels enabled, each one is captioned with its name on the price scale.
Market Profile settings
Open Chart Settings and expand the Market Profile section:- Period — the span covered by a single profile, for example 1 Day.
- Session — which trading hours to include. Market only builds profiles from regular hours; switching it to include extended hours matches the Show extended sessions toggle on the instrument pill.
- Block size — how much time one letter represents. The default is 30m, the classic market-profile block.
- Row size — the height of one price row. Auto picks a step suited to the instrument; set it manually to control how fine or coarse the profile is.
- Value area — the share of activity that defines the Value Area, 70% by default.
- Initial Balance — how many opening blocks count toward the Initial Balance, 2 blocks by default.
Appearance settings
In the Style section, with TPO selected:- Display — Expanded stretches the profile along both axes as you zoom the chart; Stacked keeps the cells square and anchors the profile to the start of its session.
- Blocks and Letters — toggle the cells and the letters drawn inside them.
- Color by — Time Gradient colors cells by their position in the session.
- Blocks colors — the palette used for the gradient.
- Outside VA opacity and Profile opacity — dim the cells outside the Value Area, or the whole profile, to keep the chart readable.
- POC, Value Area, Initial Balance — color, line style, and visibility of each level.
- Level labels — show or hide the POC / VAH / VAL captions.
- Line — the price line drawn alongside the profiles.
Working with other chart features
TPO charts work together with drawing tools, indicators, alerts, multiple panes, and compared symbols, exactly like the other chart types. The same profiles are available to your own indicators: see TPO profiles in the Indie documentation.TPO is a first iteration and will keep evolving — settings and behavior may change as we build on it. If something looks wrong, tell us in Discord or at support@takeprofit.com.