Solana: Post Bitcoin Halving Analysis
Solana has caused controversy before and has been in the news a lot recently. Today I want to dive into the technical analysis of this Altcoin posting immense potential being the #5 biggest cryptocurrency ...
Daily Chart
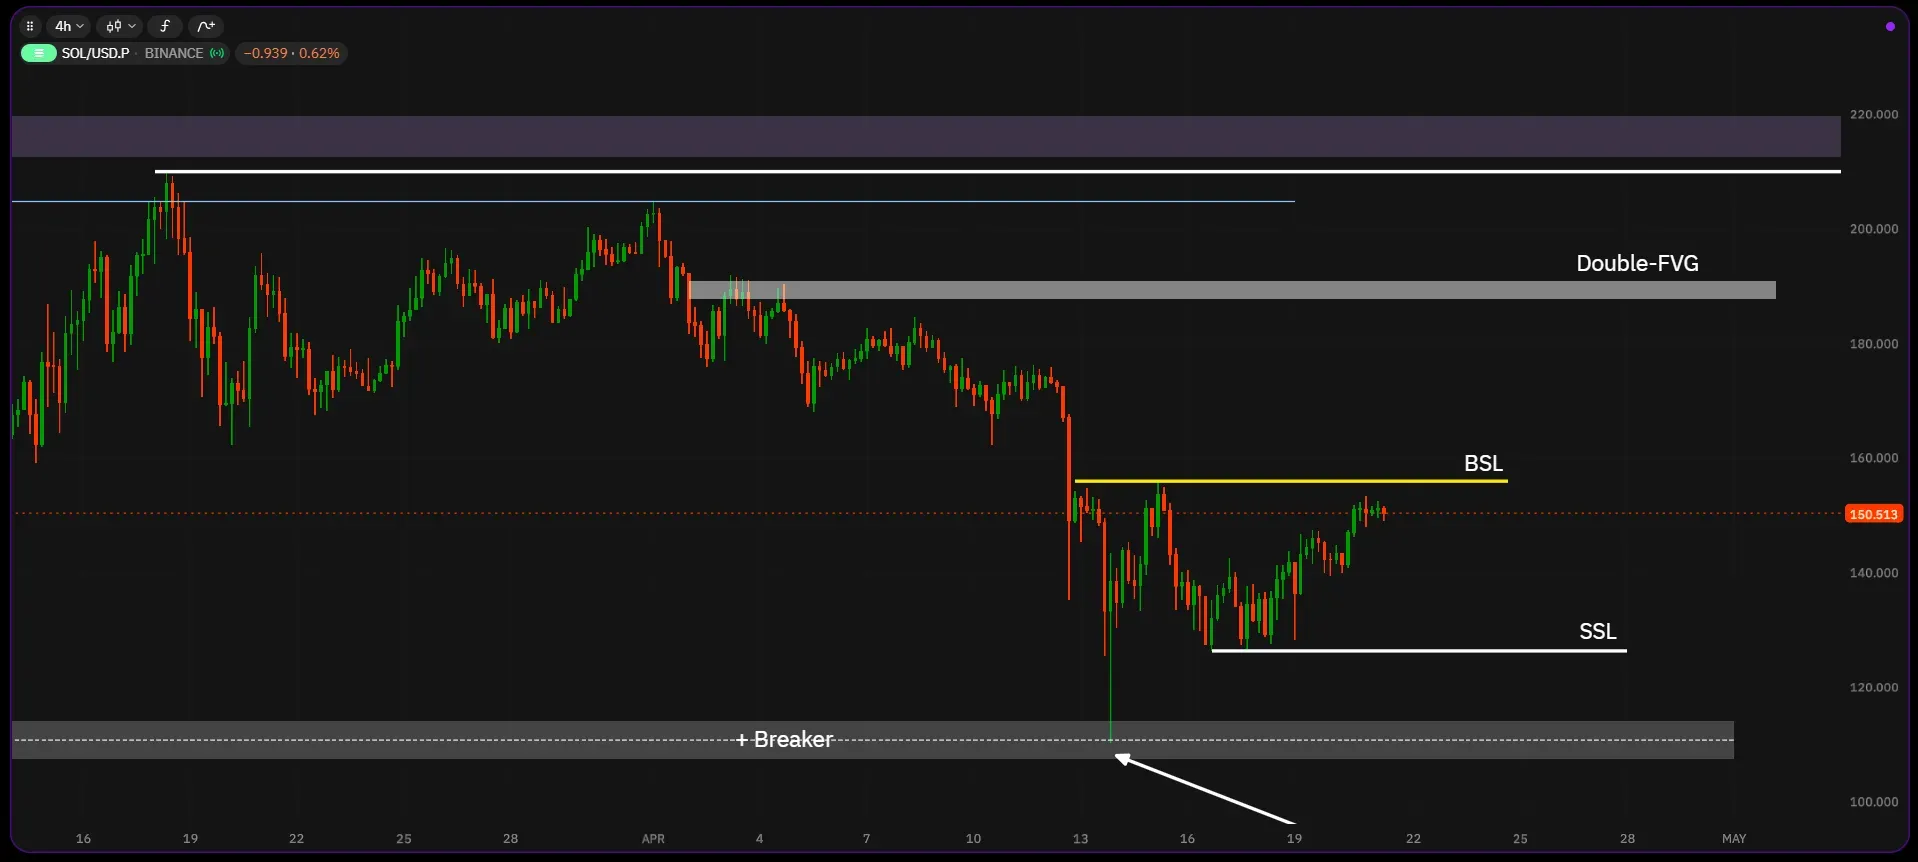
As you can see in the chart below, Mid-March we pierced through the Buyside Liquidity left from 2021 but failed to reach into the FVG above it. After a correction to the downside we wend back up into the wick of the previous high which can be seen as a gap and used for an OTE (my version, don't know if it's according to Michael's rules).
Just before the run-up to the BSL Dec 2021 SOL created a low, high and a lower low which is a + Breaker and could've been your Take Profit (TP).
To the downside, we still have the relatively equal lows (SSL) and a FVG in the form of a BISI. Whether we'll reach into it or not will probably be determined by how the rest of the market's moving. I personally would like to see it continue moving higher to its upside targets.
A run, down to the SSL would and into the FVG would make me a buyer. In this case, I'd like to see it run there fast and sudden with big beefy candles (Marubozu Candles) and ideally a wick below.
4h-Chart
As I don't want to be short in this market (I never bet against the underlying trend), I only look for possible longs right now.
So, what would I want to see in case of a possible swing trade idea?
I in 80-90% of all cases I only take a trade when SMC Trader see price take some stops (marked BSL or SSL on my charts) or filling orders that are "left-over" (FVG). For my TPs I ideally want to see a level where price would fill some stops and slightly above the stops of a FVG, so price can raid the stops while simultaneously getting the unfilled orders of the FVG. That's what I would call high probability for my personal trading.

Educational Degression:
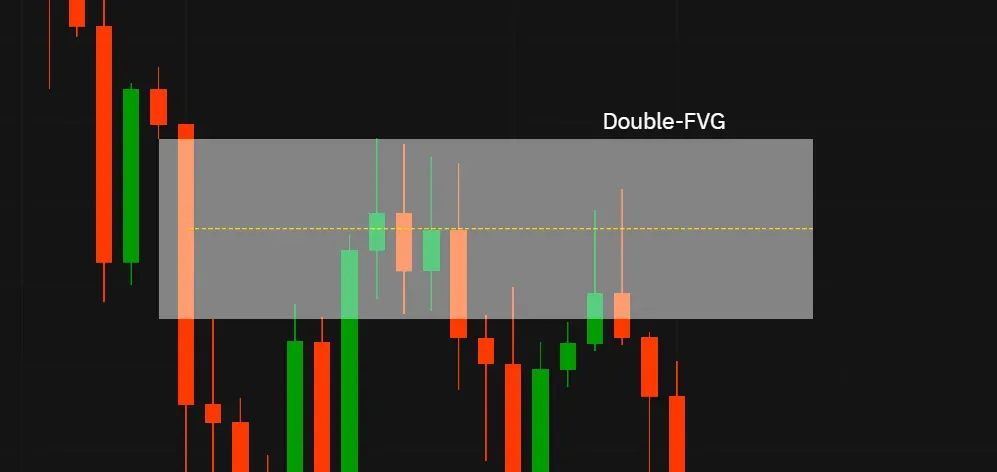
In this case, there is a FVG at/slightly below the stops which decreases the probability of it being ran to, BUT as you can see when closely investigating the Gap, you can see it respecting the 50% level (not closing above it).
Yes, I know that it closed above it, but in this case it's fine by me, as it's a crypto chart and crypto prices tend to have higher deviations than regulated markets like indices, commodities or even bonds.
It still respected the SIBI (FVG), high and 50% level to a degree, so my TP would be at the beginning of the FVG to ensure it being triggered.
To summarize, my TPs would reside above relatively equal highs, the FVG and of course the ATH. Still, letting some of the position ride to potentially infinity ;) using a Trailing Stop is always nice to have.

Fundamentals
I don't want to pretend to know or care too much about the Fundamentals about the project, as there are plenty of projects offering a great deal of value and real world applications, but also coins like Doge or Shiba Inu.
In my humble opinion, trading crypto based on fundamentals is mostly gambling as you can have a great project and everything would seem legit if you were trading a stock but unless some guy comes along and makes a meme out of it, it can trade as a small cap forever.
As always, be careful in these volatile markets and don't let FUD or FOMO get to you :D


