MTC Education - Elliott Impulses [English]
As Elliott Wave theory is often quite abstract for the beginner, we have decided to work a lot with pictures rather than writing huge novels, which there are more than enough of already. By following this principle, your understanding of the subject will be much better. You will soon realize that only the visualization of the theory will give you the lasting "aha-effect".
Before we start with the structure of the Elliott Wave Theory (EW) and take a closer look at the internal structures / formations, a few brief words on the background.
The EW theory is based on observations of recurring market sequences that can be traced back to the psychological behavior of investors. Two emotions are of particular importance here - fear and greed. Driven by external factors and influences, these emotions are decisive for the majority of all buy and sell decisions.
This is why we like to refer to it as the "action-reaction" principle of market participants. It is responsible for the resulting price movements, which can be summarized in a comprehensible development pattern.
In this lesson, you will learn the basis of Elliott Wave Theory. It forms the basic structure of all movements in the chart.
As already mentioned, in the introduction, price movements are based on the "action-reaction" principle. This means that an action or build-up is always required first in order to trigger a subsequent impulse (reaction).
The whole thing can be compared to a bow and arrow. First, the bow must be drawn so that the arrow can then be shot. In this case, drawing back the bow is the action and firing the arrow is the reaction. The impulse movement is therefore the drive of a trend movement and consists of a total of five movements. In Elliott wave theory, these movements are also known as waves.
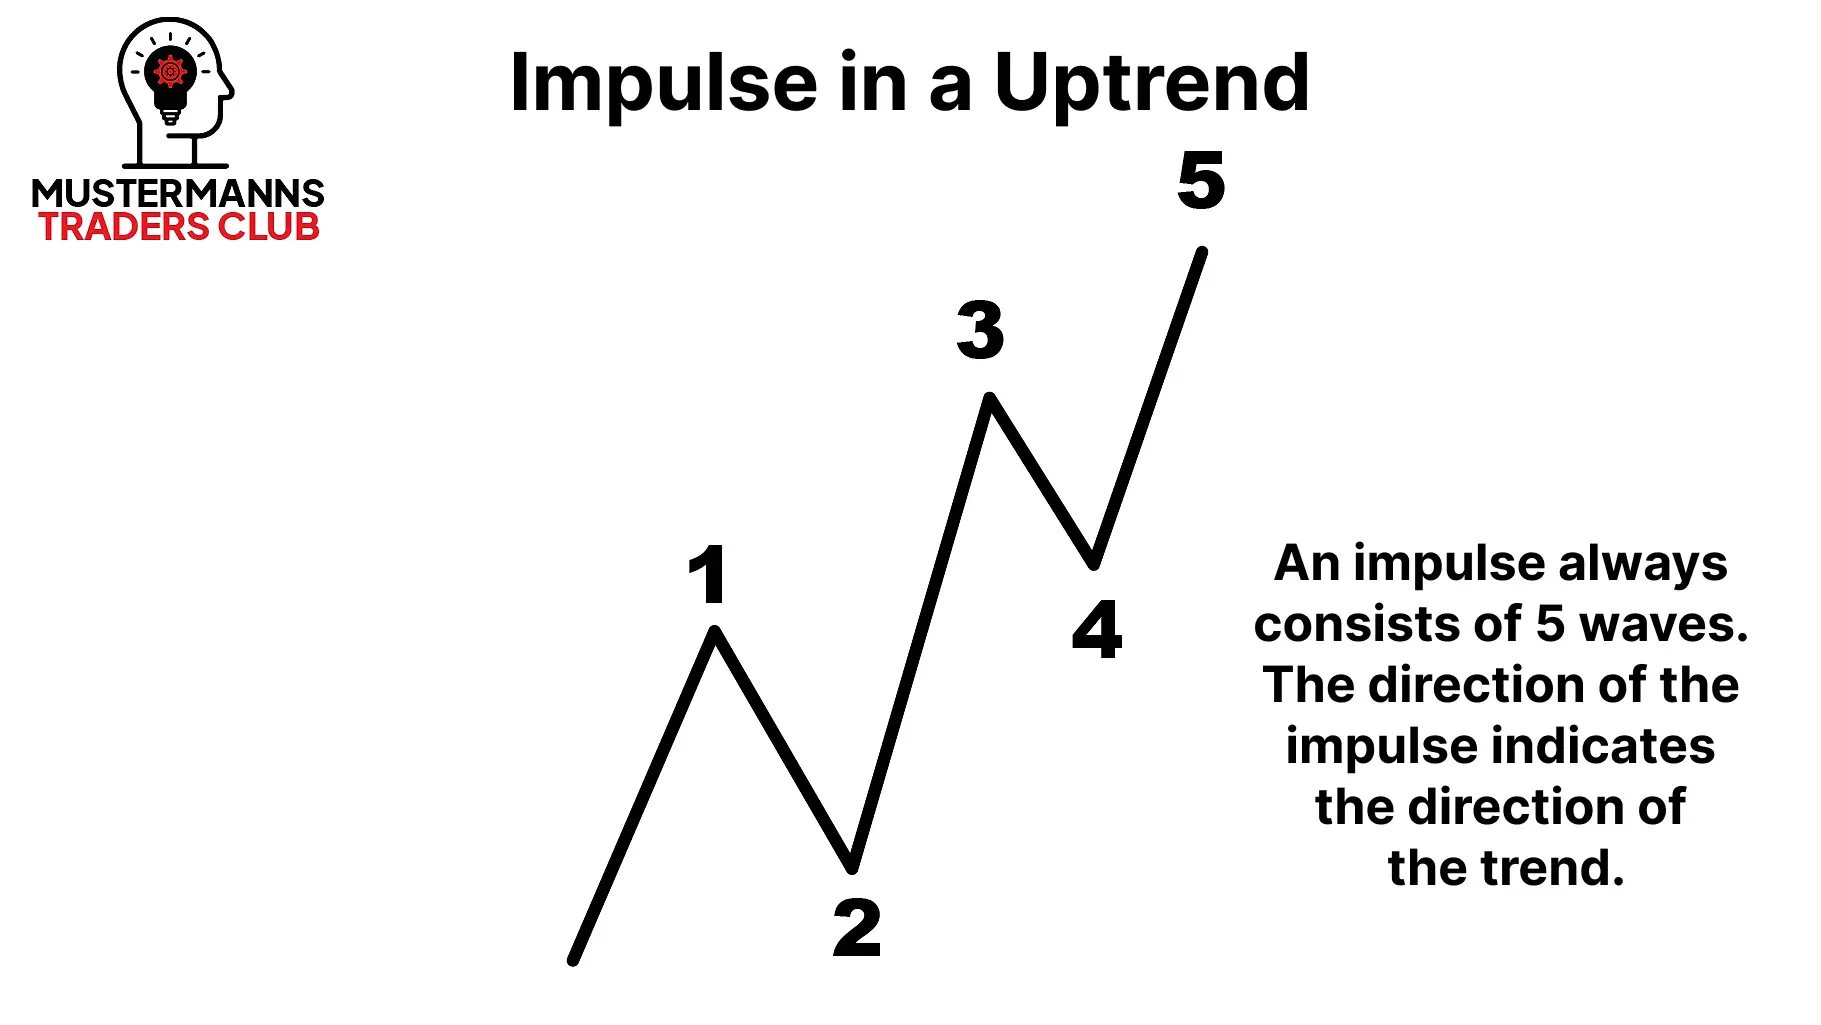
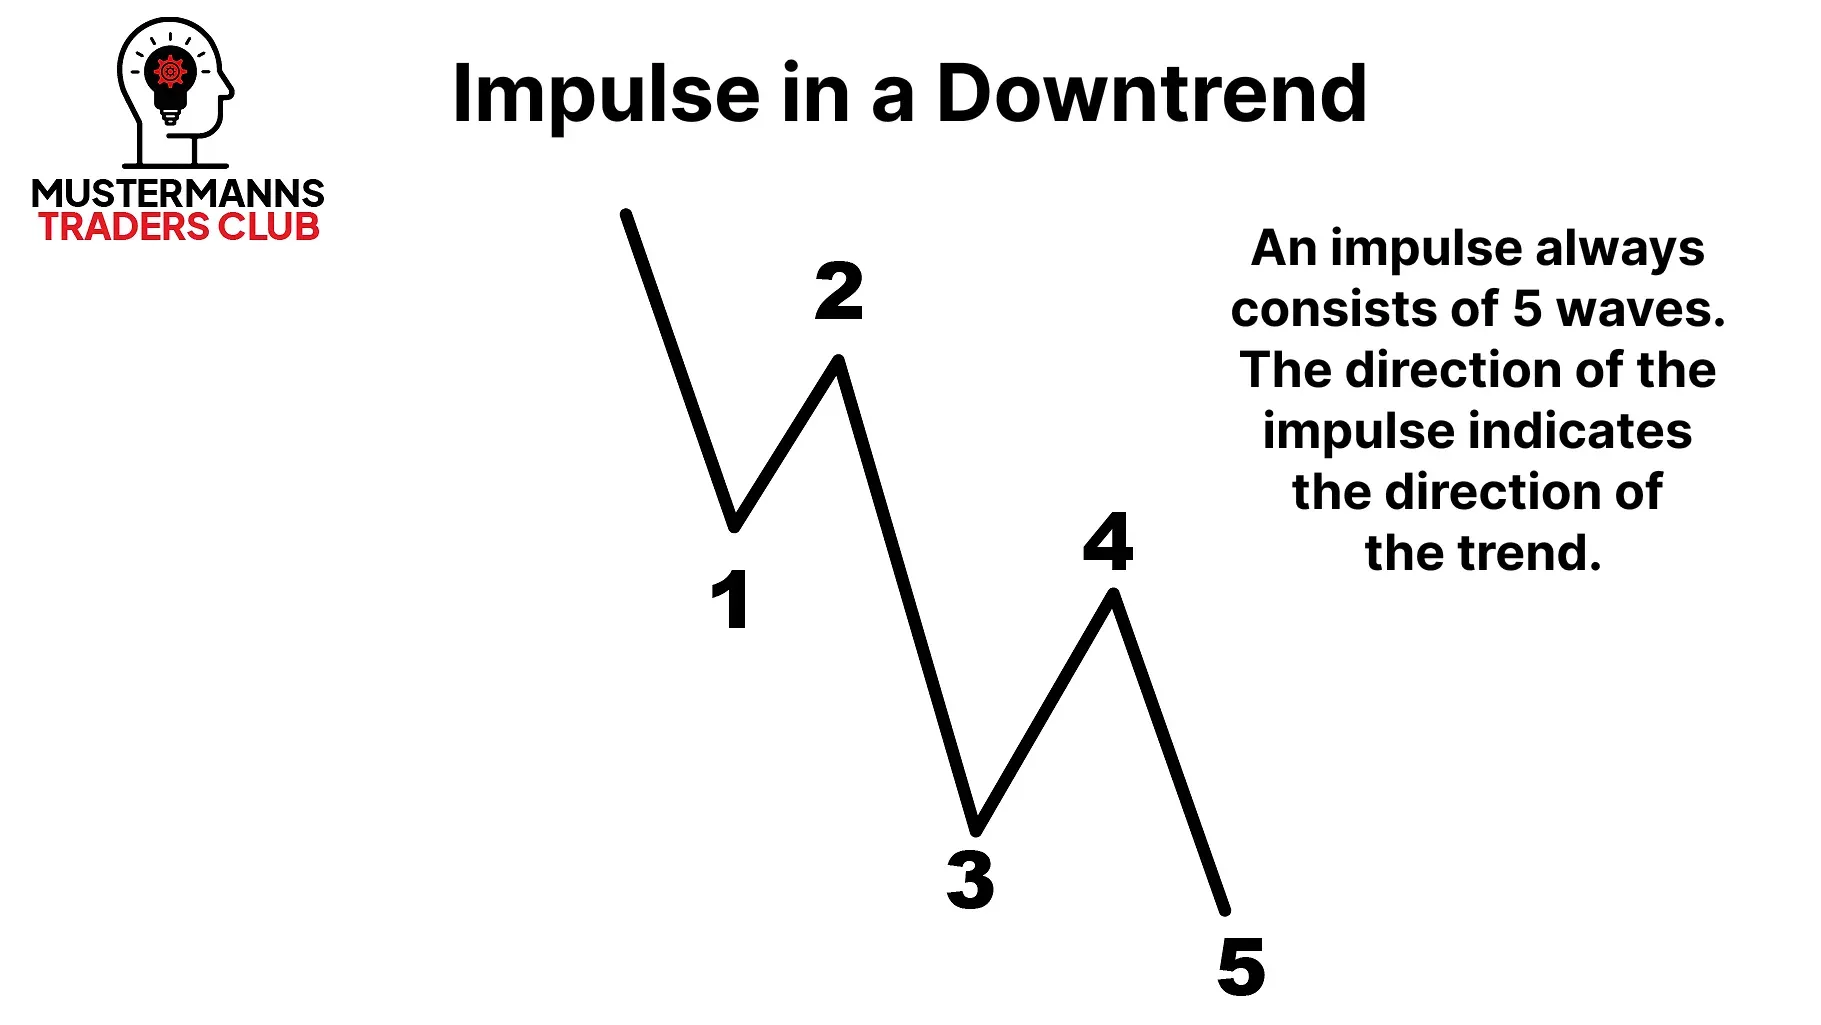
Waves 1, 3 and 5 define the basic direction of the trend movement (impulse), while waves 2 and 4 are the so-called corrective movements. In other words, the impulse waves are the arrows that reach their target depending on the correction (tension of the bow).
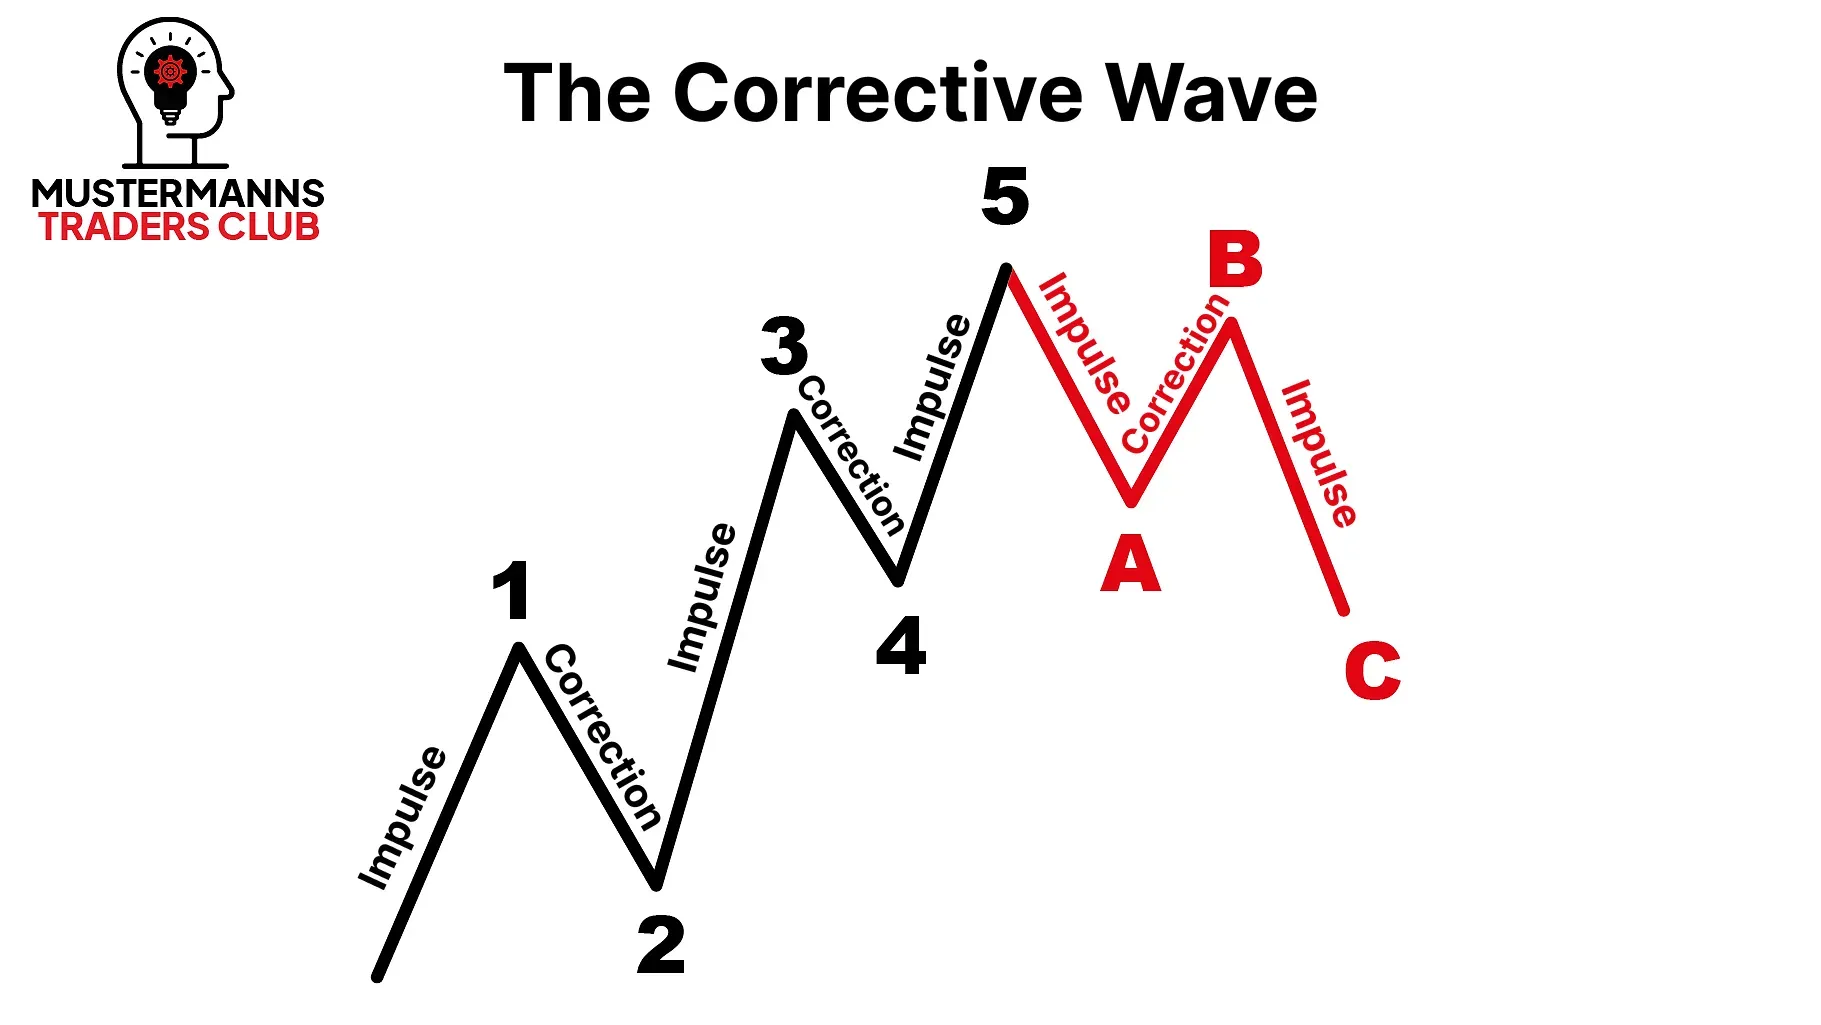
However, for an impulse to occur at all, an action is required first. In the case of the Elliot wave theory, we are talking about corrective waves 2 and 4.
In contrast to the impulse waves, these are usually more corrective and consist of different formations. More on this in detail later. In the following section, we will first look at the basic rules of the basic structure.
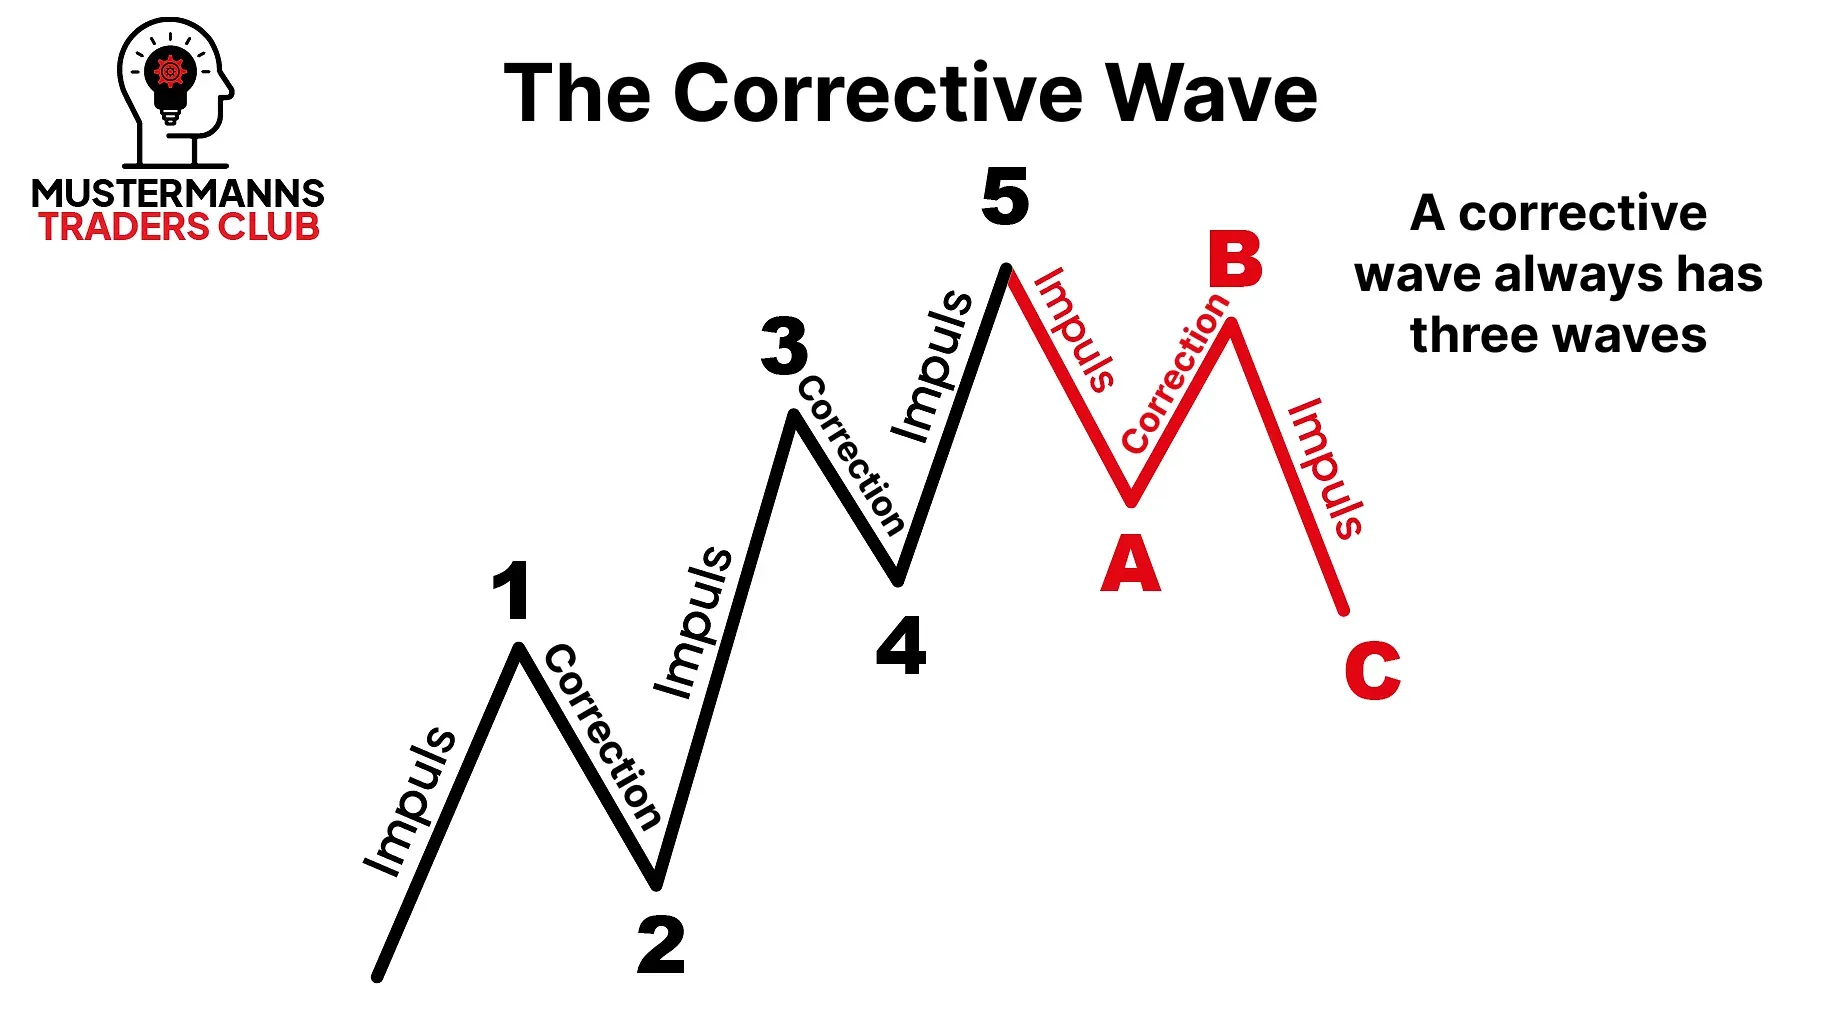
What is different here?
As you can see from the picture, the A-B-C correction wave also consists of impulses and corrections. The impulse waves can be found in waves A and C. A corrective movement can be found in wave B.
You can also see here that a wave 5 (impulse), unlike the impulses of waves 1 and 3, is not followed by a corrective wave. The corrective movement (wave A) also has five waves and is therefore also a subordinate impulse.
As you have probably already noticed above, impulse and corrective movements can always be broken down into smaller movements. Impulse movements always consist of a 5-wave movement, while corrective movements are made up of 3-wave movements. At Mustermann's Traders Club, we also like to talk about the "innards" of the larger, superordinate movement. Similar to an onion, a chart can be broken down to the smallest detail (<M1).
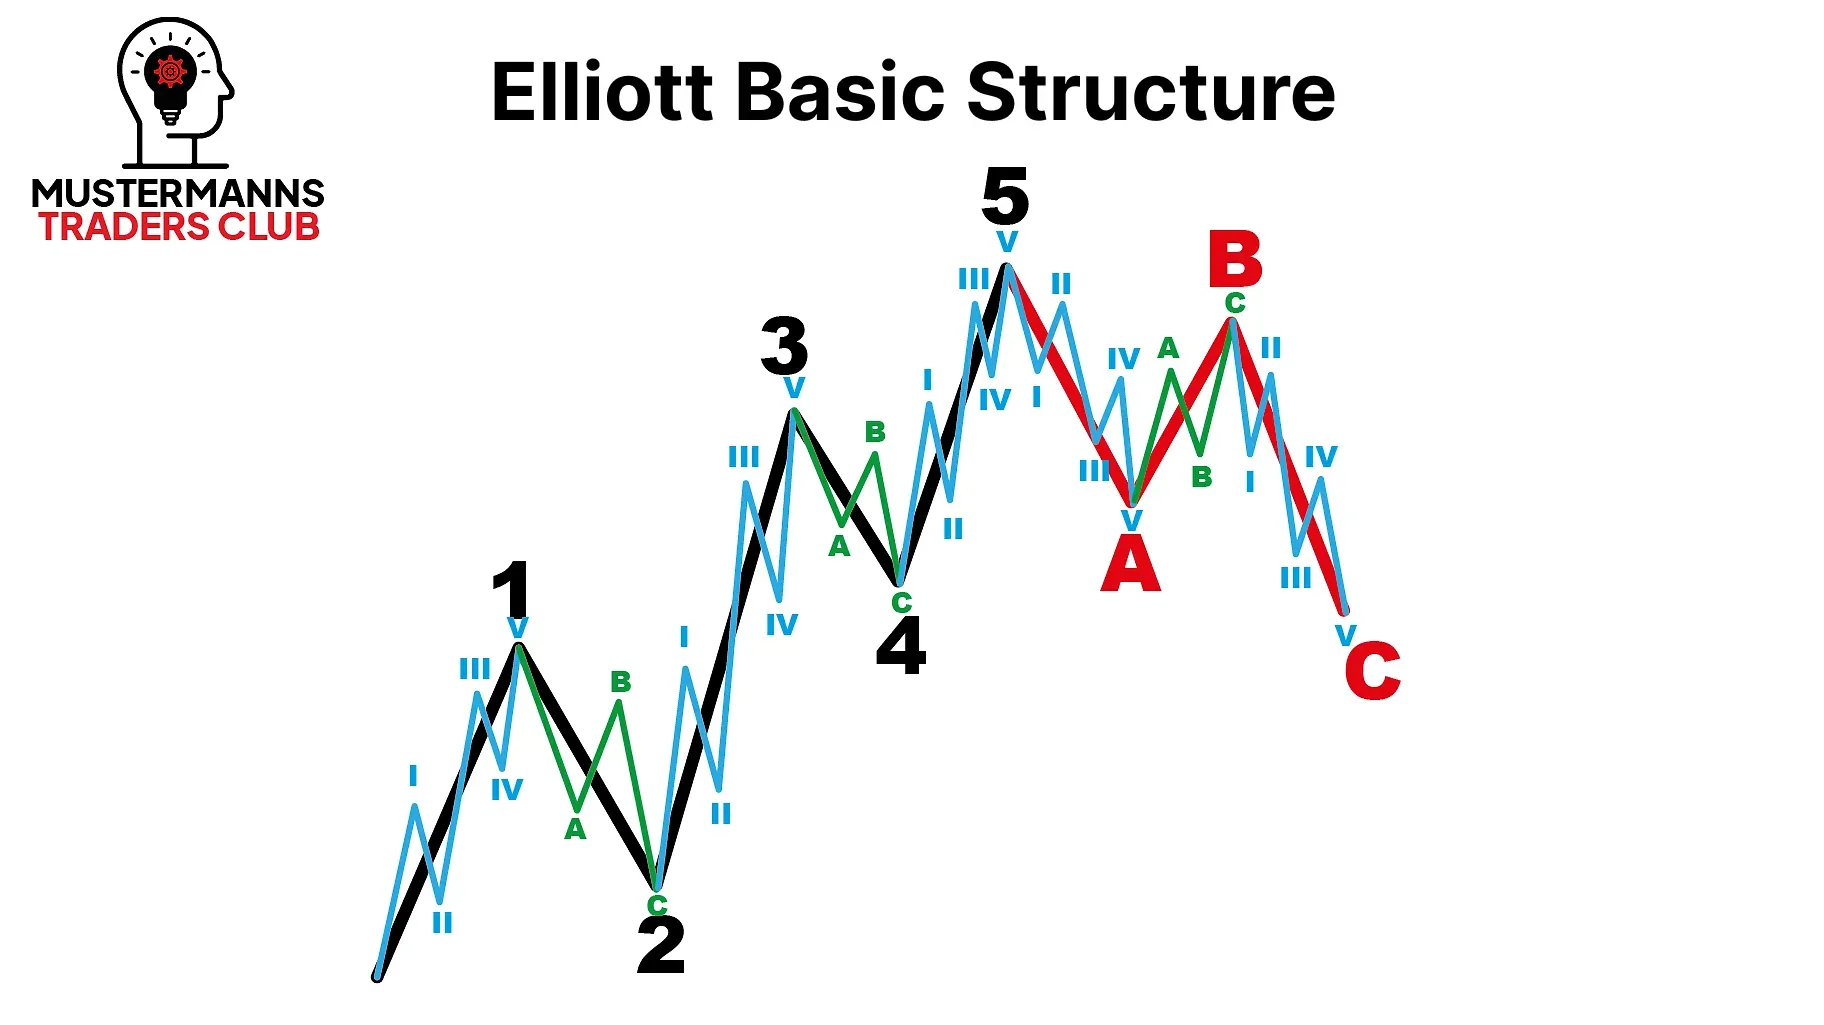
Elliott basic structure: The fractals of waves 1 and 2 consist of even smaller waves. Since you can also divide the yellow waves into even smaller waves, you can analyze the chart down to the smallest detail and define precise entry zones for your trading.
In this lesson, you have learned the basic structure of every chart according to Elliott. You now know that a chart is made up of impulses and corrections, and that these in turn are also made up of impulses and corrections.
We will build on this knowledge in the next lesson, which will deal with important rules that need to be respected when counting each chart.
An overview
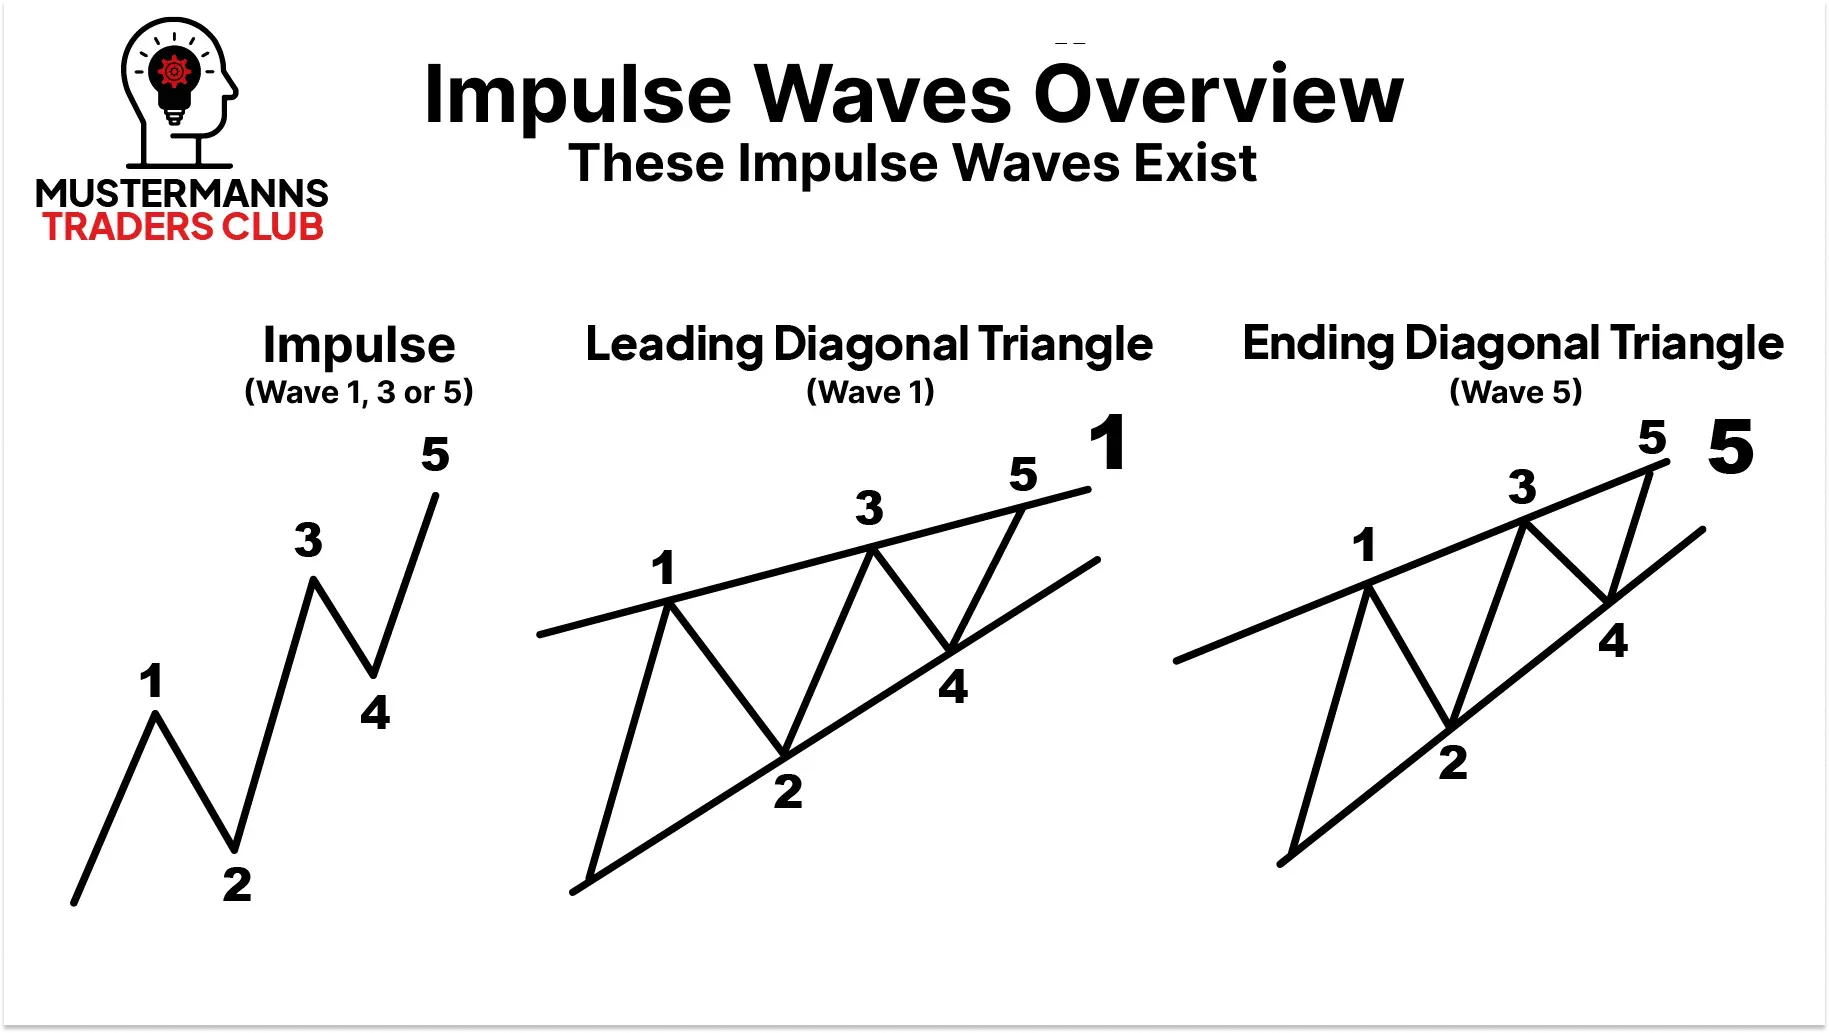
While the normal impulse is the most common of all three in the chart, the Leading Diagonal Triangle (referred to as LDT in the following) and the Ending Diagonal Triangle (EDT) can only be found in the chart in certain situations. They are therefore rarely found on the chart and are thus special cases of wave 1 or wave 5.
Unlike the impulse, the LDT can only form at the beginning of an impulse and therefore cannot be found in the third and fifth waves. In turn, the EDT can only be observed at the end of the impulse movement.
Basic rules
Even if every impulse wave has its own rules, there are basic rules that apply to every variant. Every Tradebuddy should be familiar with them.
If these rules are violated, you can be sure that the chart in question is not an impulse wave.
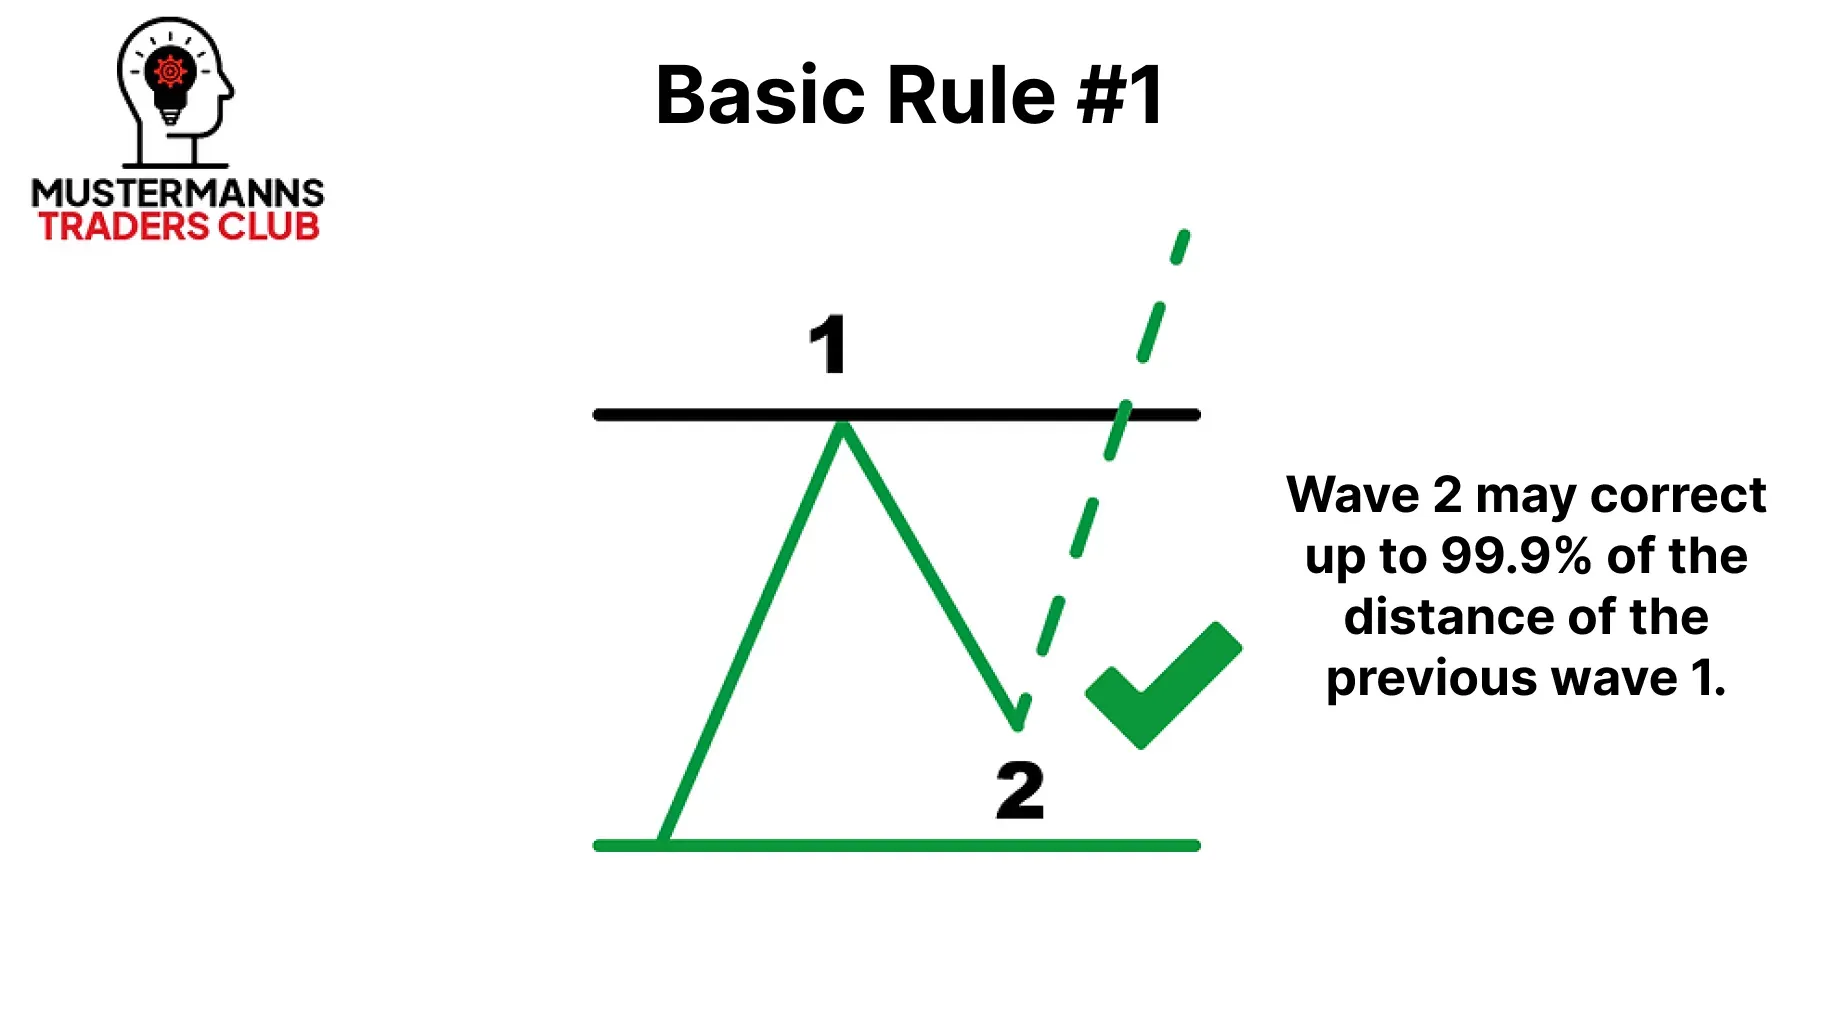
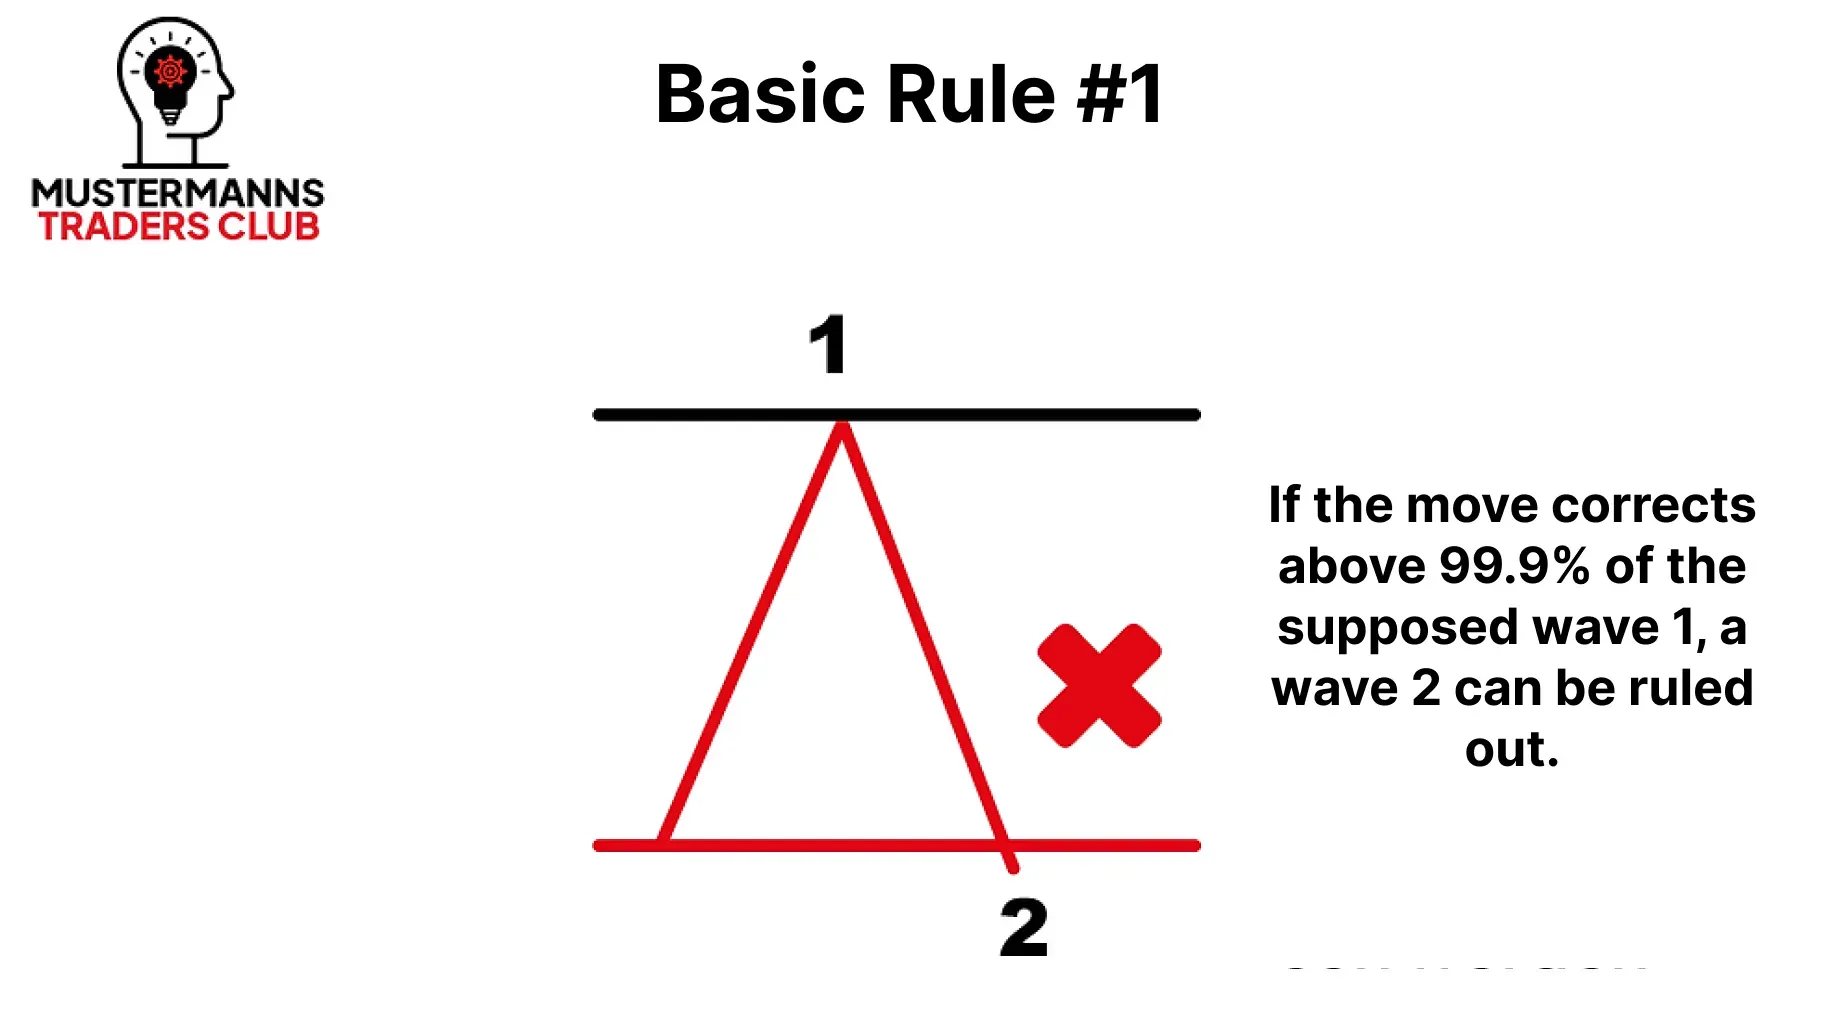
One of the most important rules for the impulse wave is the permitted correction level of the second wave. Wave 2 may only correct the first wave by a maximum of 99.9%. In other words, it may not intersect the origin of the impulse movement.
You can use these rules to narrow down the possible reversal points in the chart.
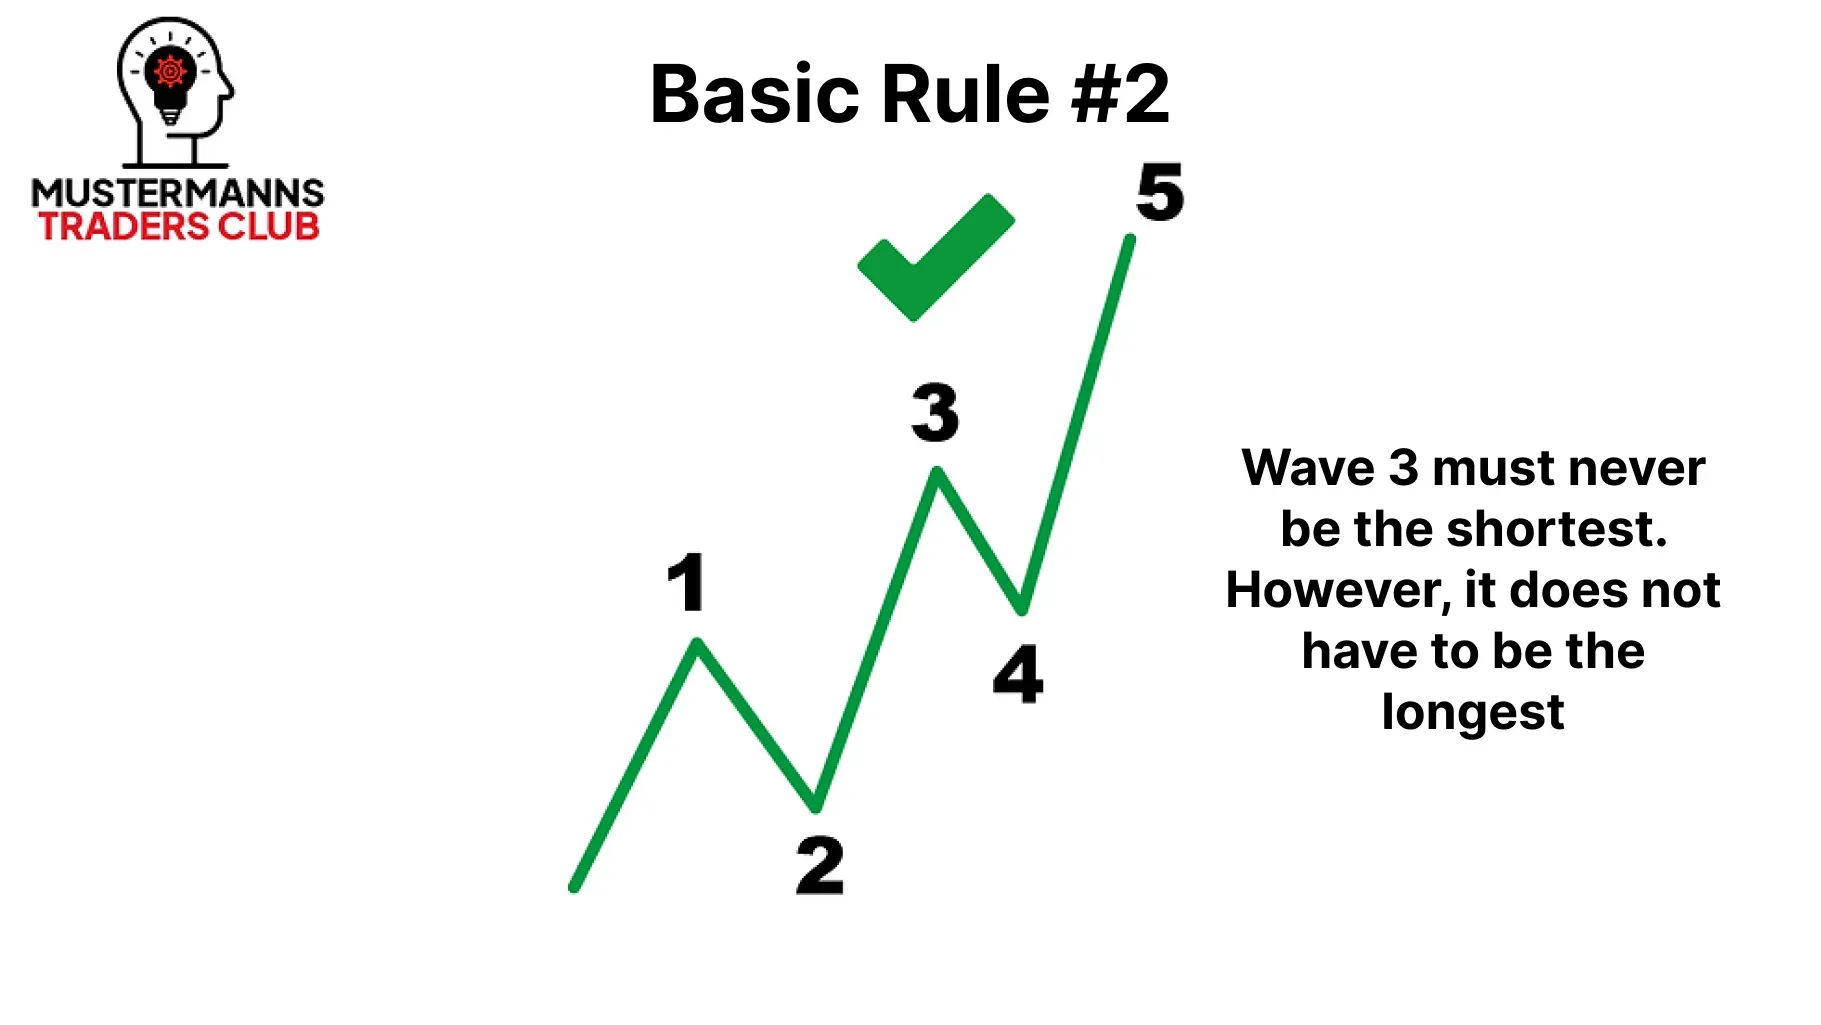
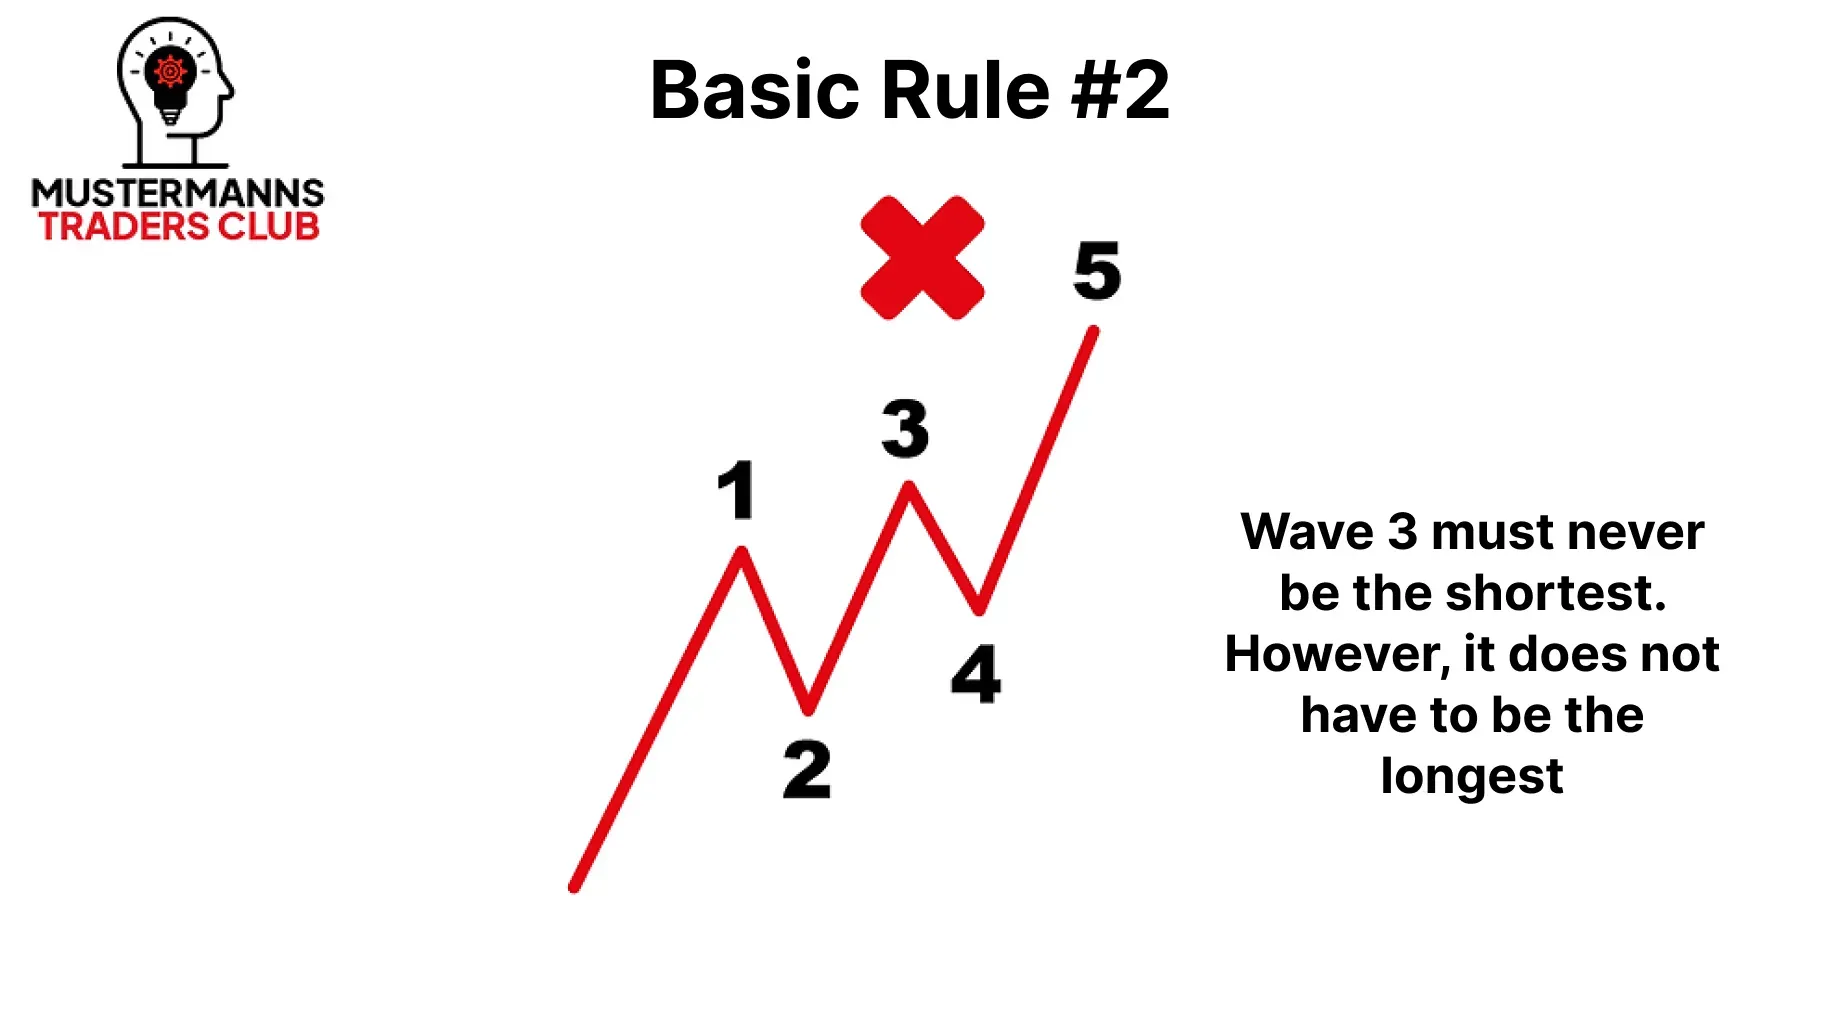
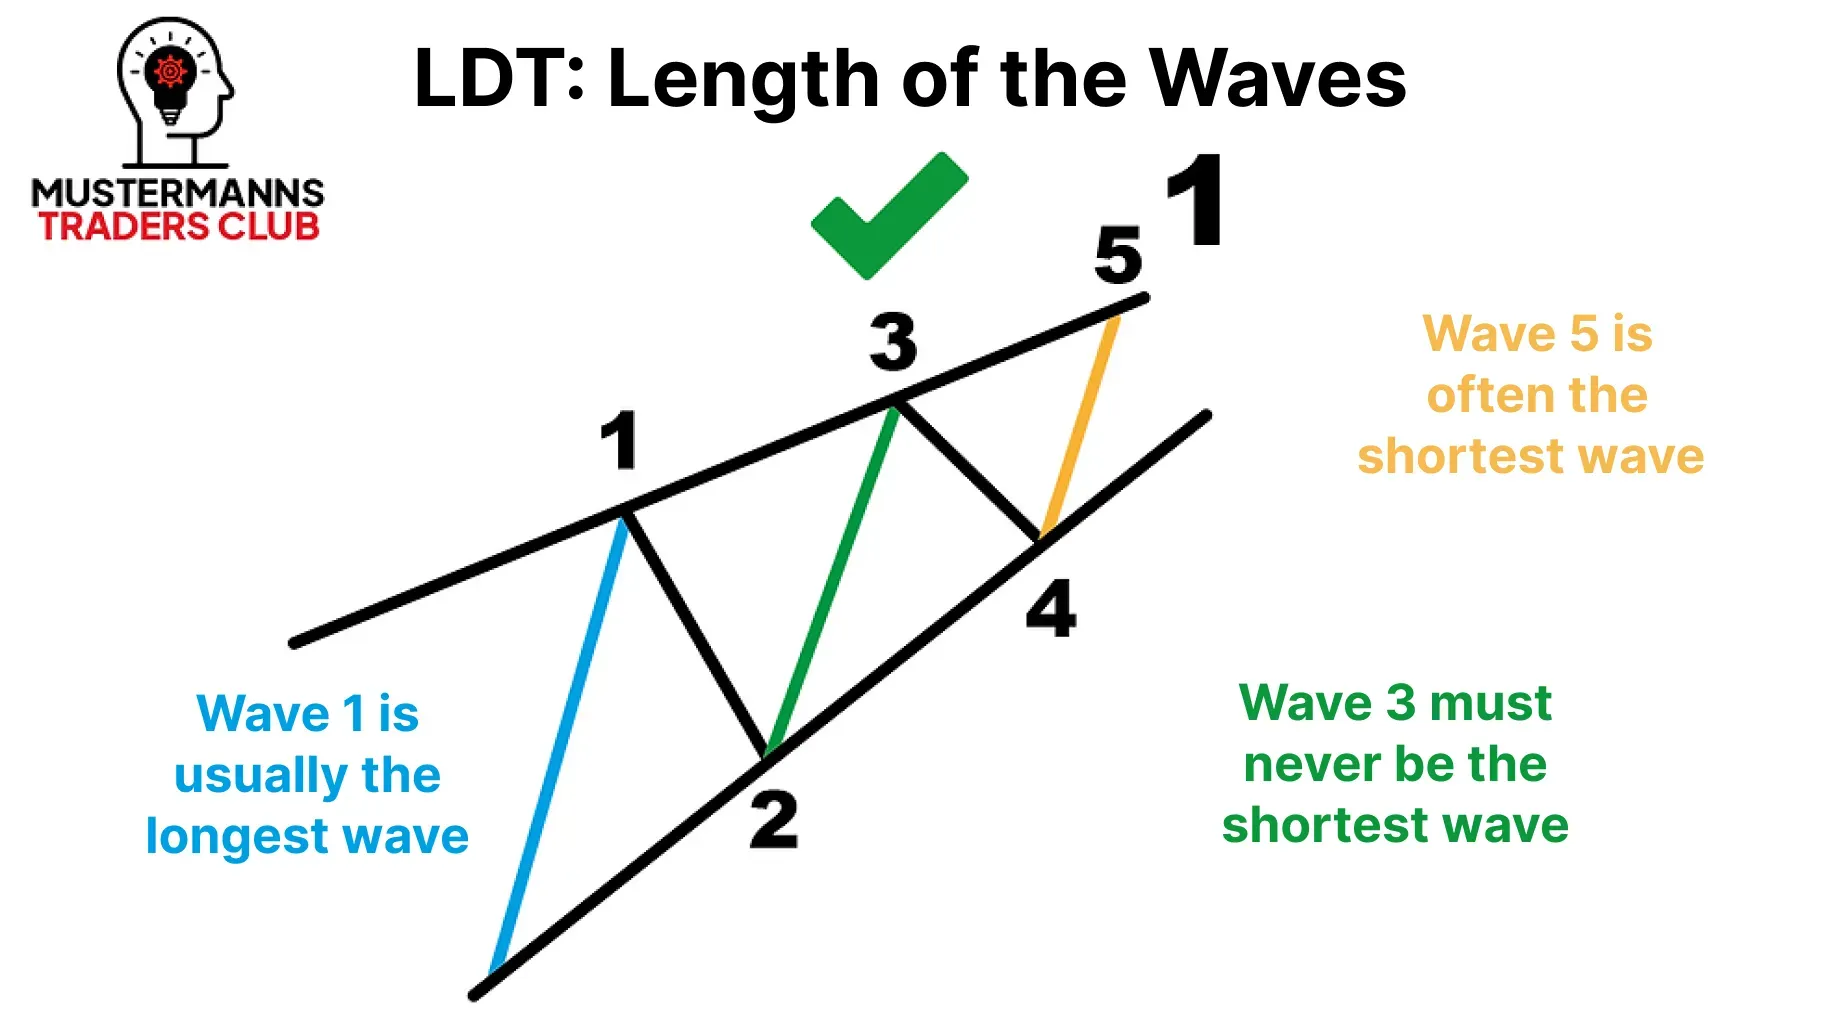
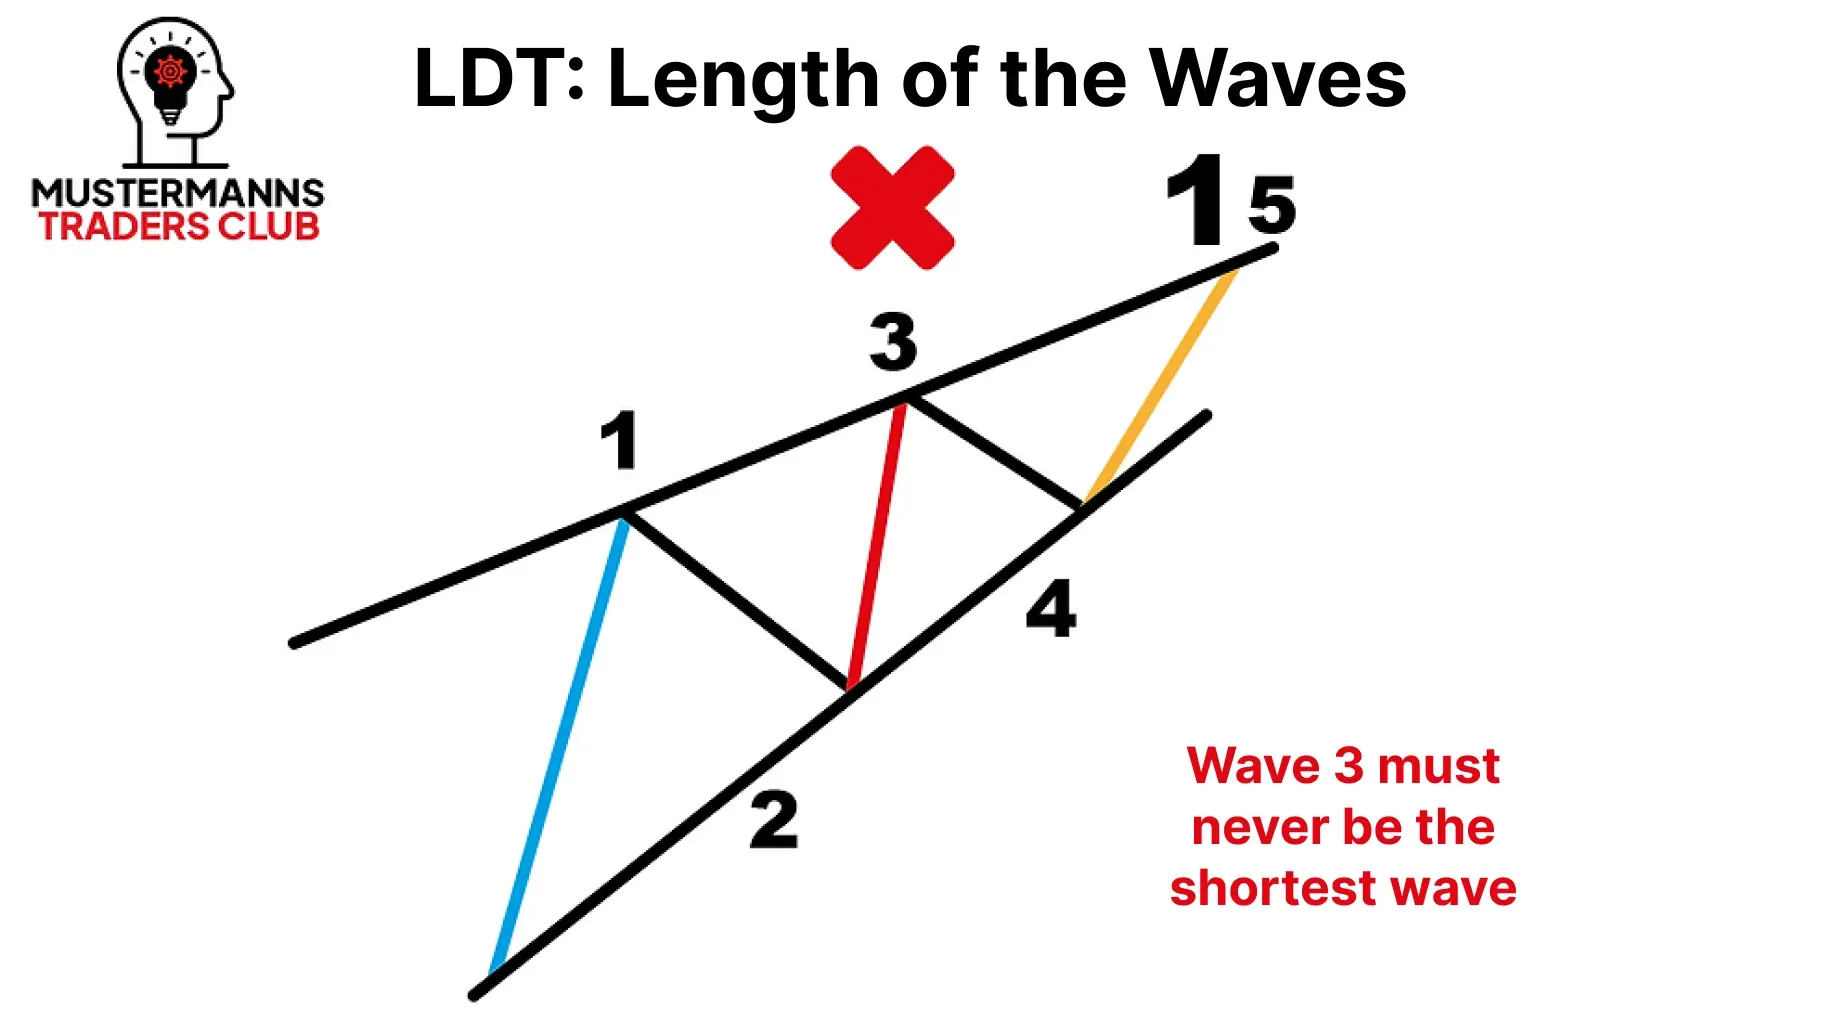
Wave 3 must never be the shortest wave. There is no exception to this rule. In your count, always make sure that wave 3 is of a certain size. Measurement tools from TakeProfit help you to precisely measure the price extension of the waves.
Impulse
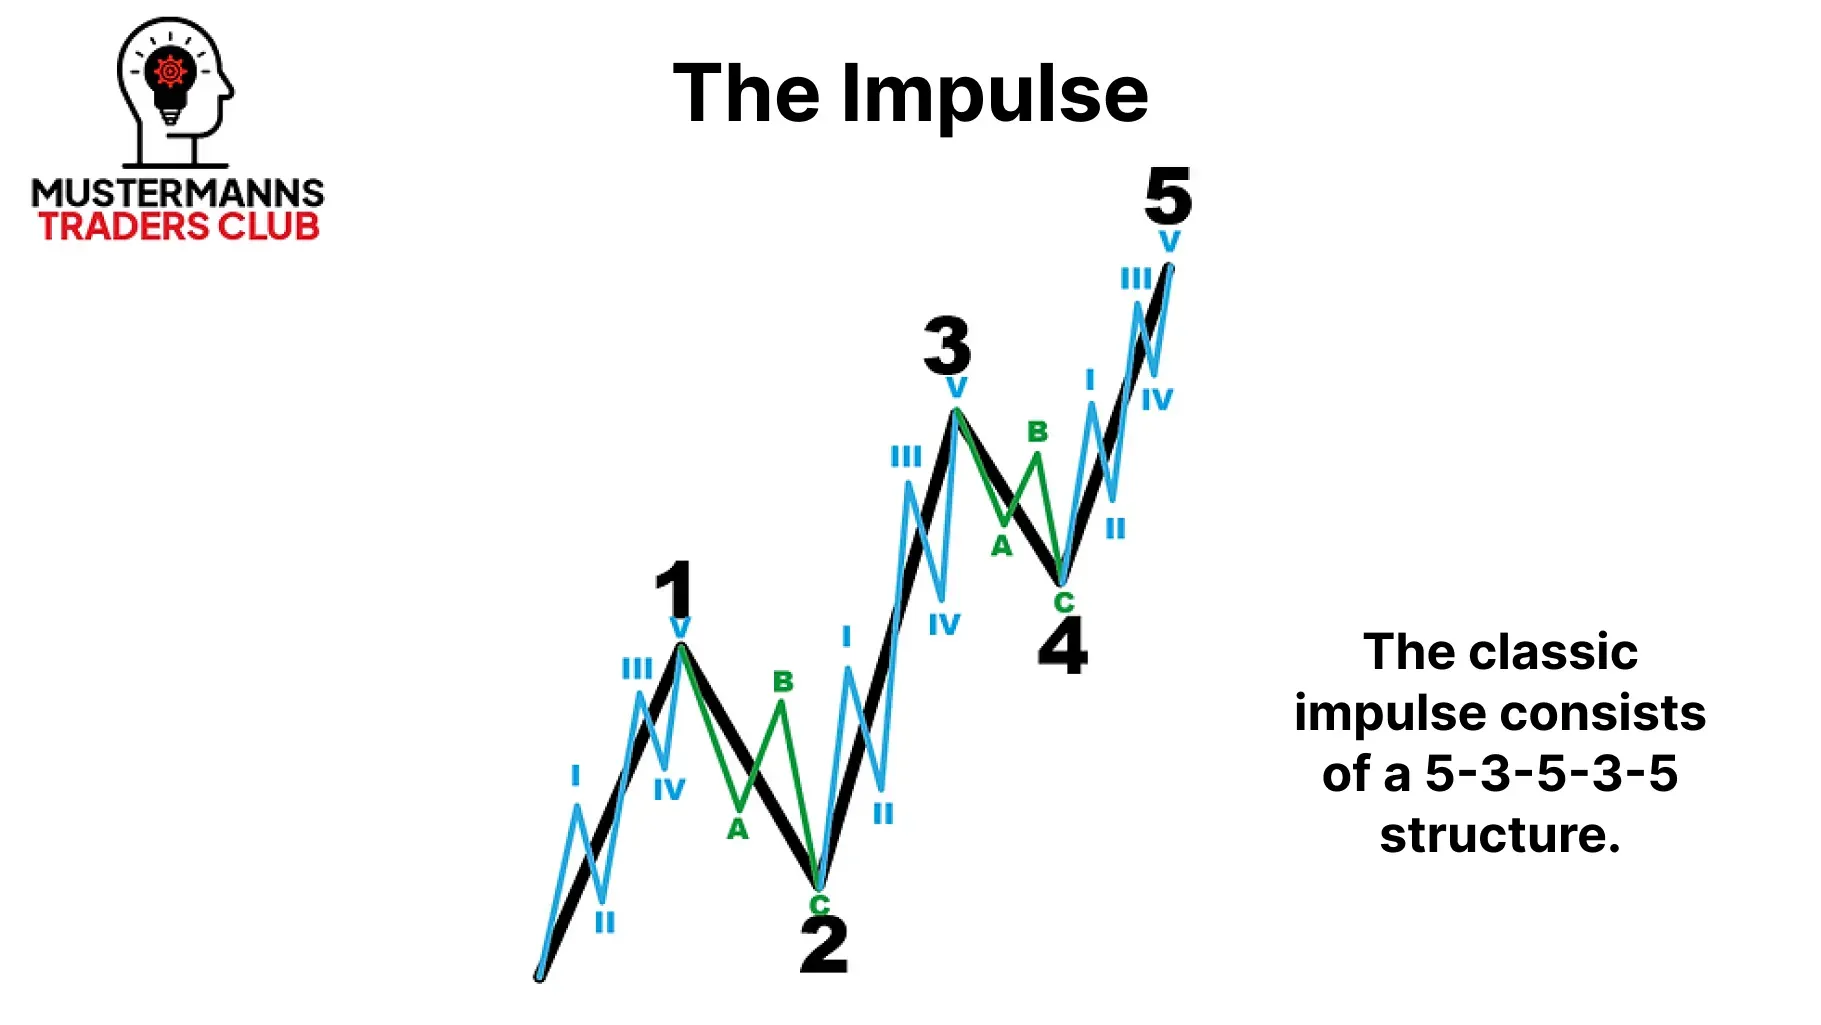
Let's first have a look at the normal impulse. Even if you have already dealt with the basic structure of Elliott waves in the basics, we want to repeat the structure at this point.
The impulse consists of a total of three impulse waves and two correction waves. This is where the term 5-3-5-3-5 comes from, with 5 standing for a five-wave impulse movement and 3 for a correction wave, which is usually three waves.
But how is momentum structured in detail? Which impulse waves and different correction waves can be found in it?
The Beginning - Wave 1
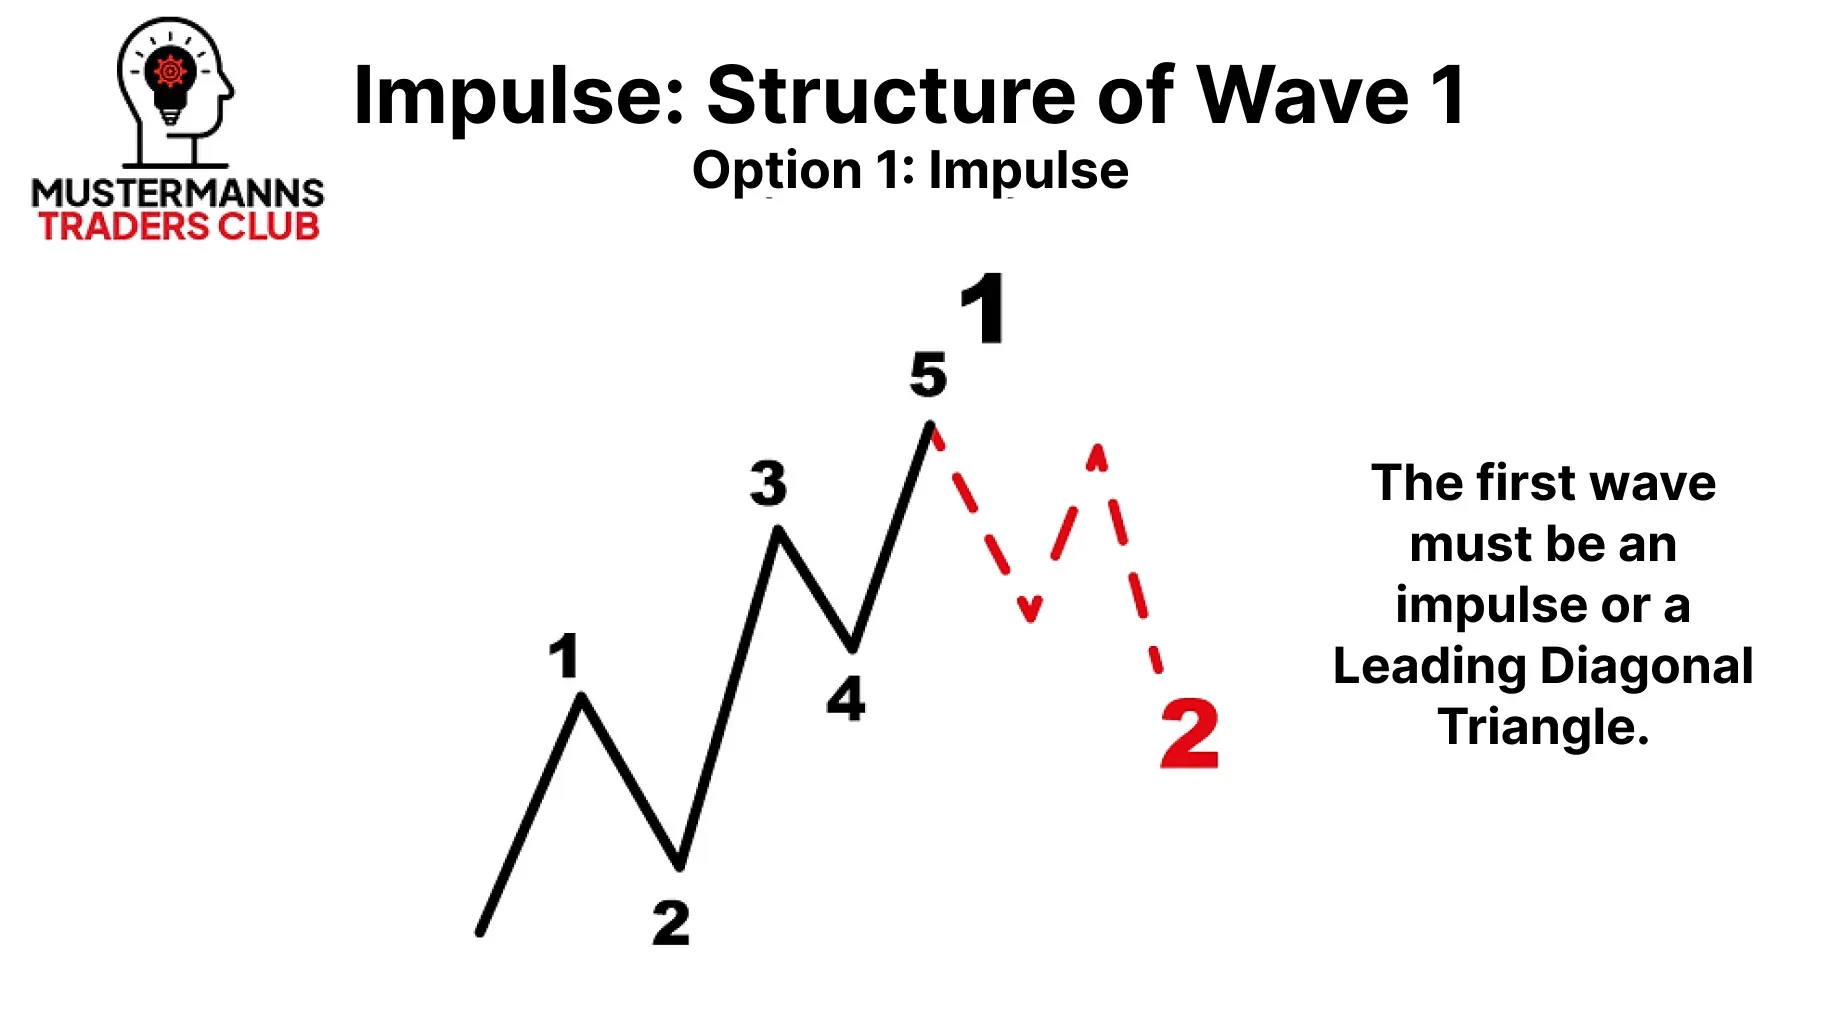
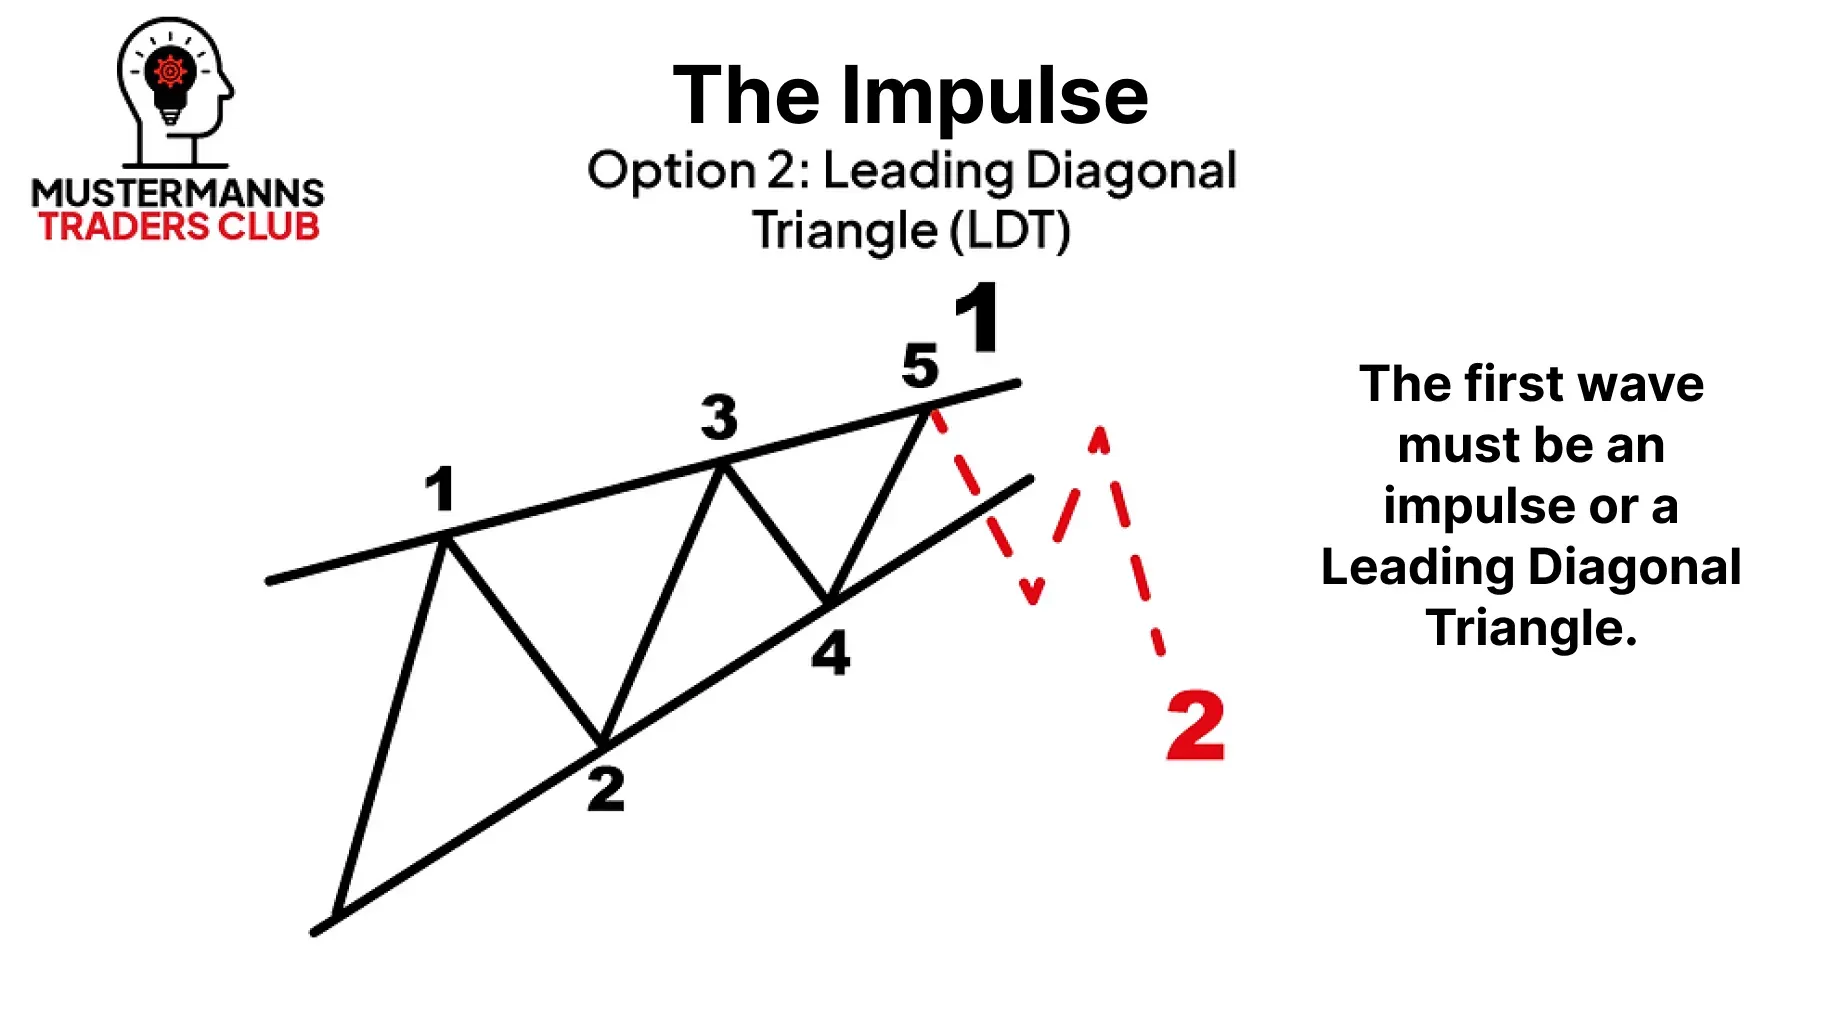
The first movement in an impulse is itself a five-wave impulse movement. You can find another impulse or a Leading Diagonal Triangle in wave 1 itself.
The Reaction - Wave 2
The first wave is followed by a breather in the form of a correction wave. As already mentioned, this is usually three waves in the form of a ZigZag. However, the first wave can also consist of more complex corrections, which do not always have to have a three-wave structure. However, a triangle correction is excluded and not possible.
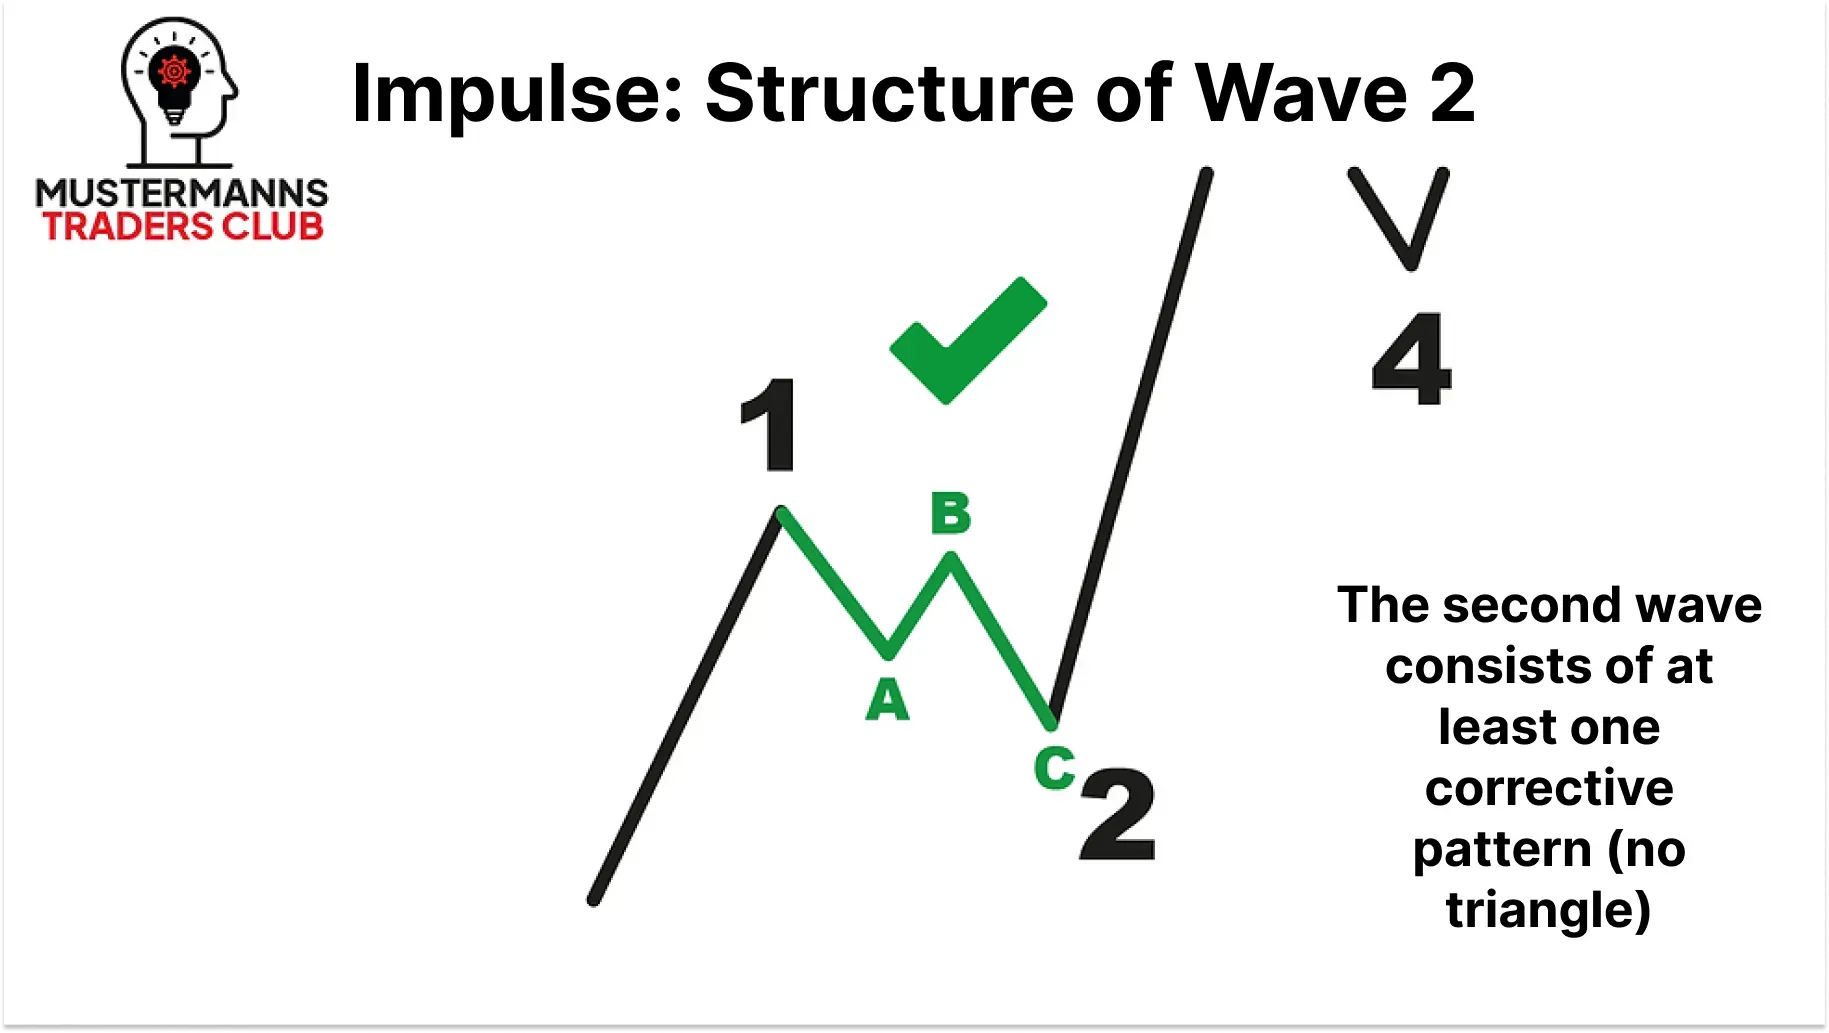
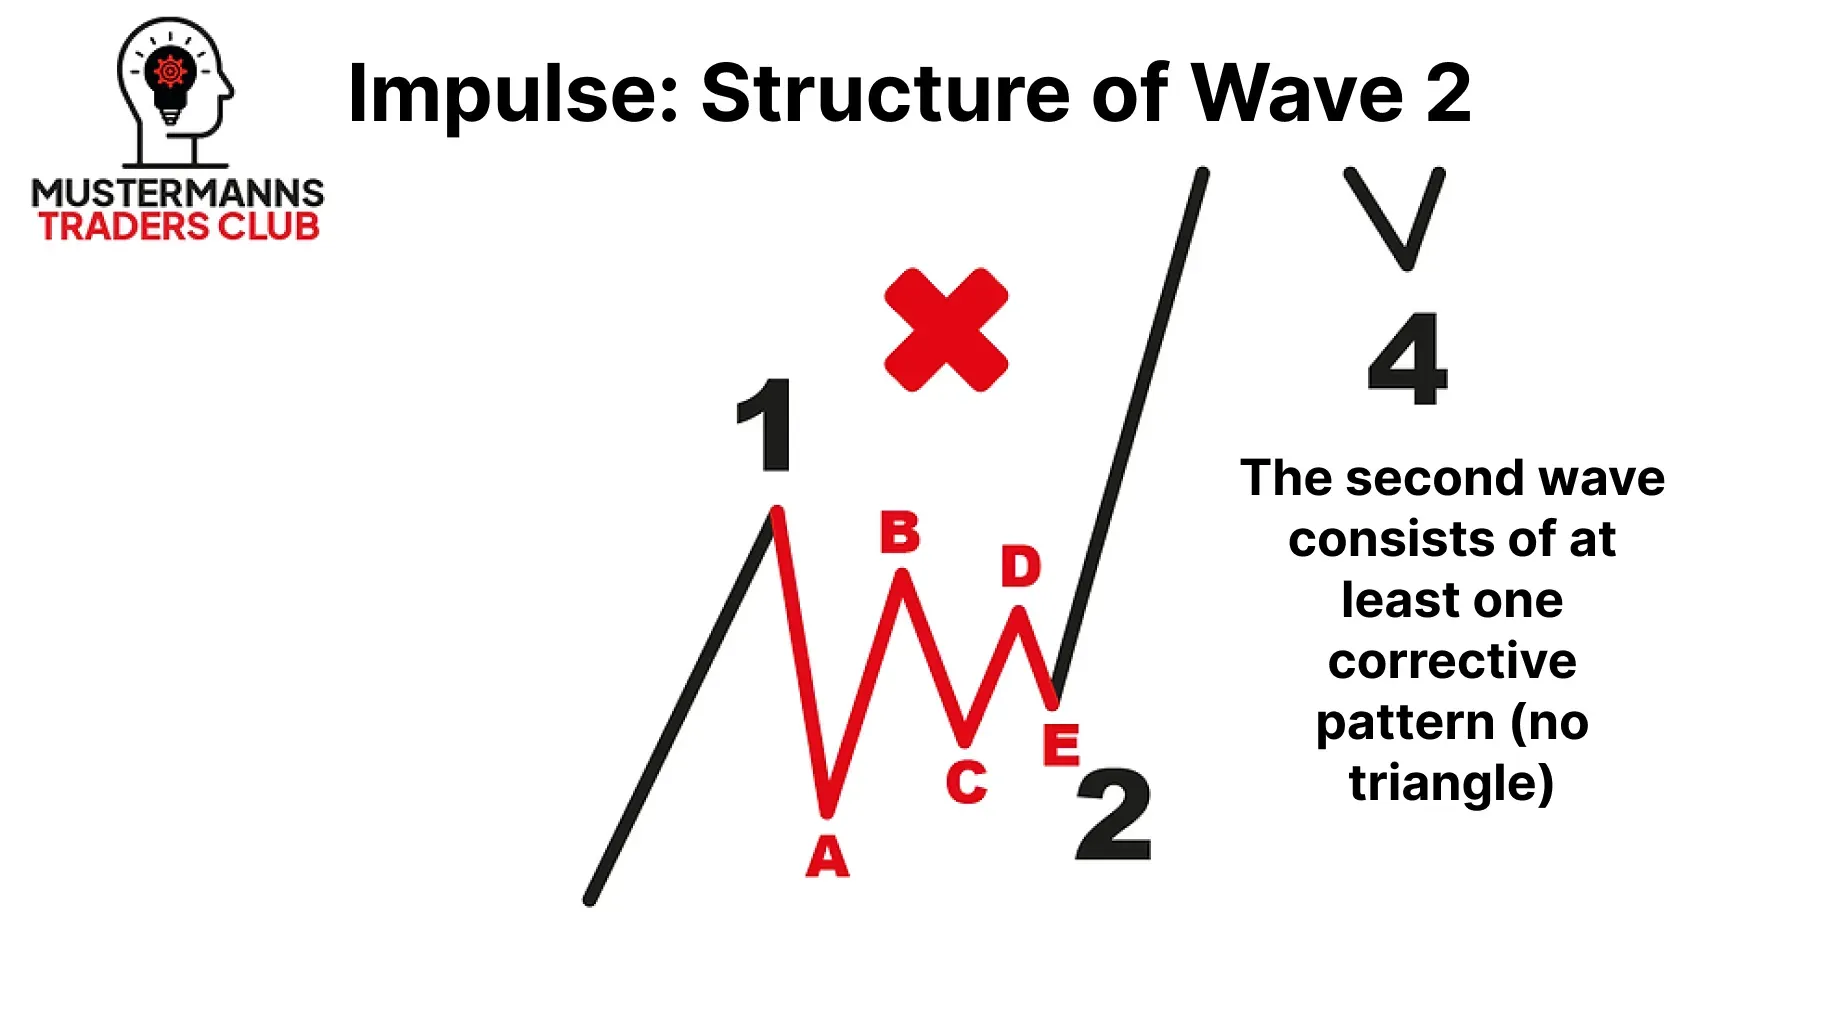
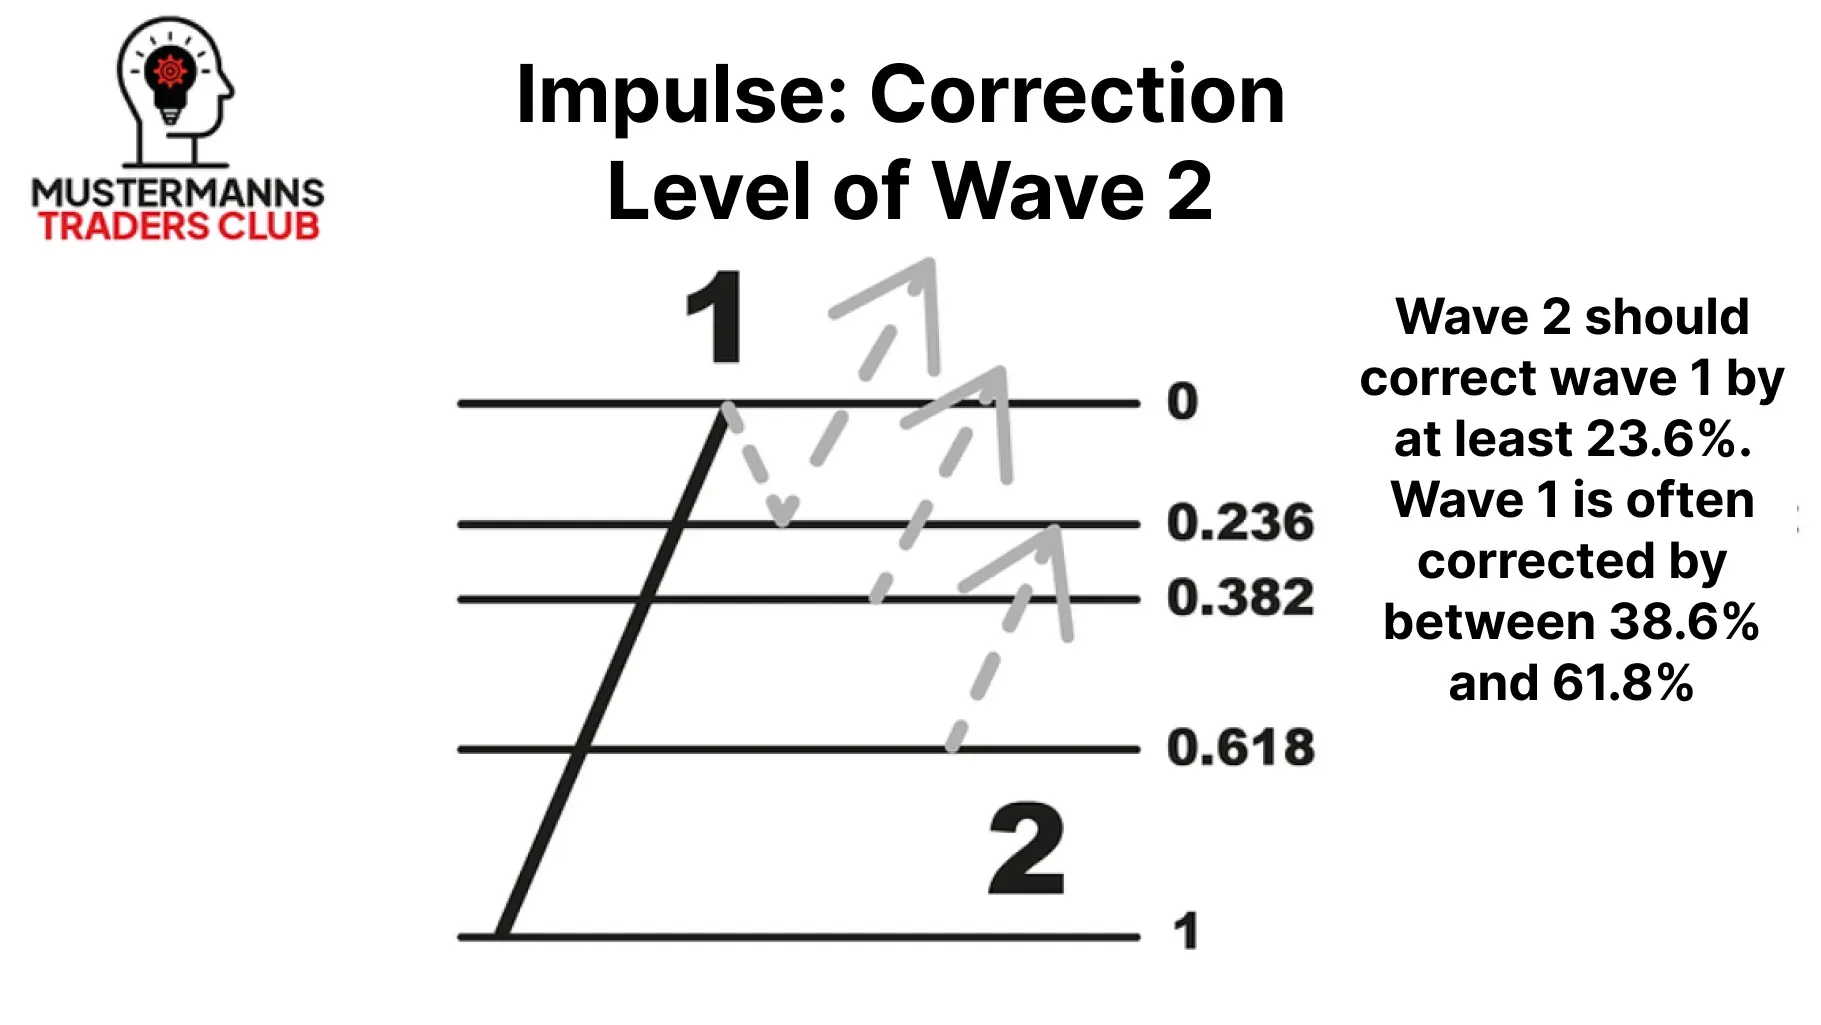
In addition to the structure of wave 2, the possible correction levels also play an important role. As already mentioned, in the basic rules for impulse waves, wave 2 must not intersect the origin of wave 1. Therefore, when analyzing, pay particular attention to the fact that the maximum correction is 99.9%.
A Rocket - Wave 3
Wave 3 is probably the most attractive wave to place a trade on an impulse. In most cases, it brings a strong movement to the market, which is often referred to as a "flagpole".
Fundamentally, wave 3 is typically accompanied by important news, such as quarterly figures, central bank meetings, labor market data, etc.
As a favorable entry into a wave 3 often promises an attractive risk/reward ratio, many buddies in the Mustermanns Traders Club attach great importance to analyzing the third wave in the chart.
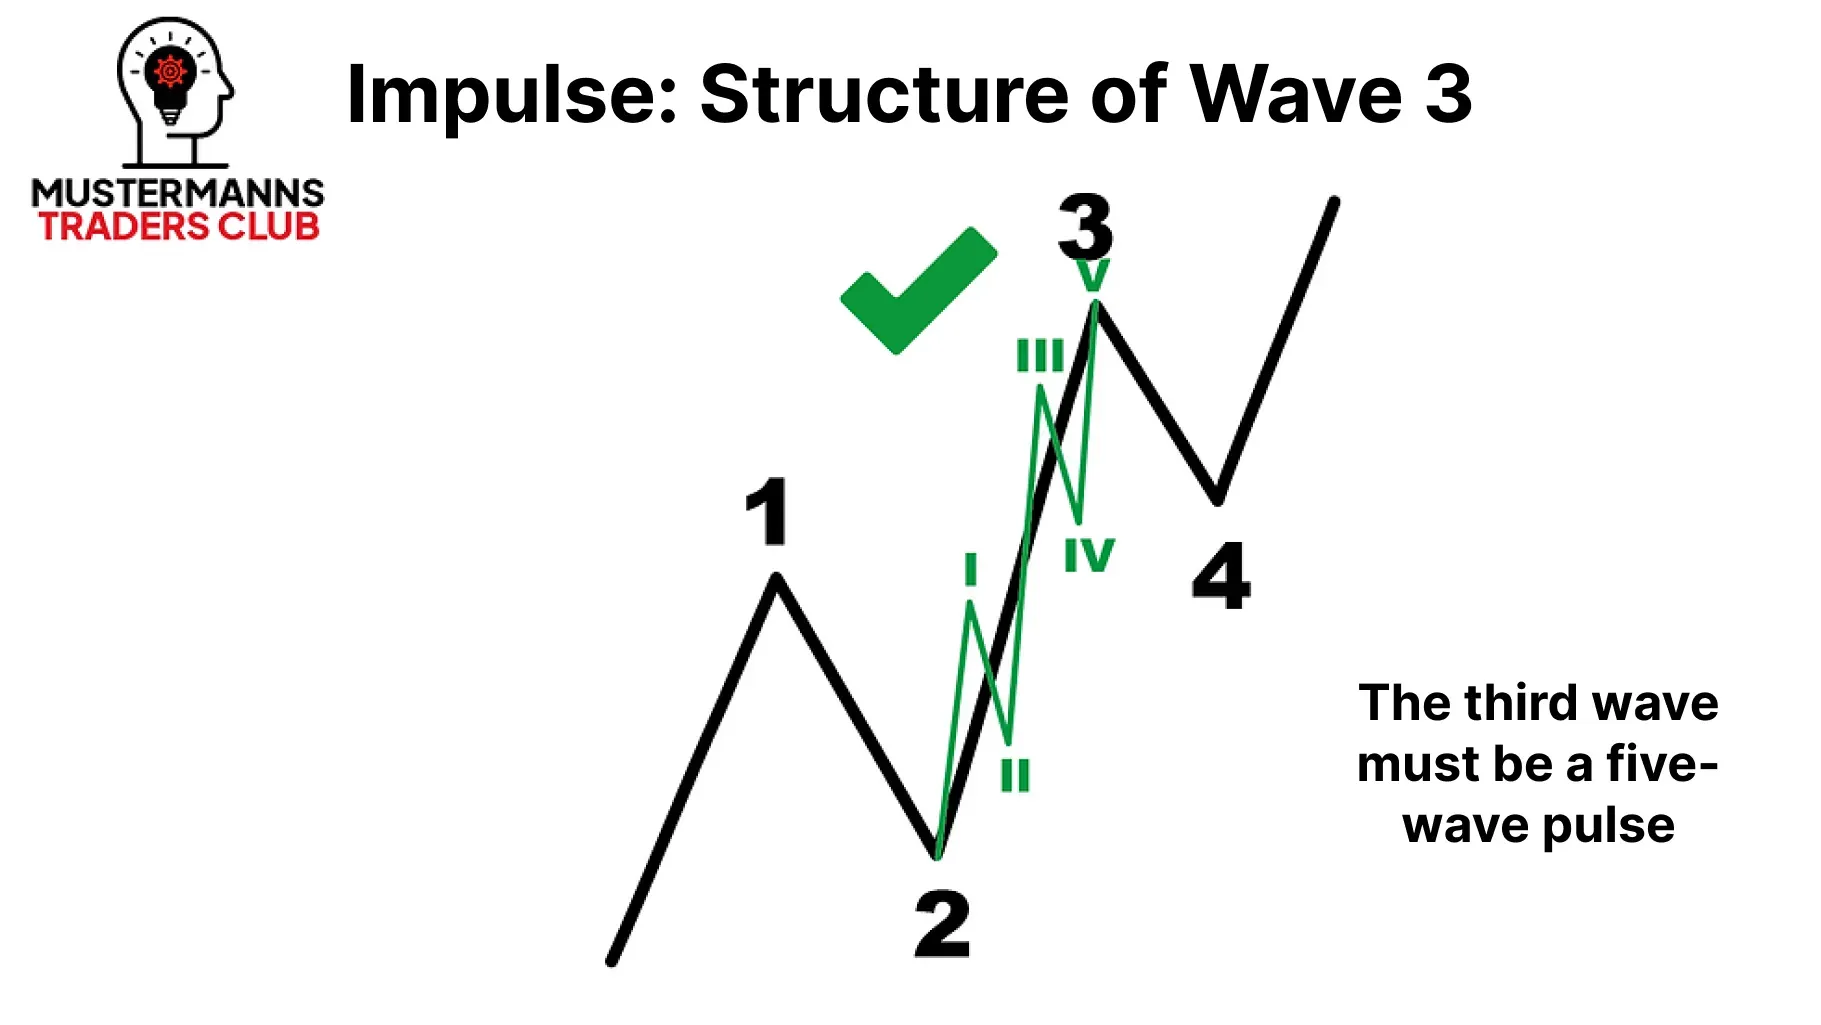
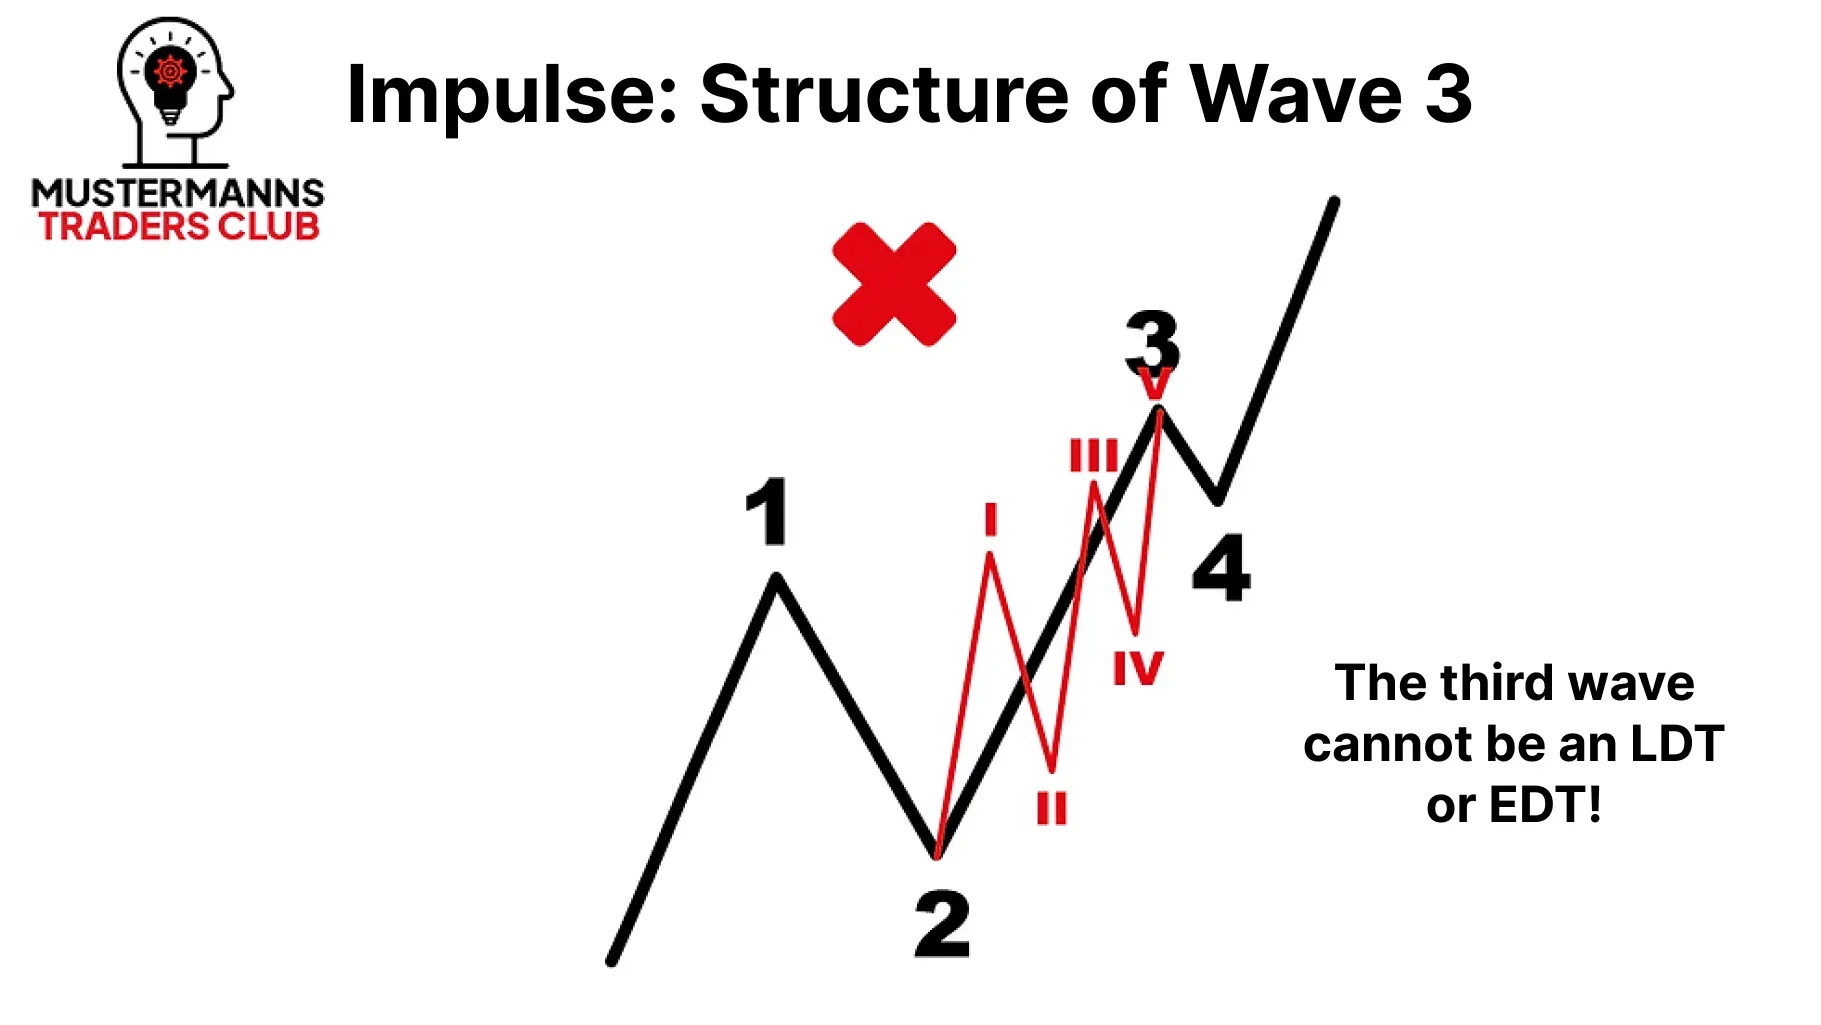
The third wave in an impulse can also consist of just one impulse. You can rule out an LDT or EDT here.
If you were able to realize your entry at the beginning of wave 3, you can use Fibonacci extensions to plan the targets for your trade. Fibonacci extensions should not be confused with Fibonacci retracements, which are usually used in harmonic analysis.
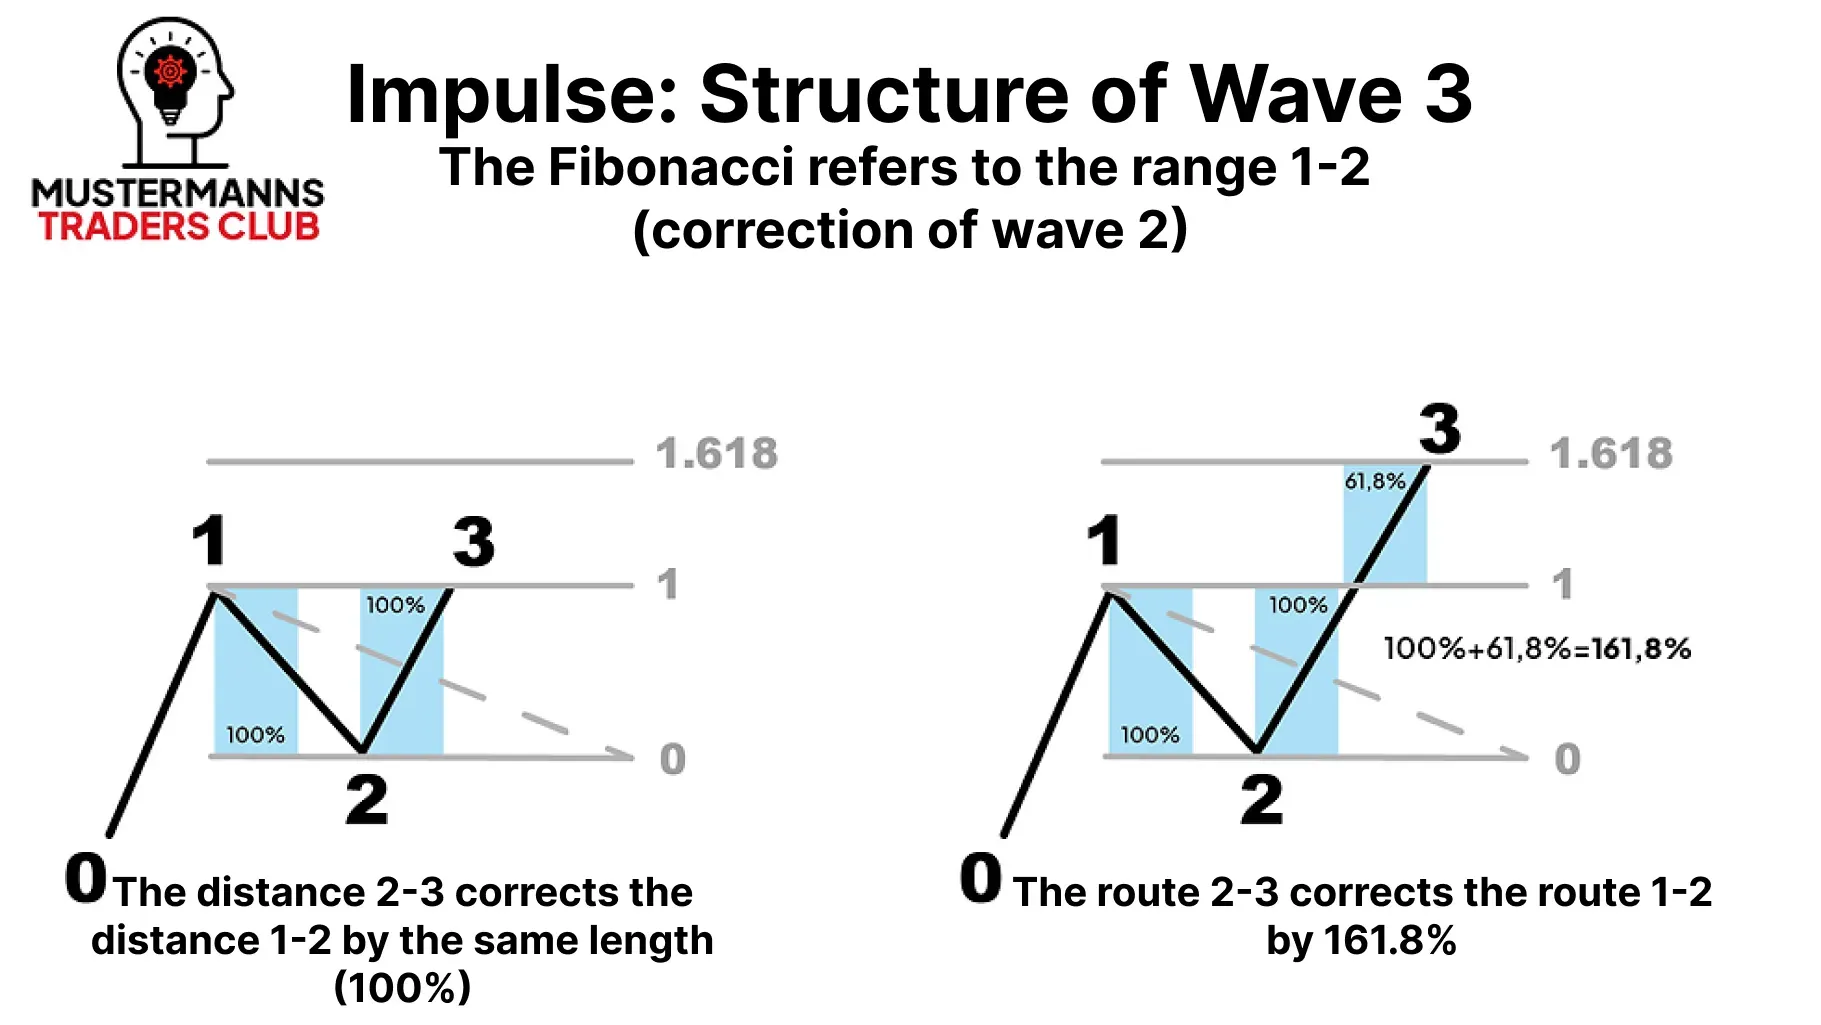
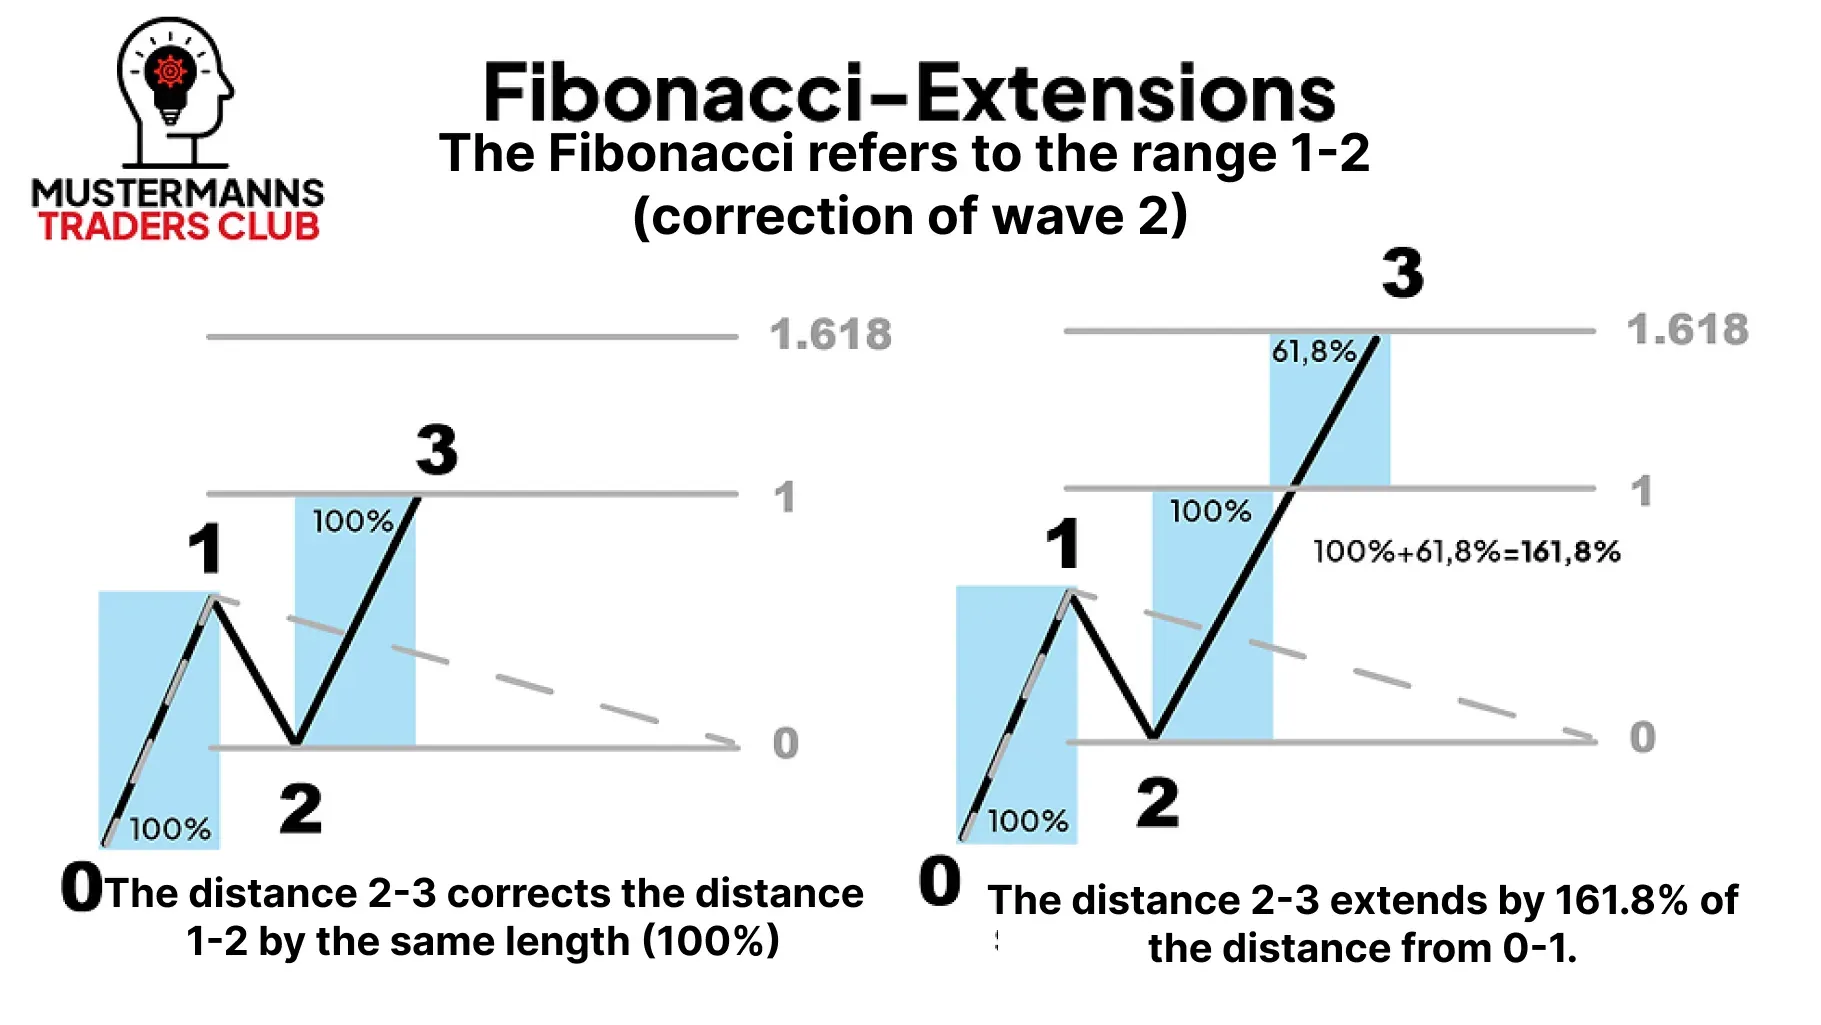
As you can see in the illustration, extension and retracement differ in the type of movement they compare with each other.
In the case of an extension, the first movement - wave 1 in Elliott wave theory terms - is decisive, where the extension levels for wave 3 can be found.
Retracements, on the other hand, do not take into account the first movement, but the subsequent correction. In the case of the Elliott wave theory, this is correction wave 2.
Which tool you use to determine the target of your wave 3 therefore has a major influence on the price regions in which the targets can be found. When analyzing Elliott waves, always remember to use the "Trend-based Fib Extension" tool.
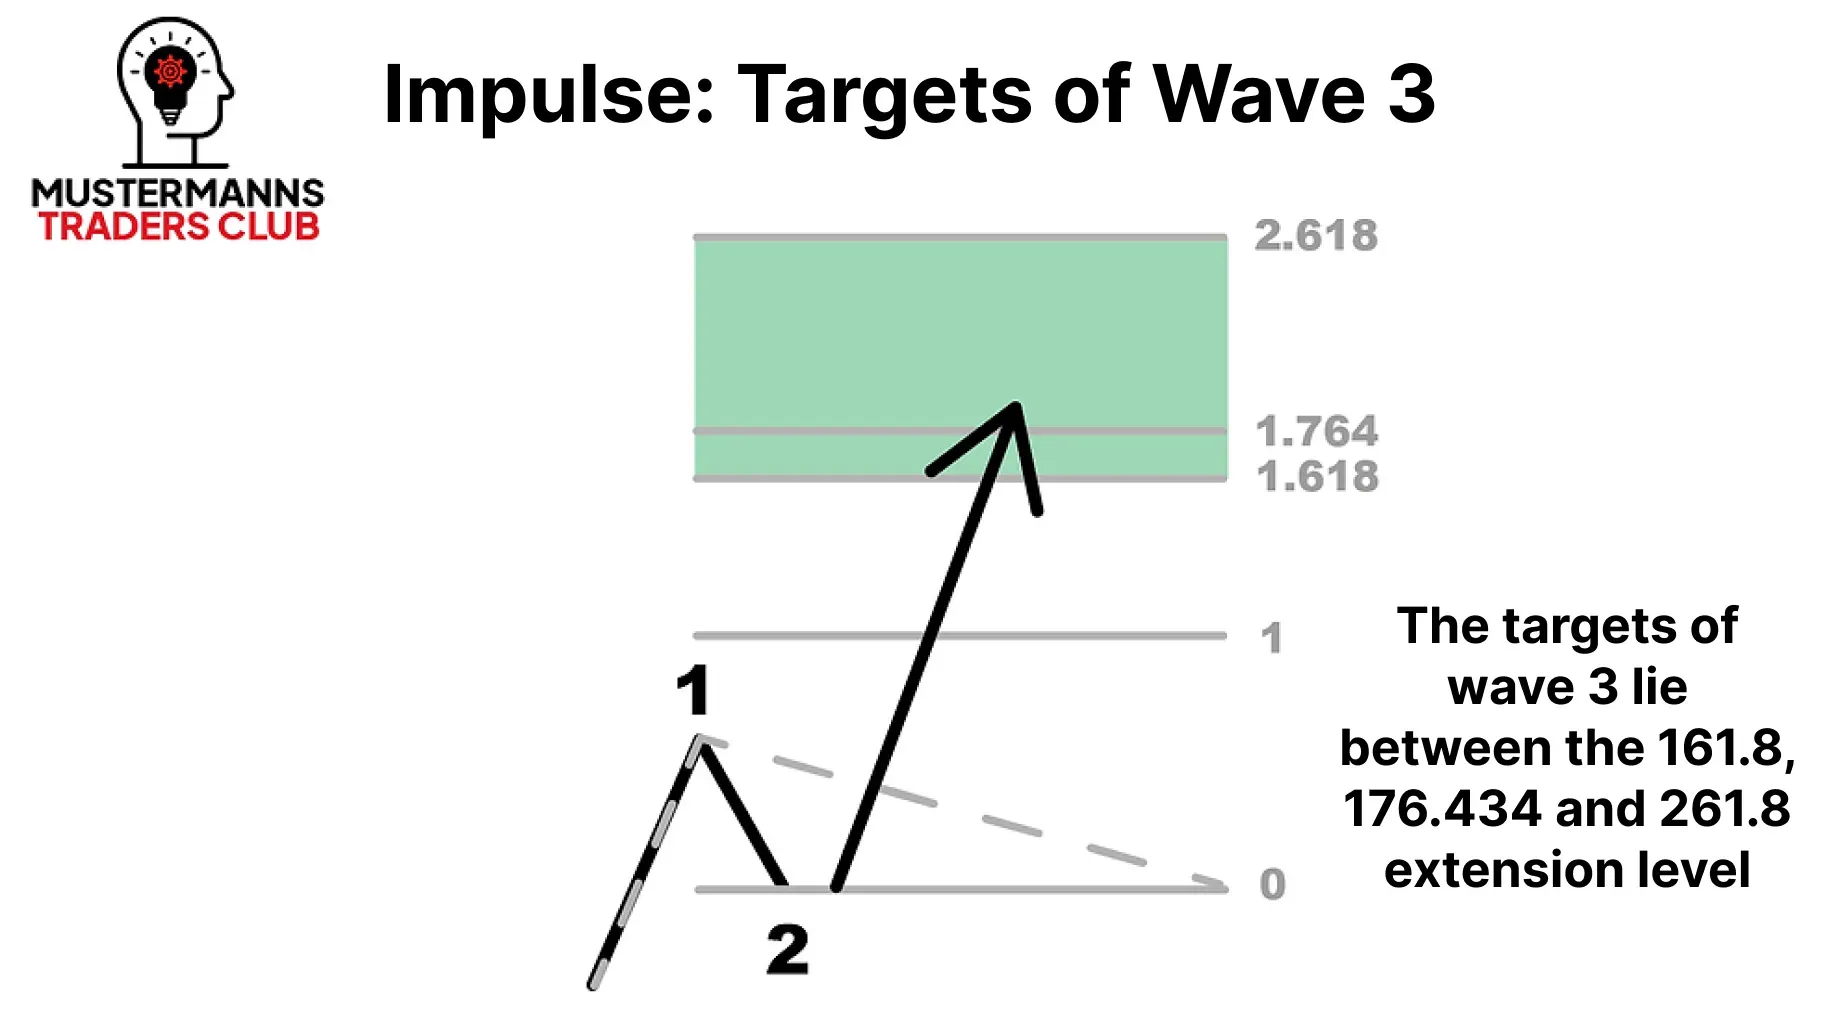
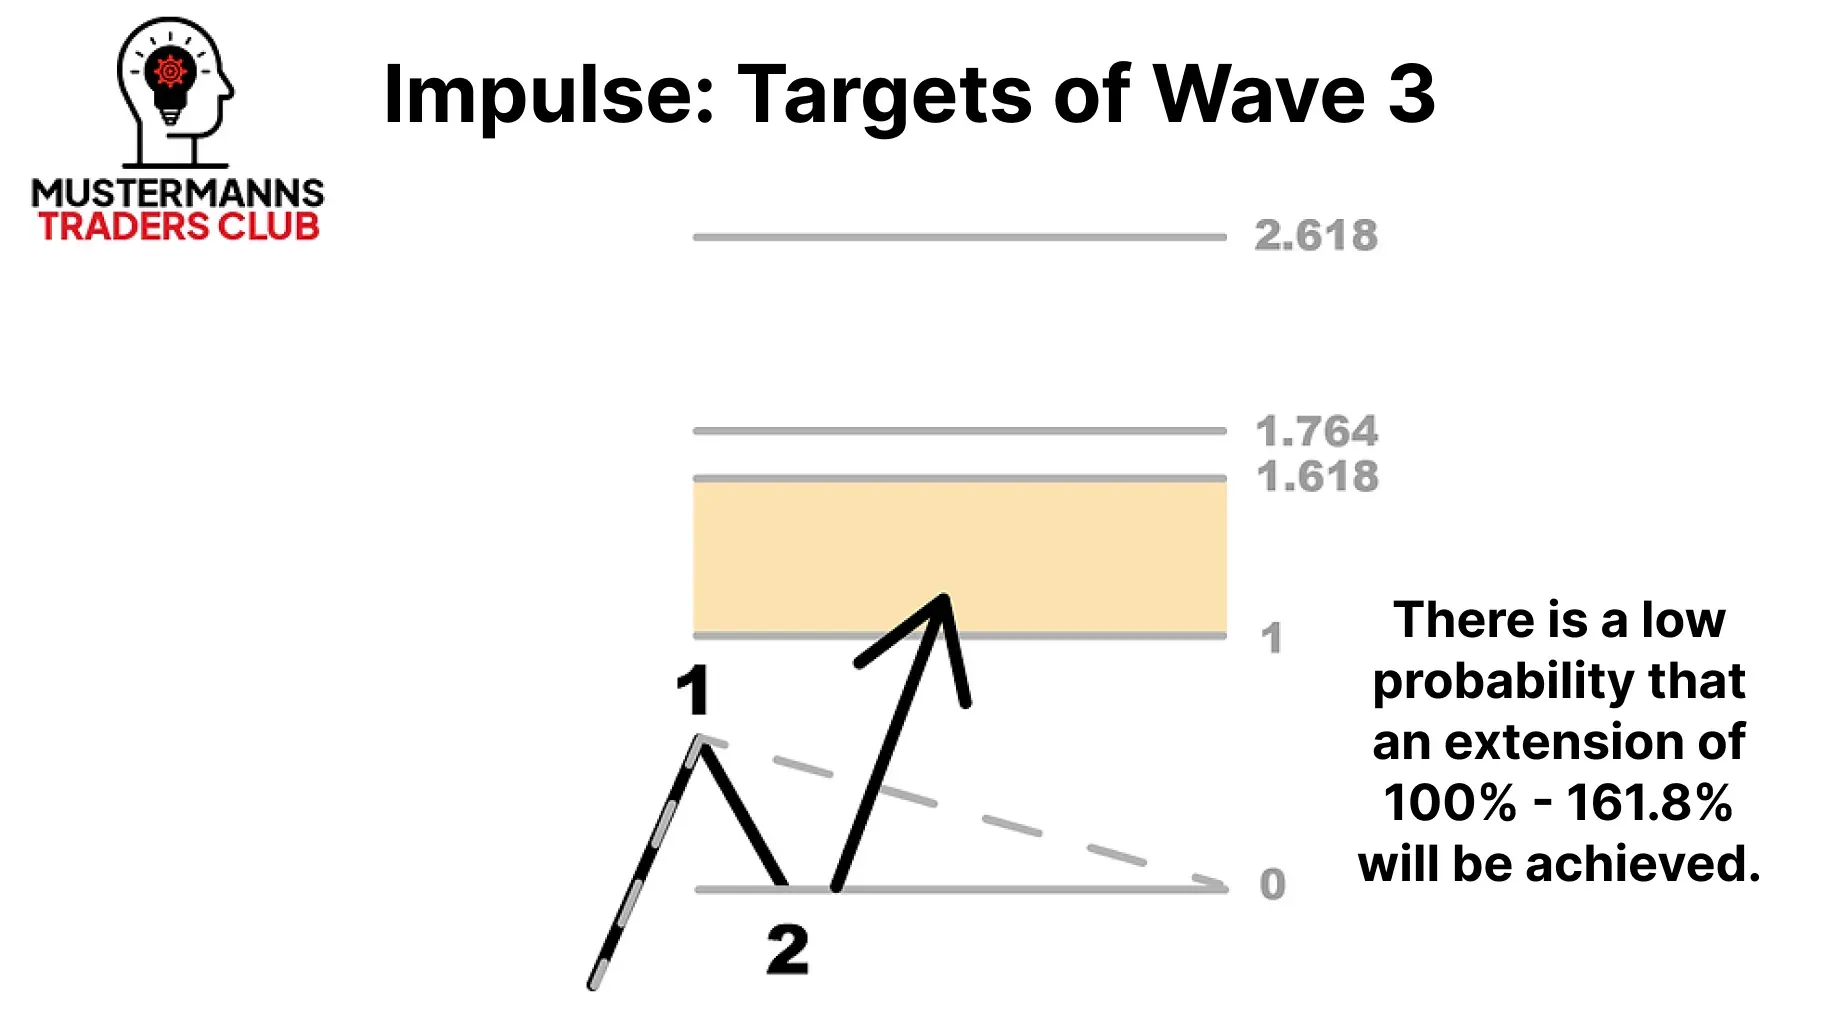
In most cases, wave 3 reaches at least the 161.8 extension level. This can also be derived from the fact that the third wave is predominantly impulsive. If the movement lacks suitable momentum, a wave 3 can also extend below 1.618. If this occurs, certain forecasts can be made for the last impulse wave, wave 5, which will be discussed in more detail below. Note, however, that the supposed wave 3 does not extend below 1, as in this case another option, such as a correction wave, is more likely.
Note, however, that wave 3 must necessarily extend above the high of wave 1.
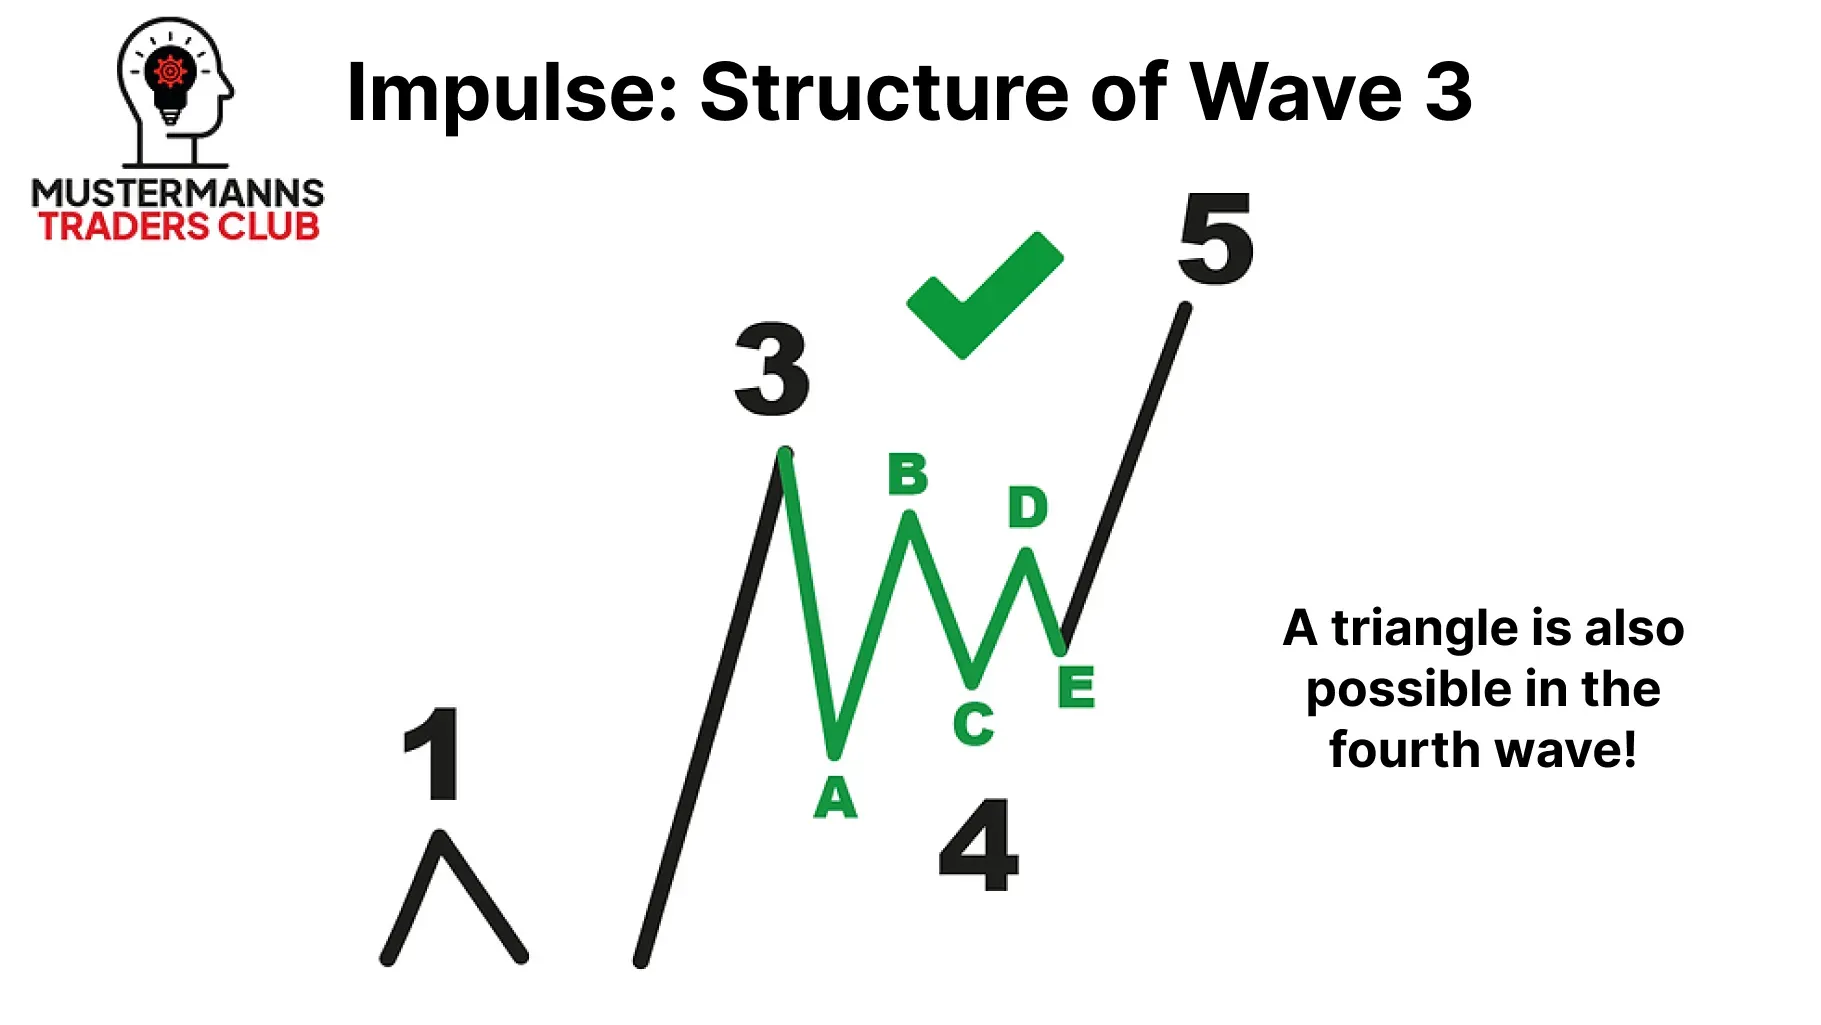
Wave 4
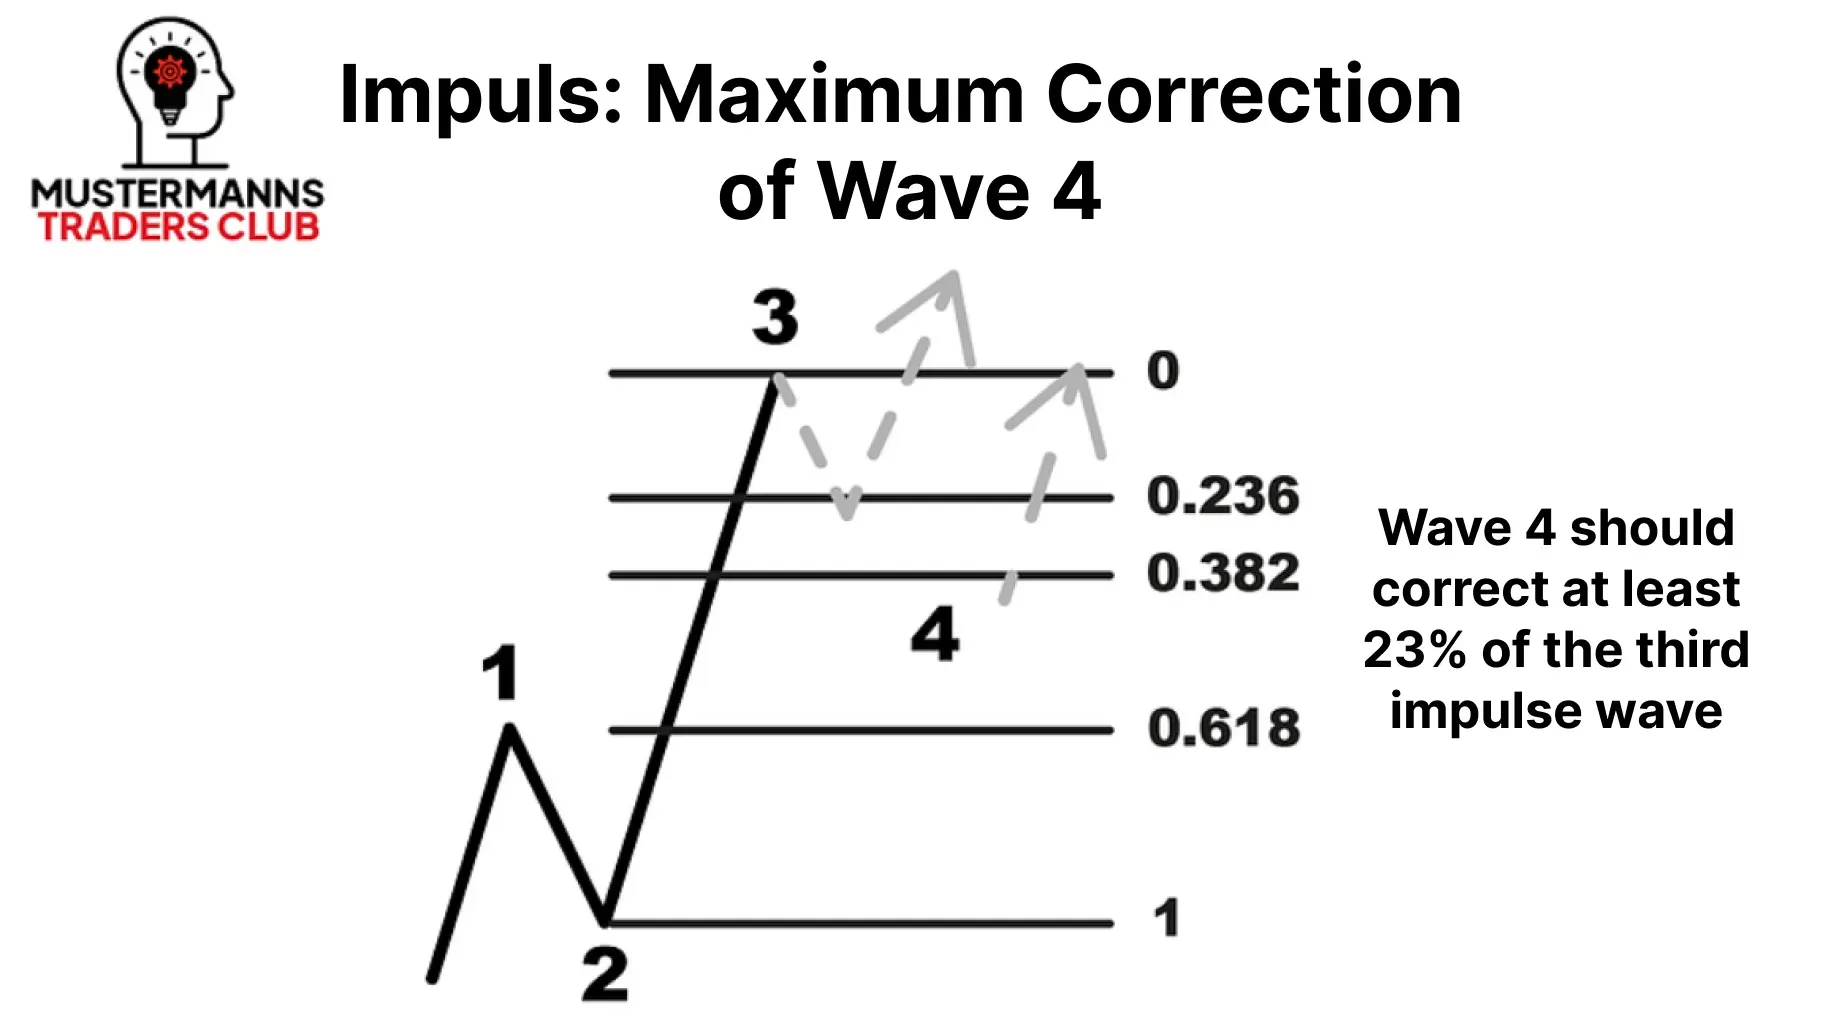
Before the impulse ends with the fifth wave, a second corrective wave follows in wave 4, which, unlike wave 2, may consist of all possible corrections.
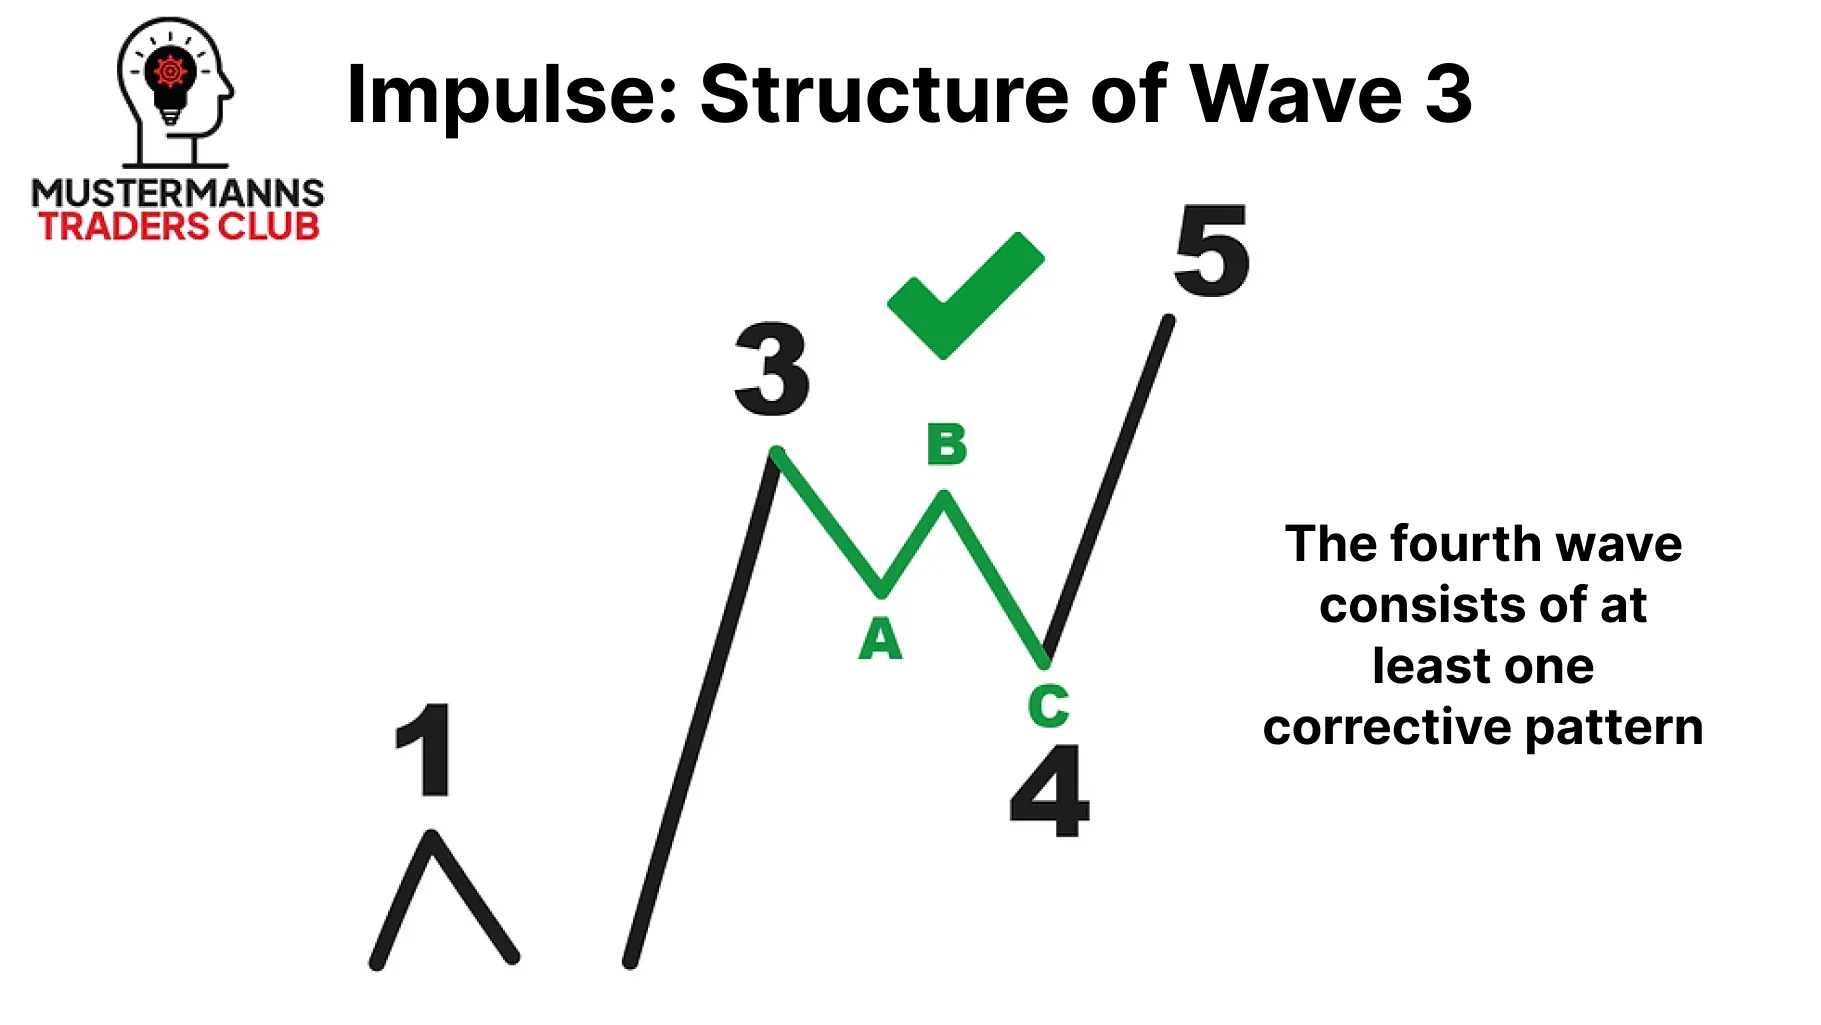
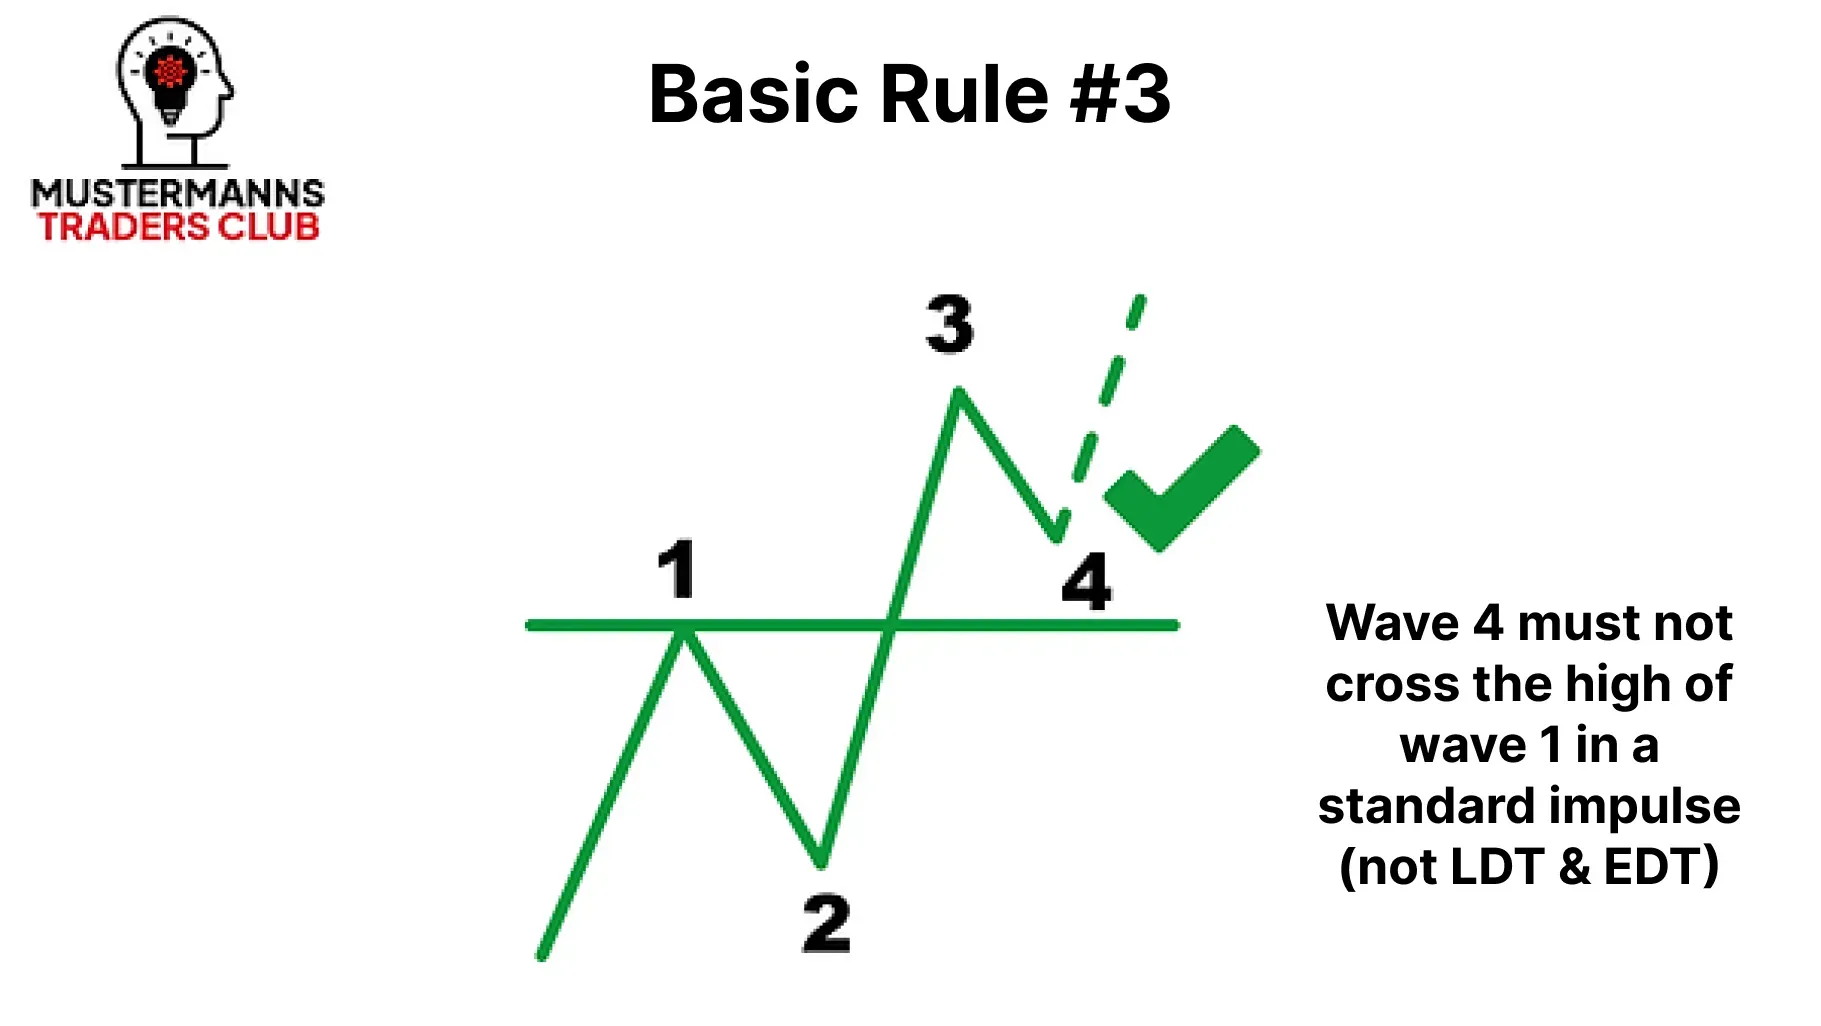
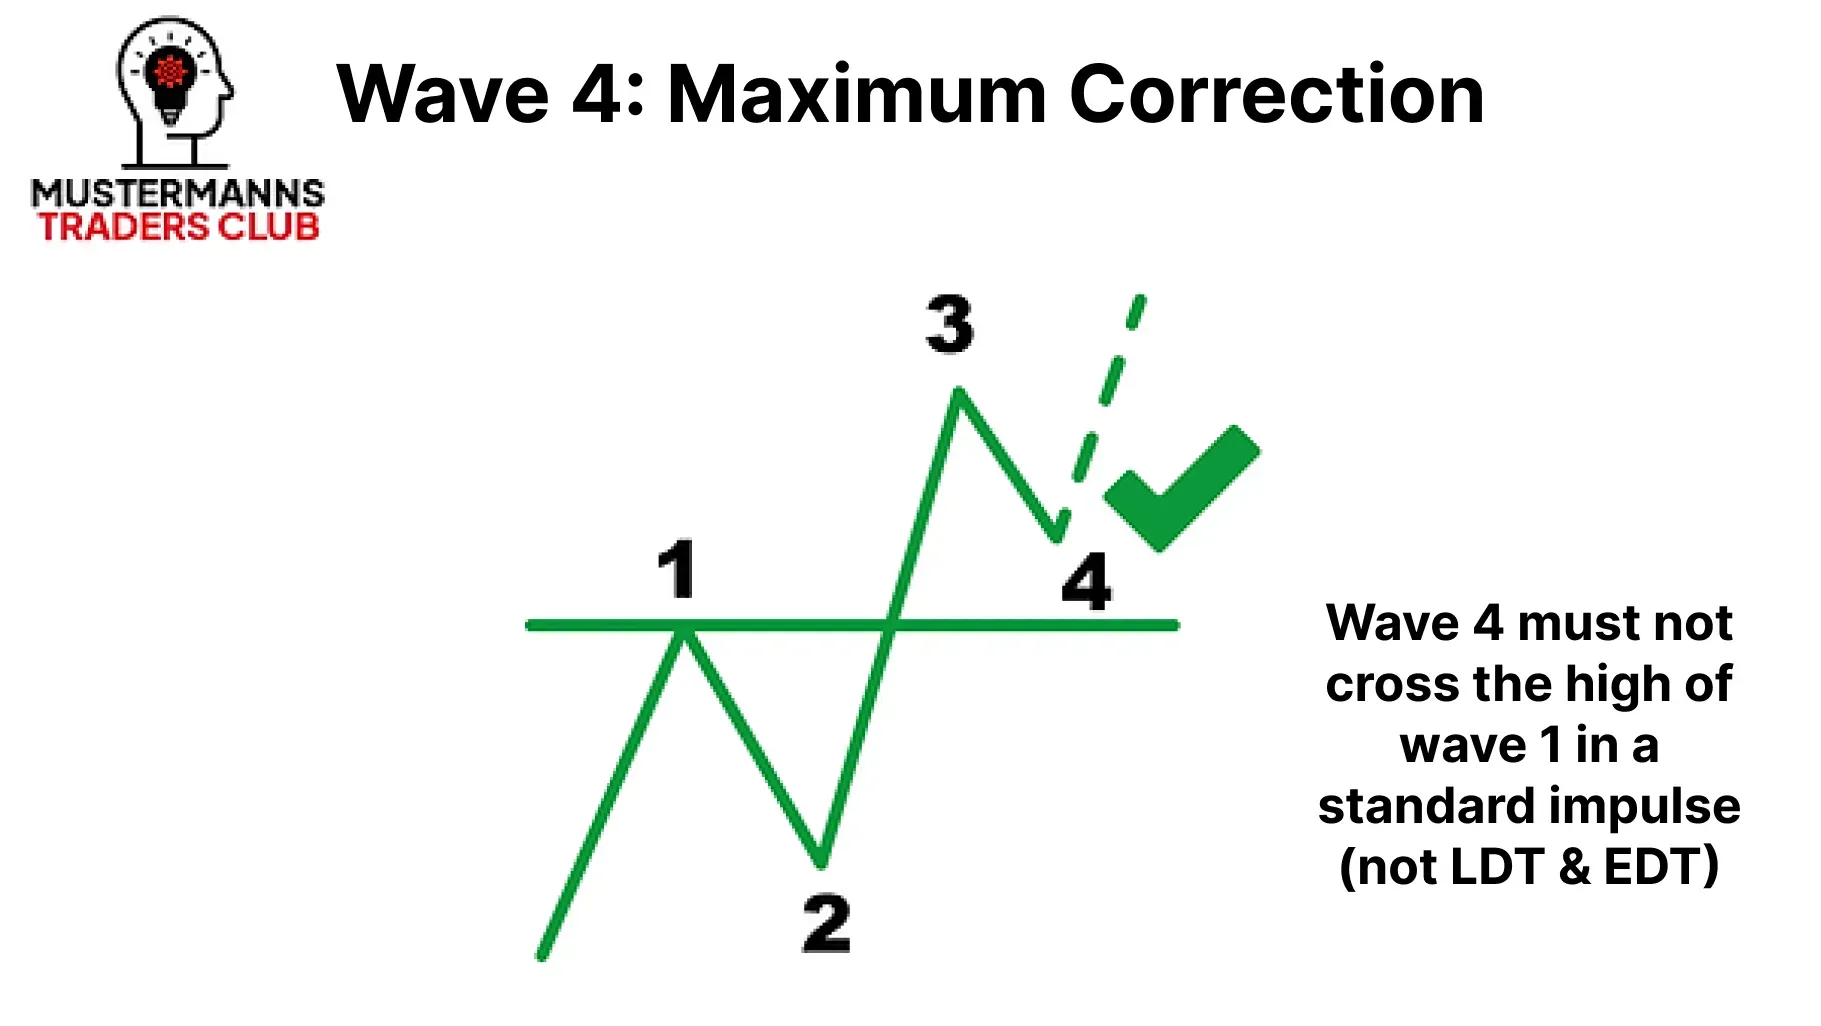
One of the most important rules in an impulse is that wave 4 must not intersect the high of the first wave. This rule always applies in an impulse!
You can also use this rule to refine your risk management. If you are planning to enter wave 4 in order to trade in the direction of wave 5, the rule can be a basis for you to define a stop loss. But more on this later...
The End - Wave 5
The impulse ends with wave 5. It marks the end of the movement and the beginning of the subsequent corrective movement. For this reason, falling volume can often be seen in the chart. Compared to the third wave, the fifth wave is generally less impulsive.
It is often the peak of large movements in the chart and can therefore be observed shortly before a trend reversal.
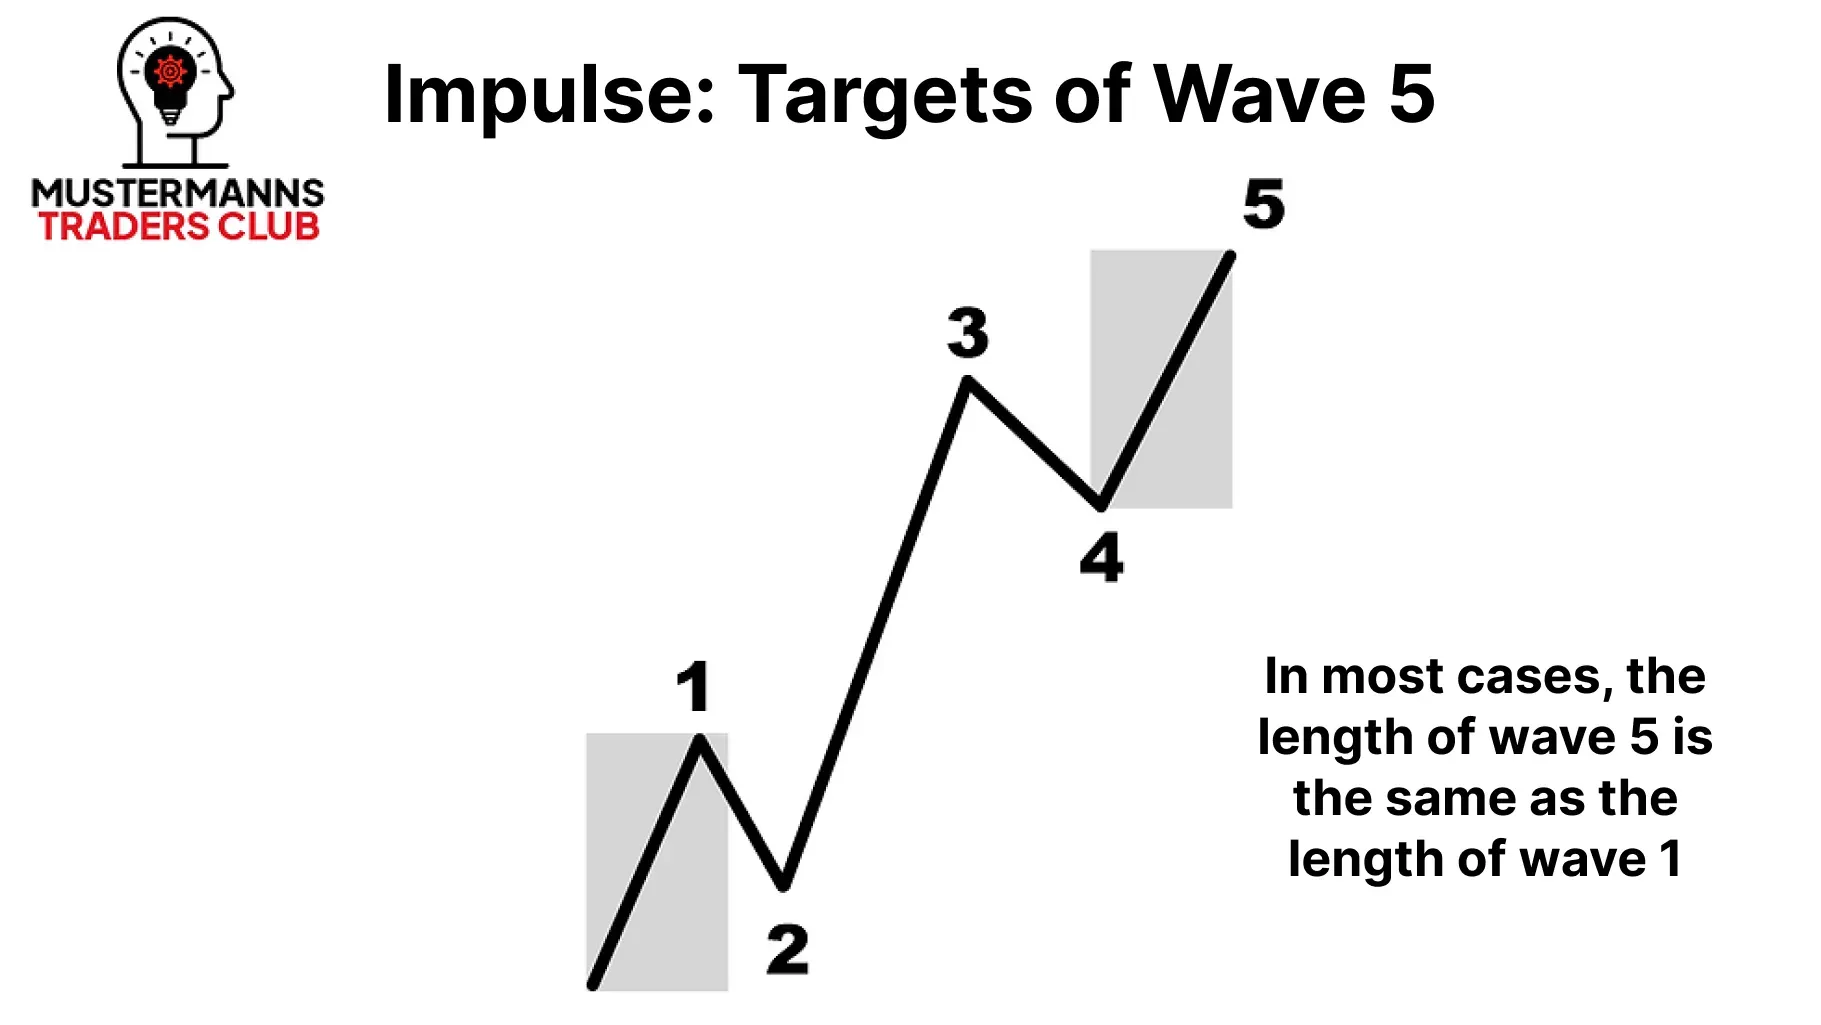
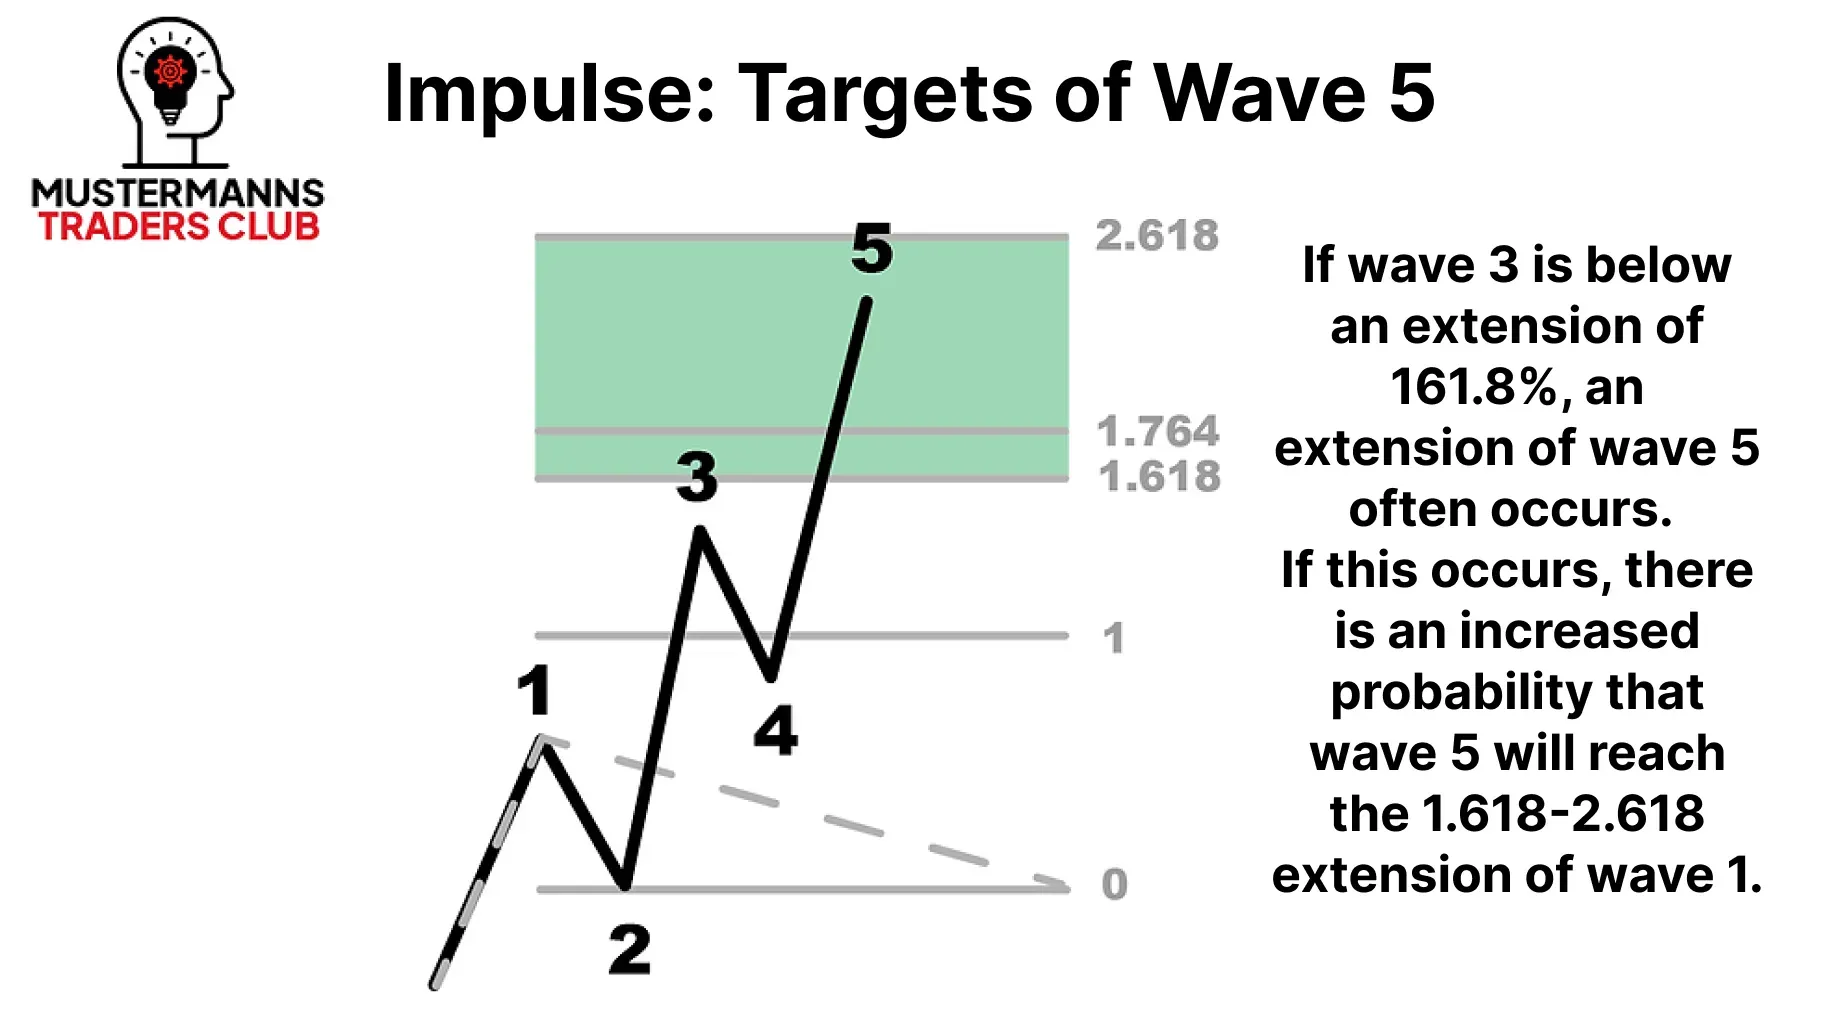
The extension of the fifth wave in the impulse can often be equated with the length of wave 1. However, this rule of thumb can often only be applied to situations in the chart where the impulse of wave 3 reaches at least the 1.618 extension. If the third wave was unusually short, the probability that the fifth wave will extend strongly is increased. Among "Elliott wavers", the term "extended five" is commonly used for this phenomenon.
This characteristic of wave 5 shows how important it is to measure the impulse using the Fibonacci extension.
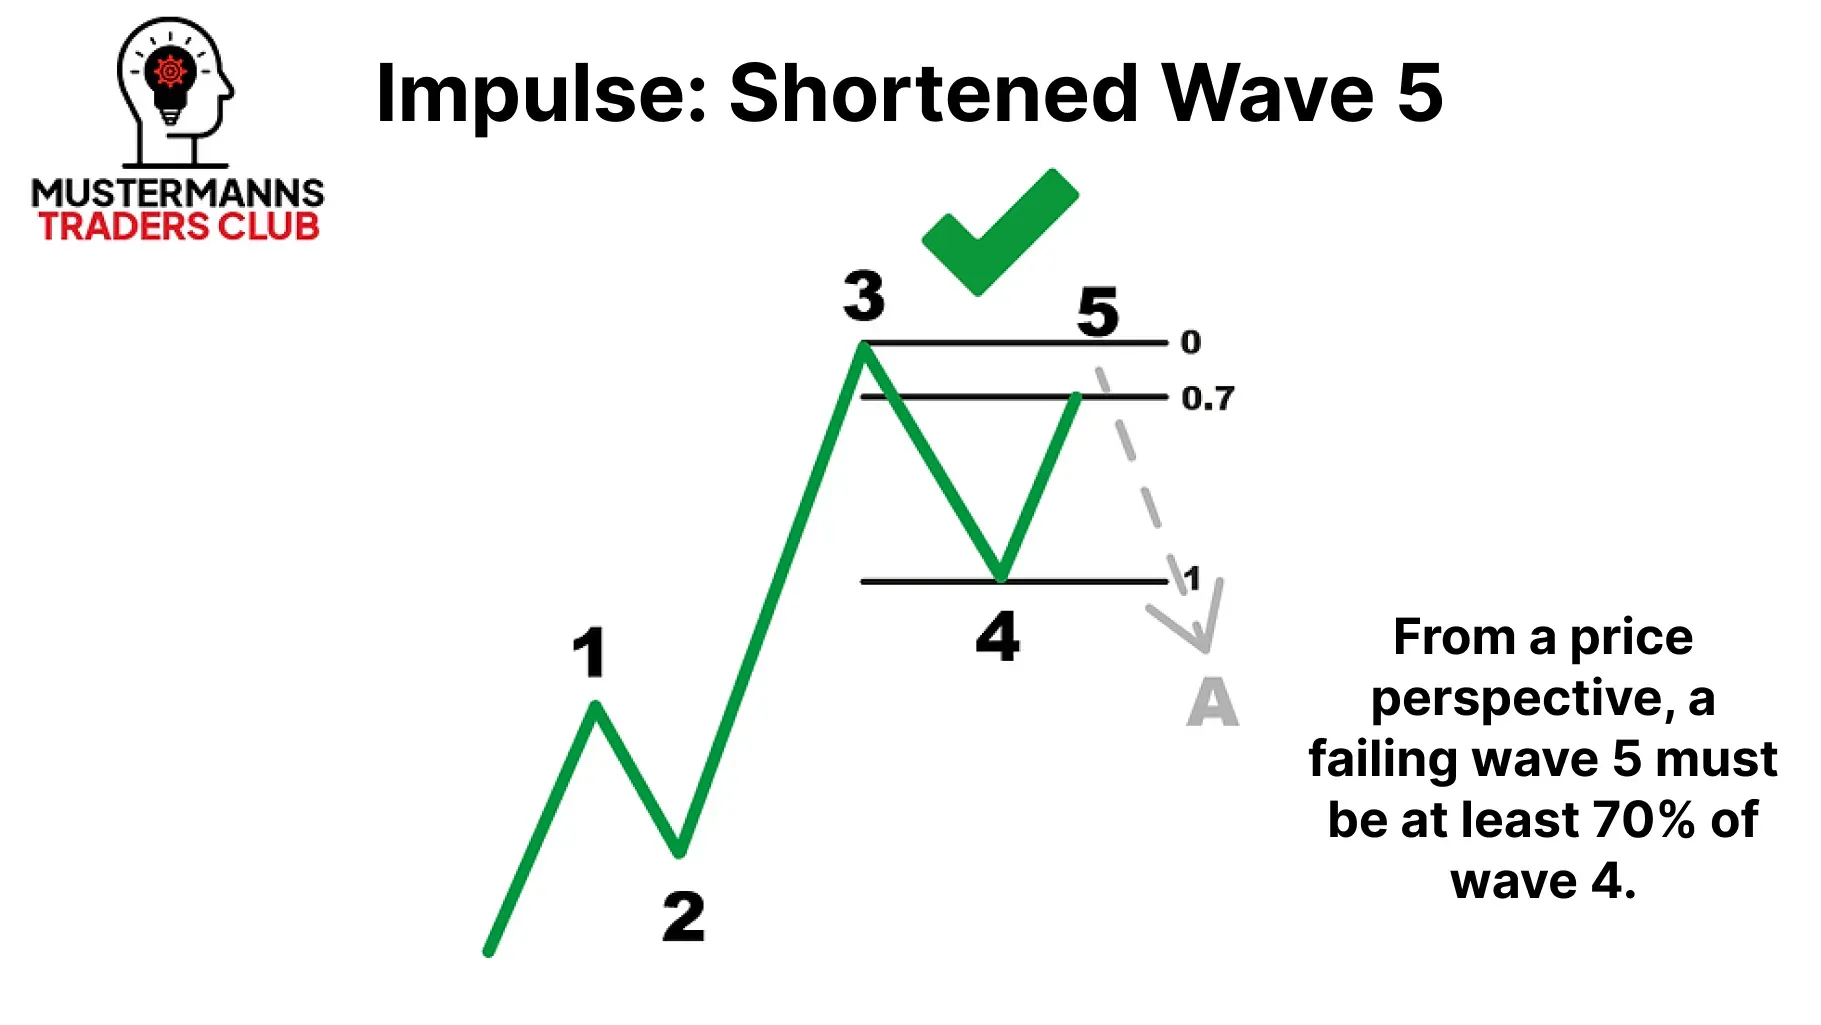
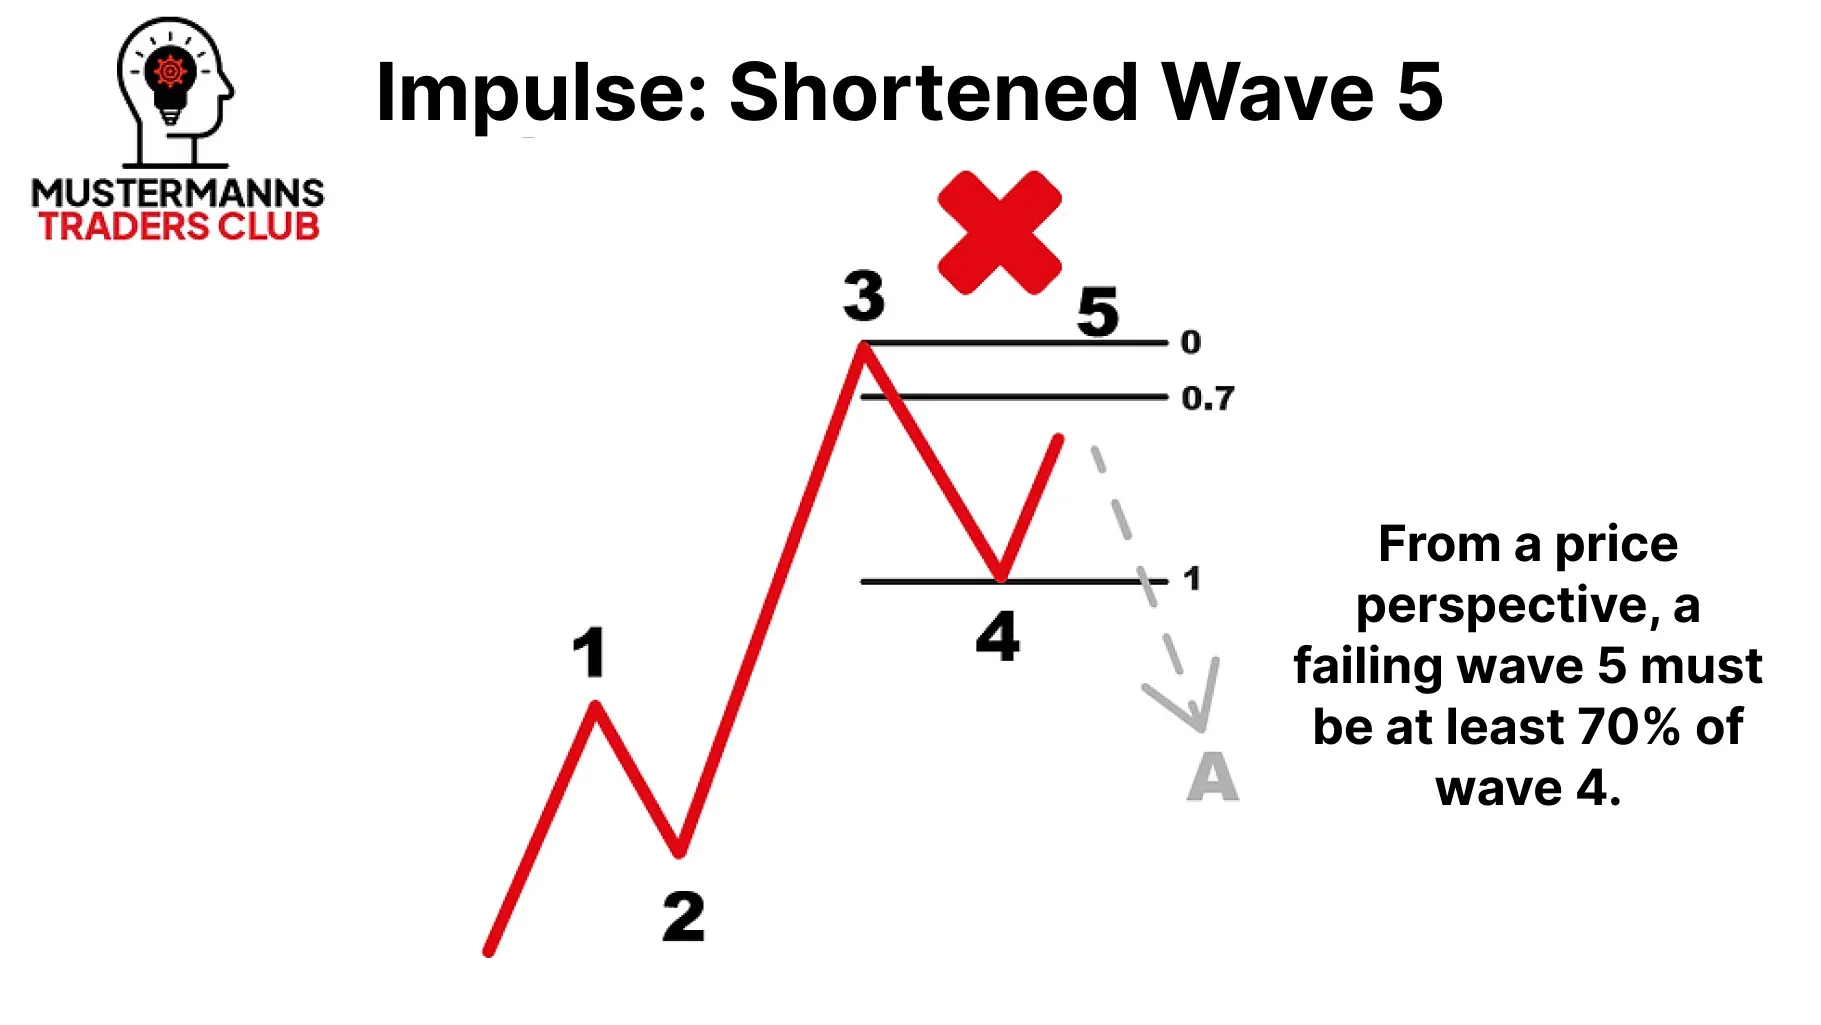
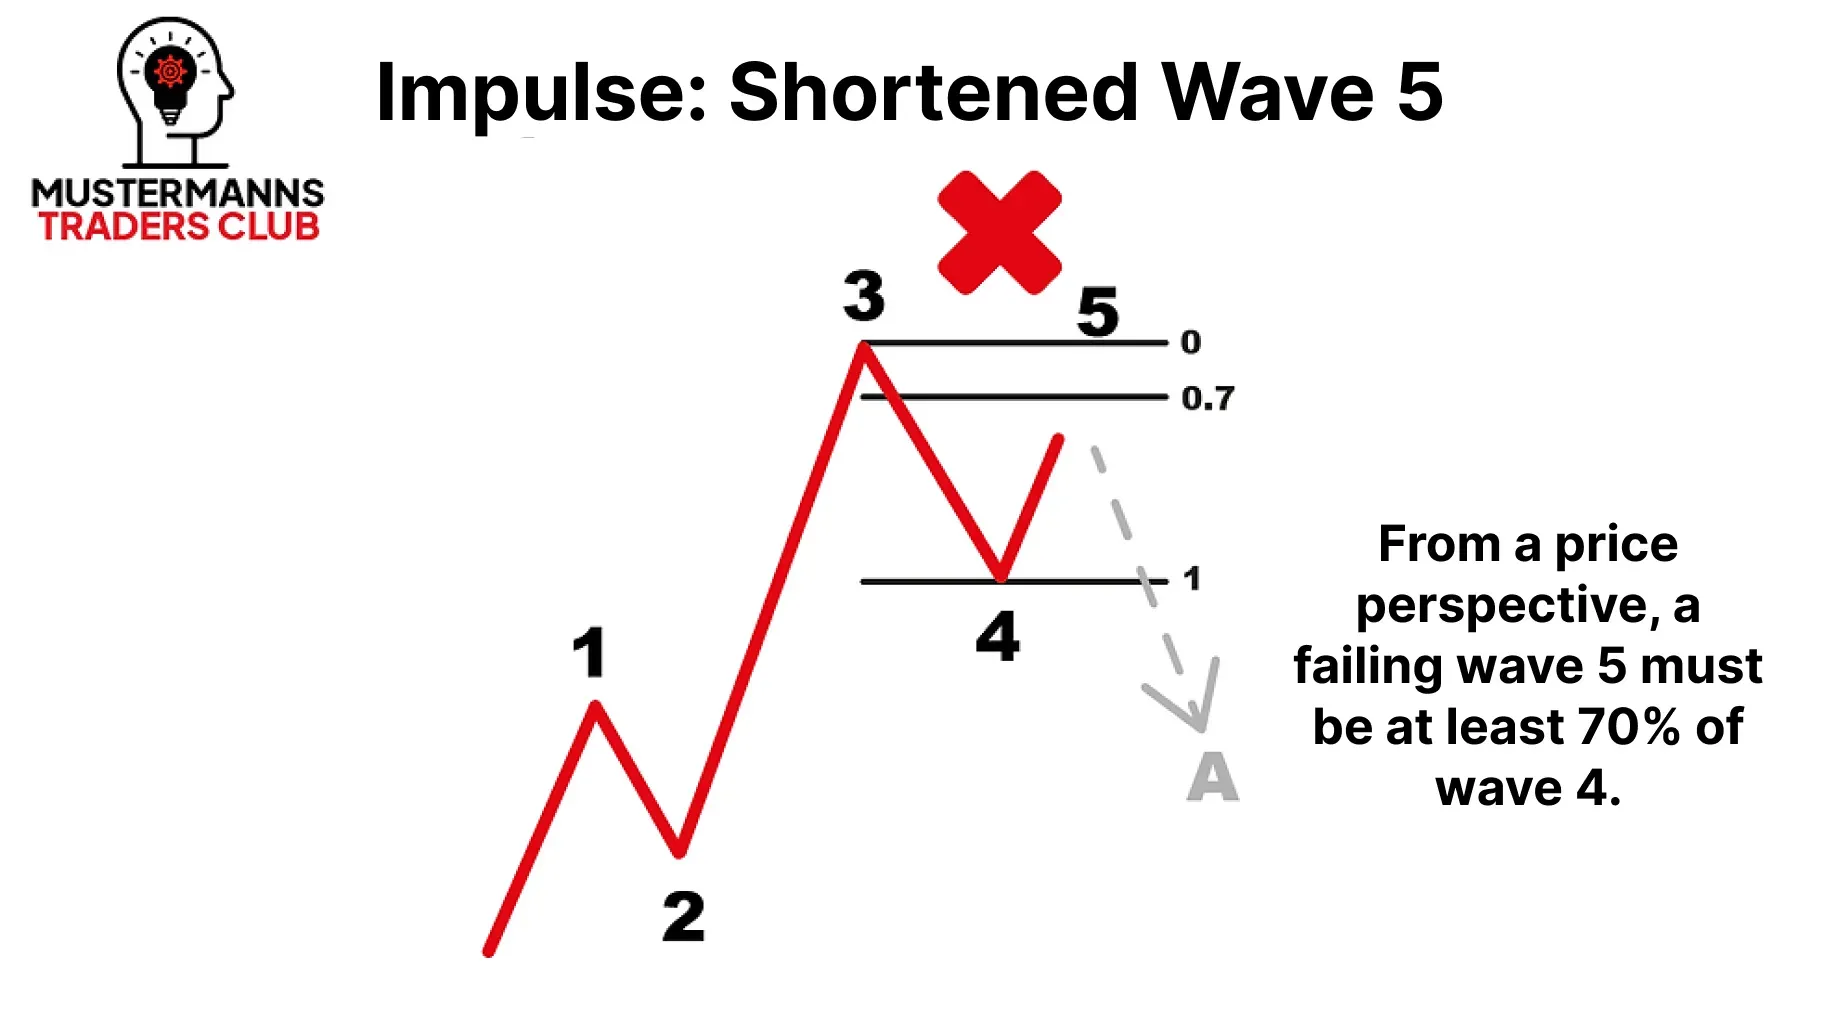
Although wave 5 does not necessarily have to surpass the high of wave 4, it must correct the previous correction in the fourth wave by at least 70%. If it fails to do so, it is often a wave B.
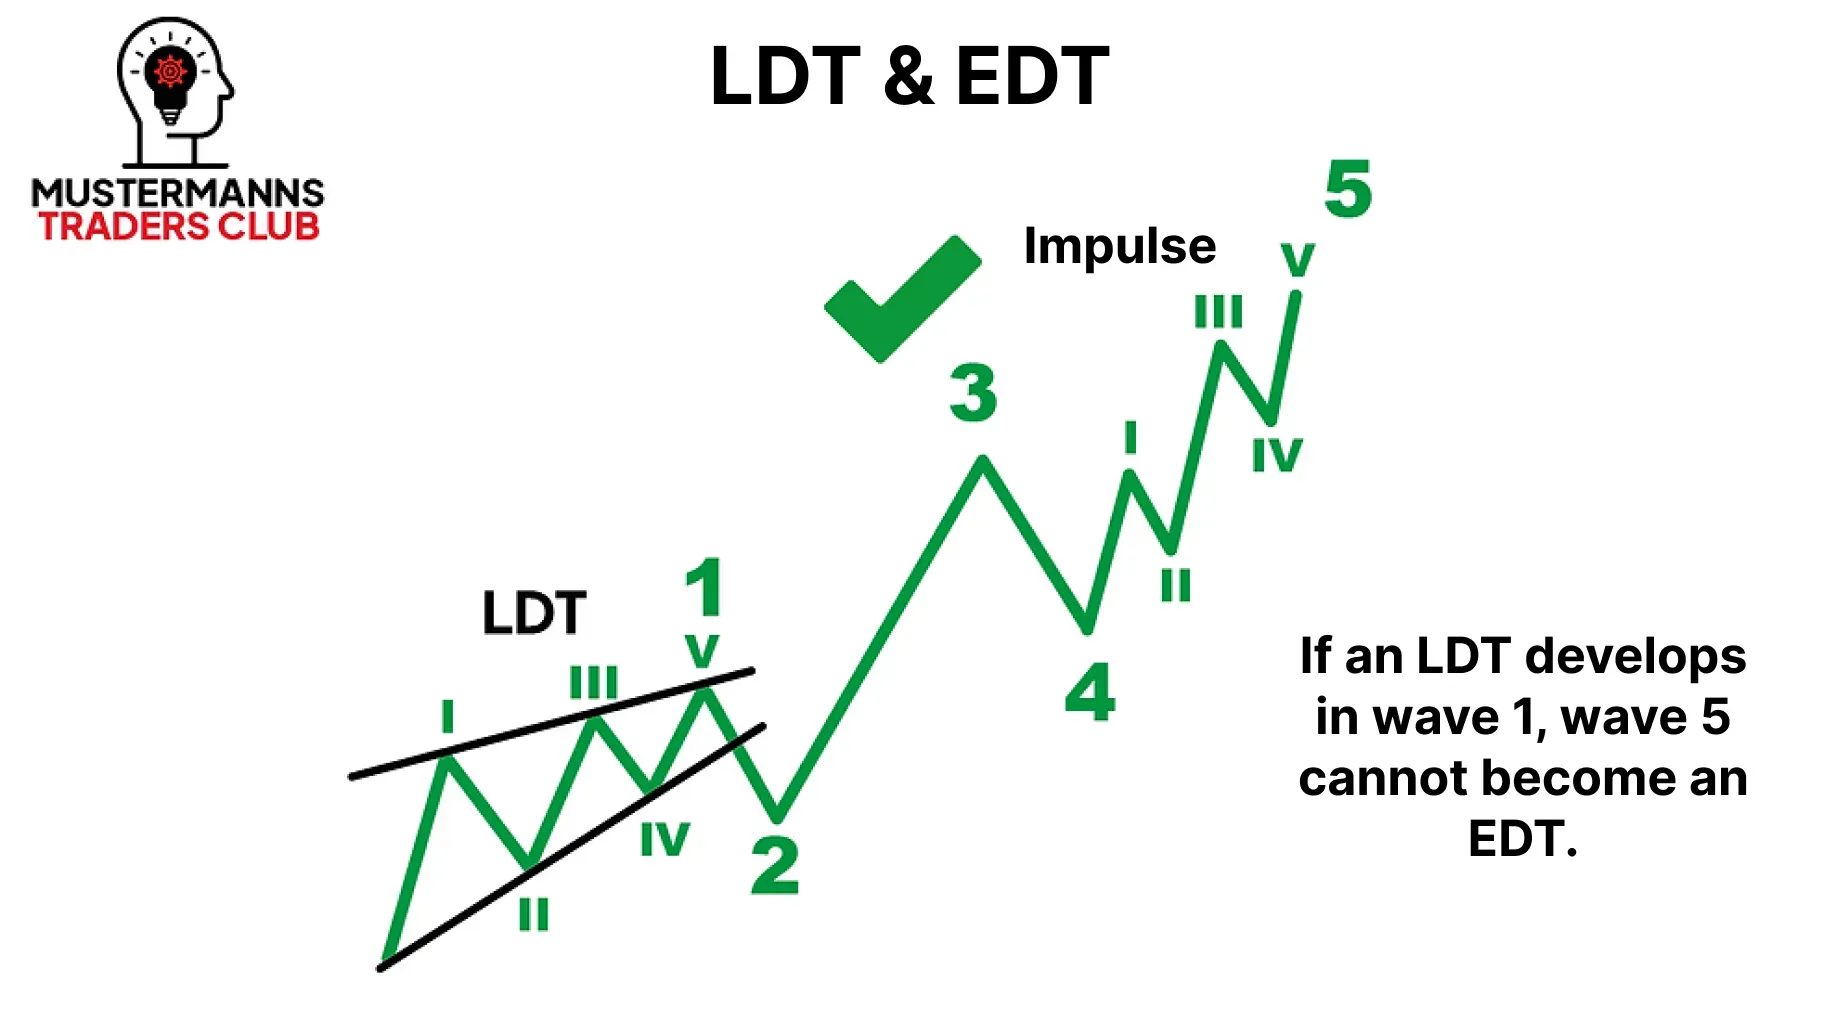
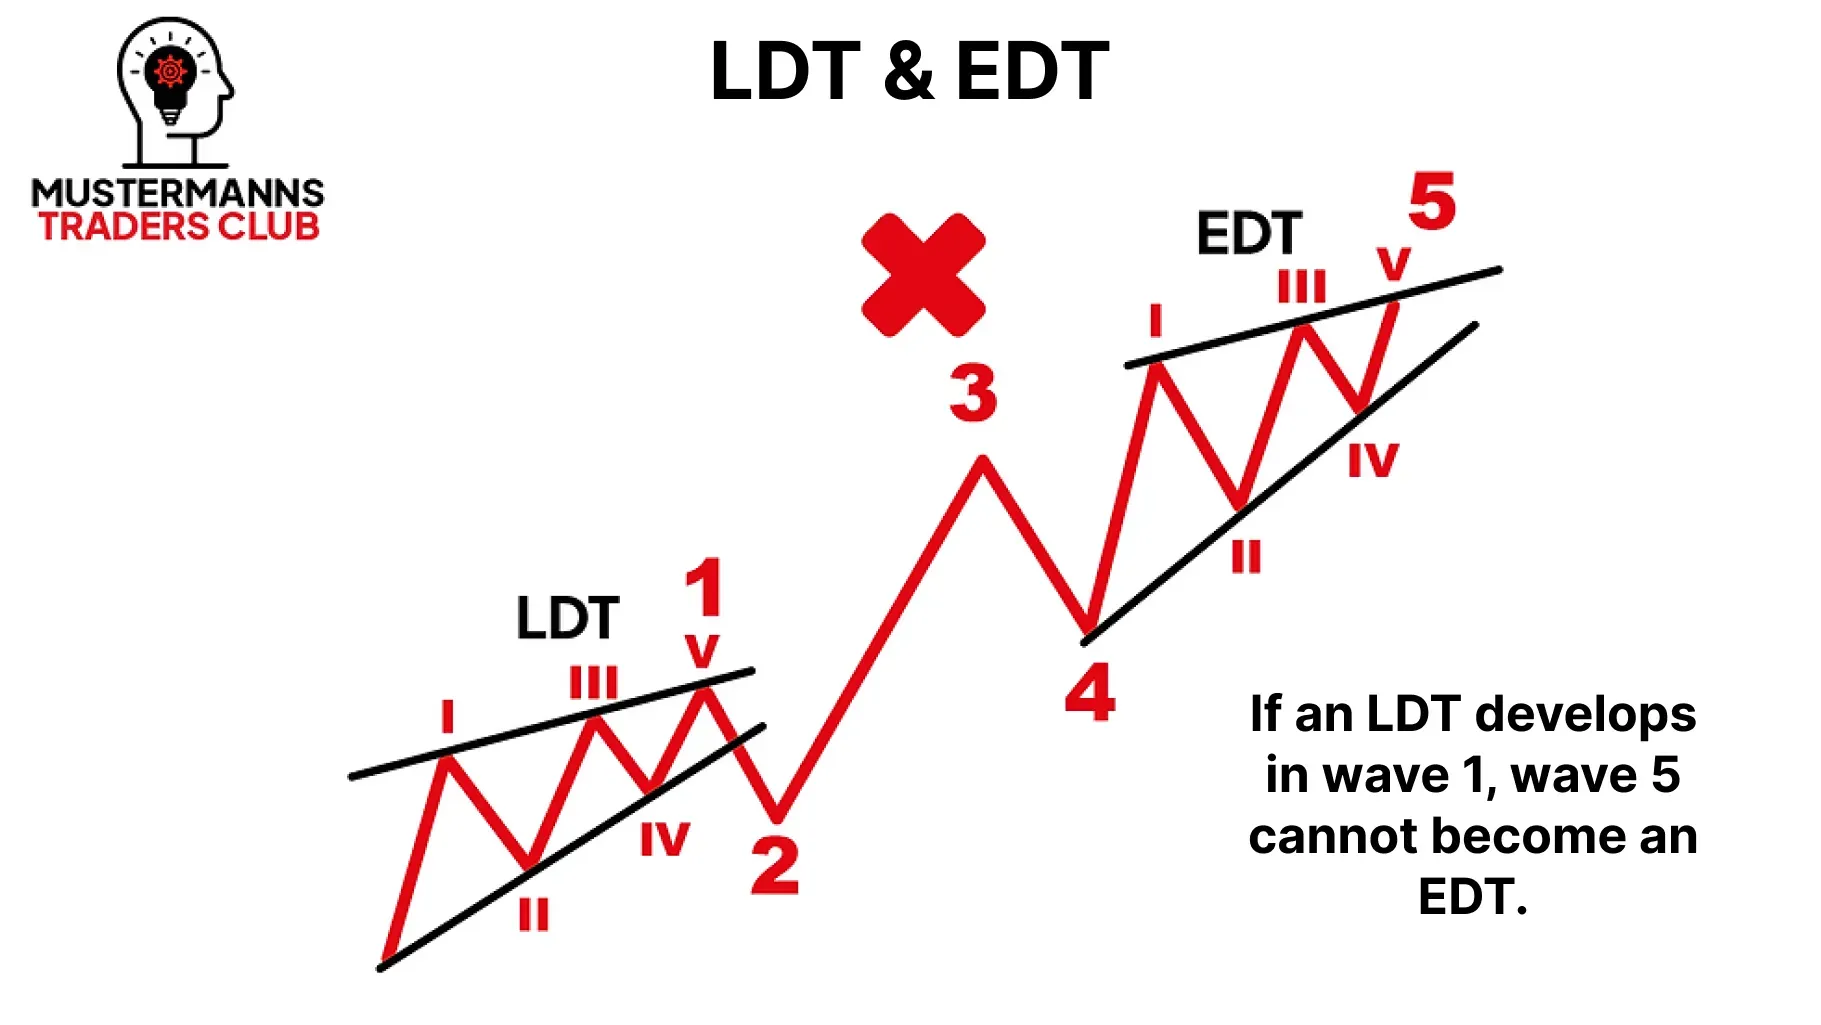
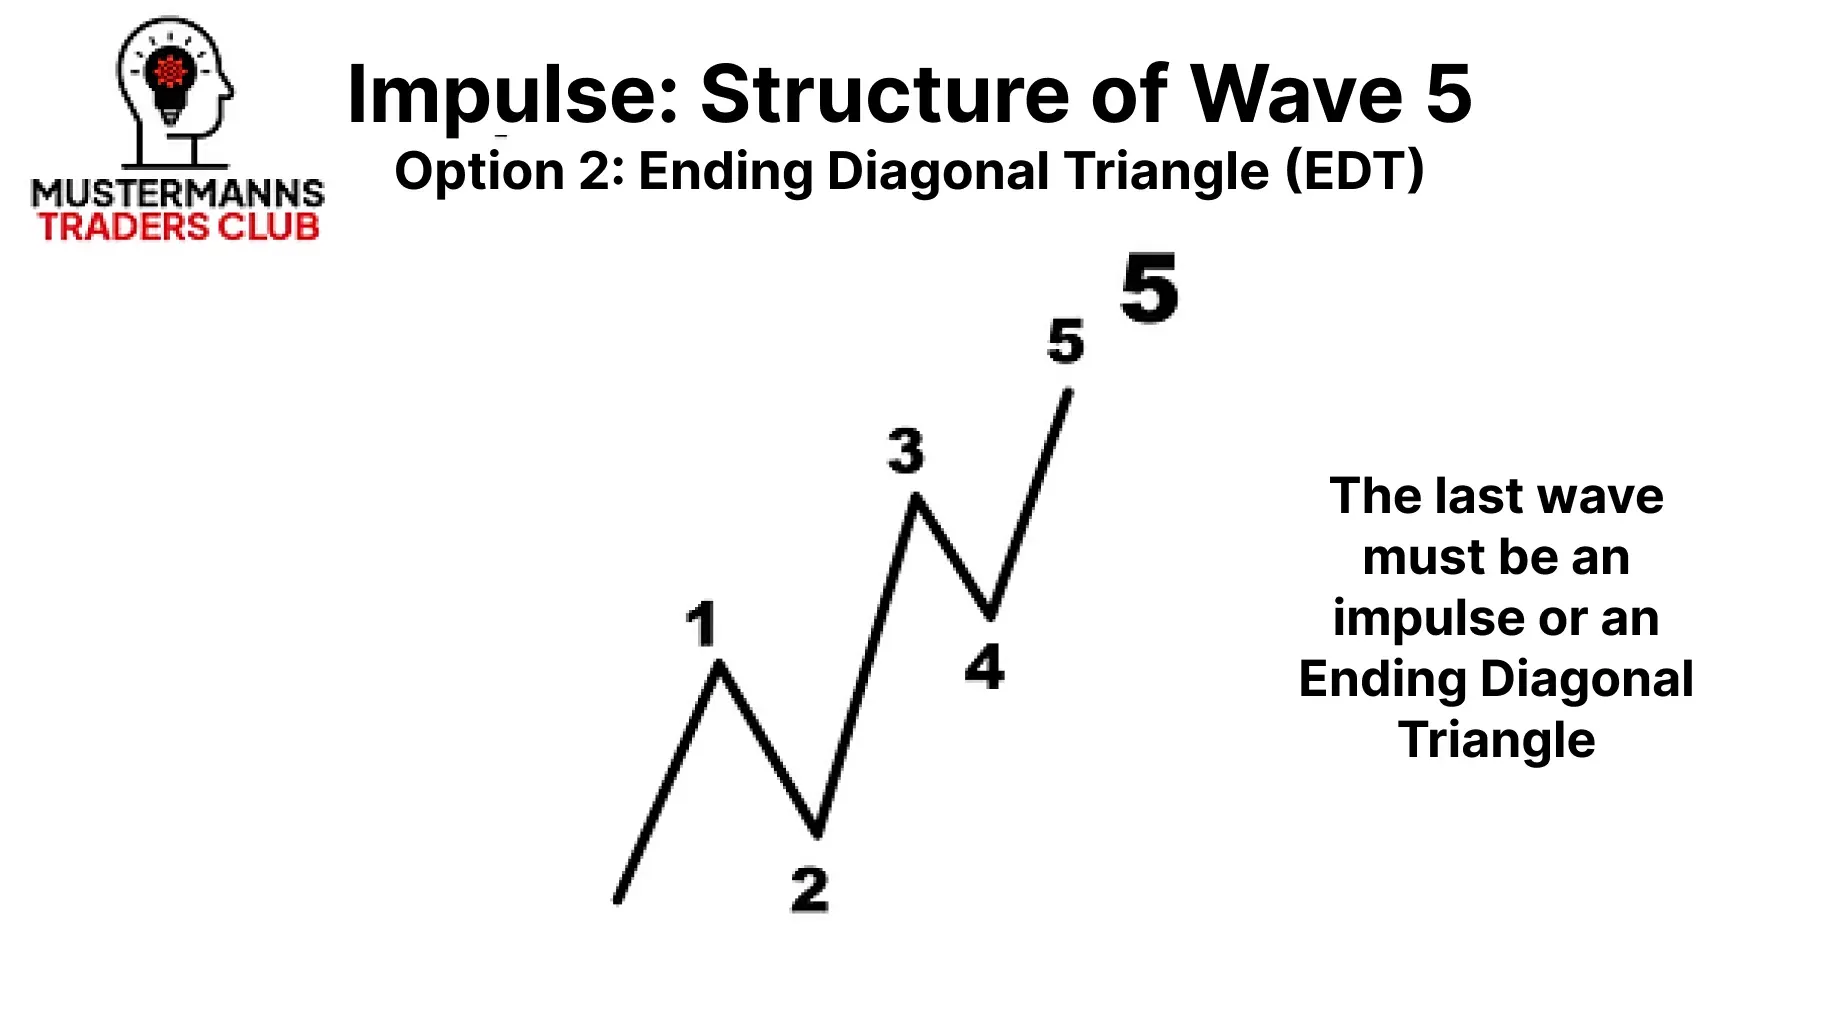
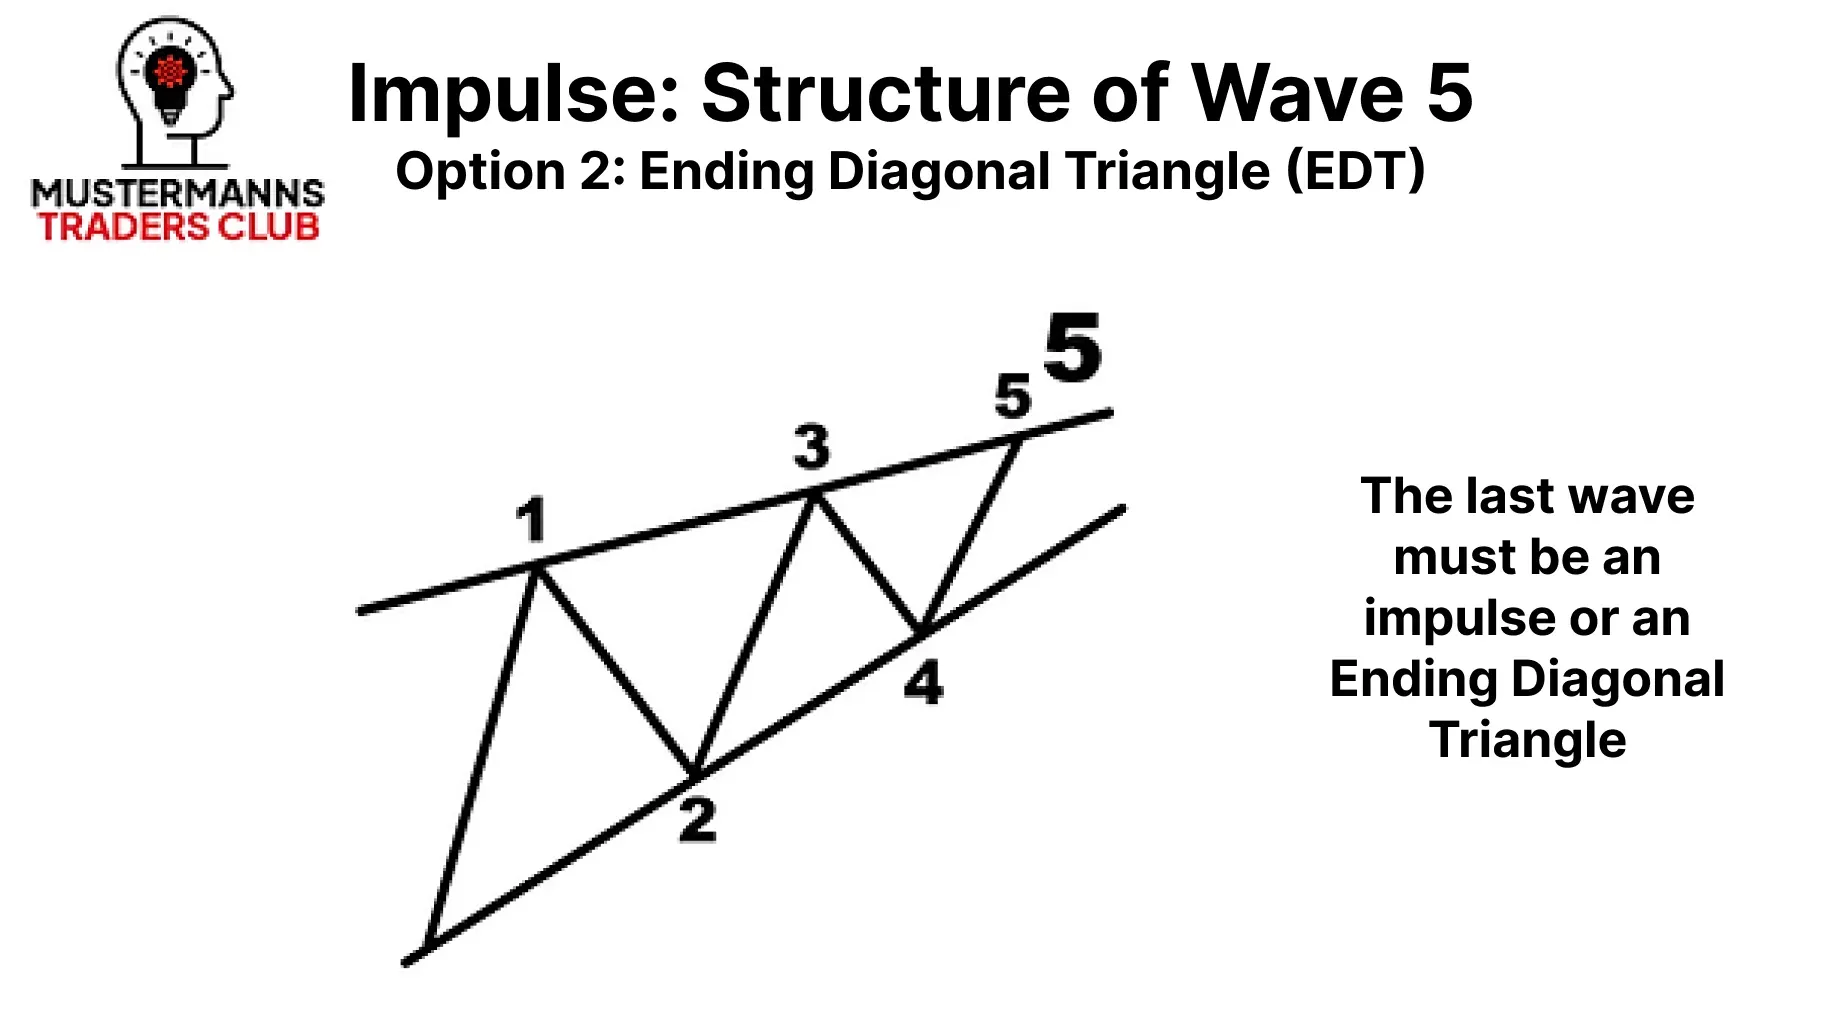
As you learned in this lesson, waves 1 and 5 can also form an LDT or an EDT in addition to the impulse itself. However, it is important to know that they are not both present in the chart at the same time. If you find an LDT in the first wave, you can rule out an EDT in the last wave.
Impulse wave ≠ Impulse?
As you probably already learned in the last lesson on impulses, there are different impulse waves. Just because there is an impulse wave in the chart does not mean, for example, that wave 4 must not intersect. This rule only applies to normal impulses, as is often the case on the internet. In the LDT and in the later EDT, the crossing is even a prerequisite for the wave count to be valid. This example makes it clear to you why it is so relevant to classify impulse waves into their three variants.
Now that we have an overview, let's take a closer look at the specific structure of the Leading Diagonal Triangle.
Leading Diagonal Triangle
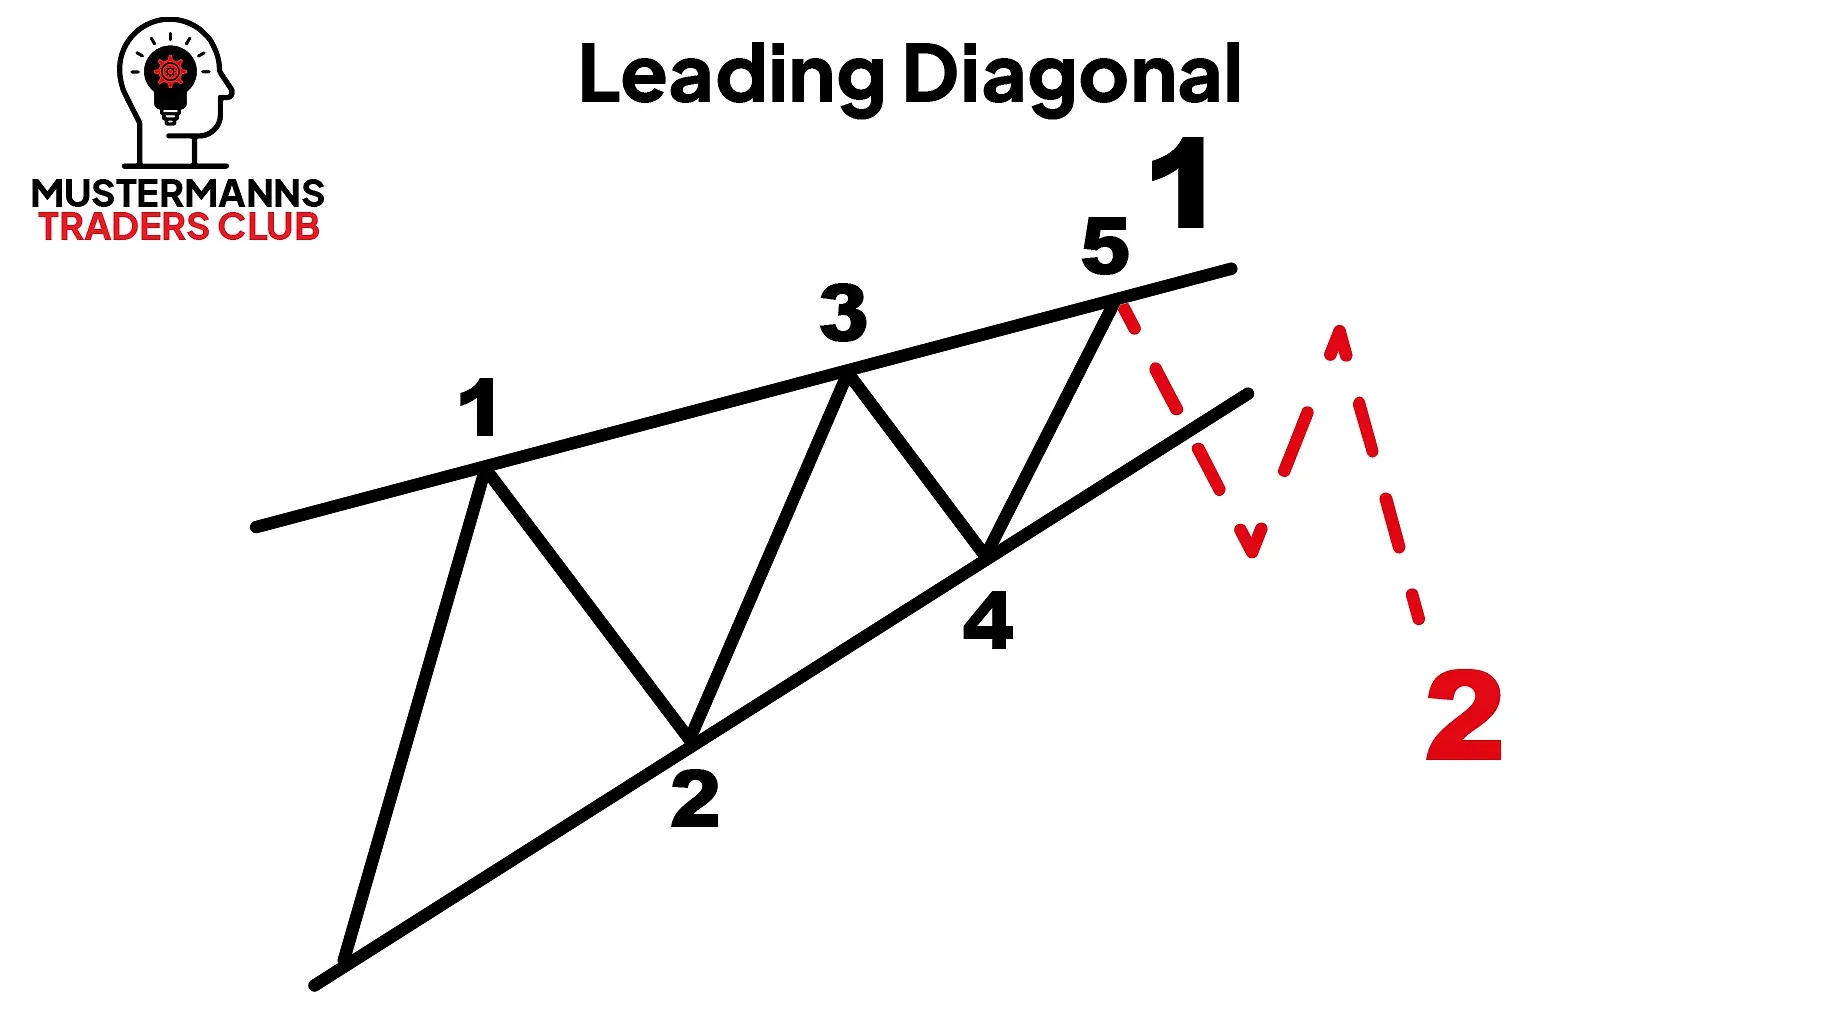
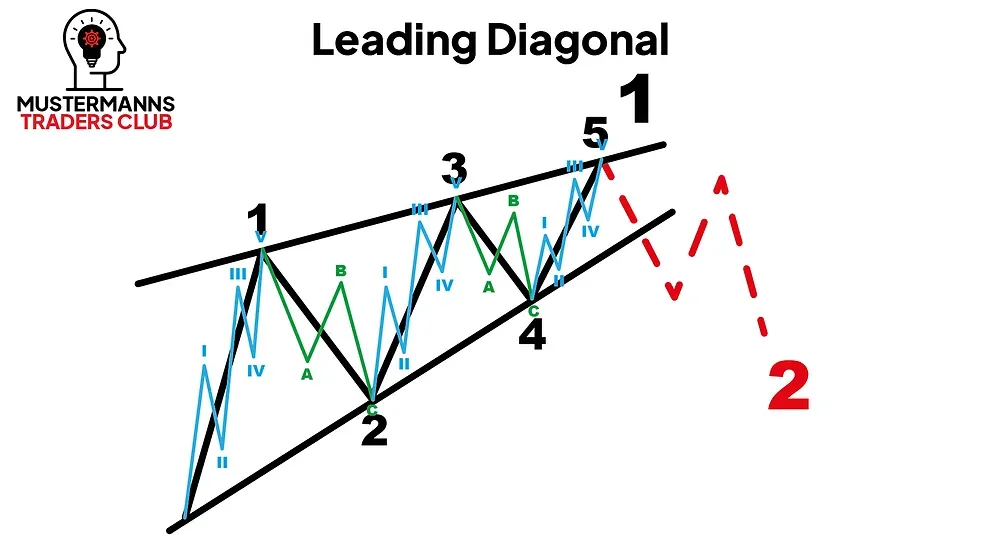
Like the normal impulse, the LDT is an impulse wave with a 5-3-5-3-5 structure. There are therefore three impulse waves and two correction waves in the wave formation. Unlike the impulse, the LDT is more reminiscent of a flat wedge, which makes it easier to analyze in the chart. Your chances of success on an LDT are highest on small charts (<15 minutes). Since the LDT can only form in wave 1 of an impulse wave (impulse or a superordinate LDT itself), wave 5 in the LDT is followed by a correction wave in the superordinate wave 2. The
The Beginning - Wave 1
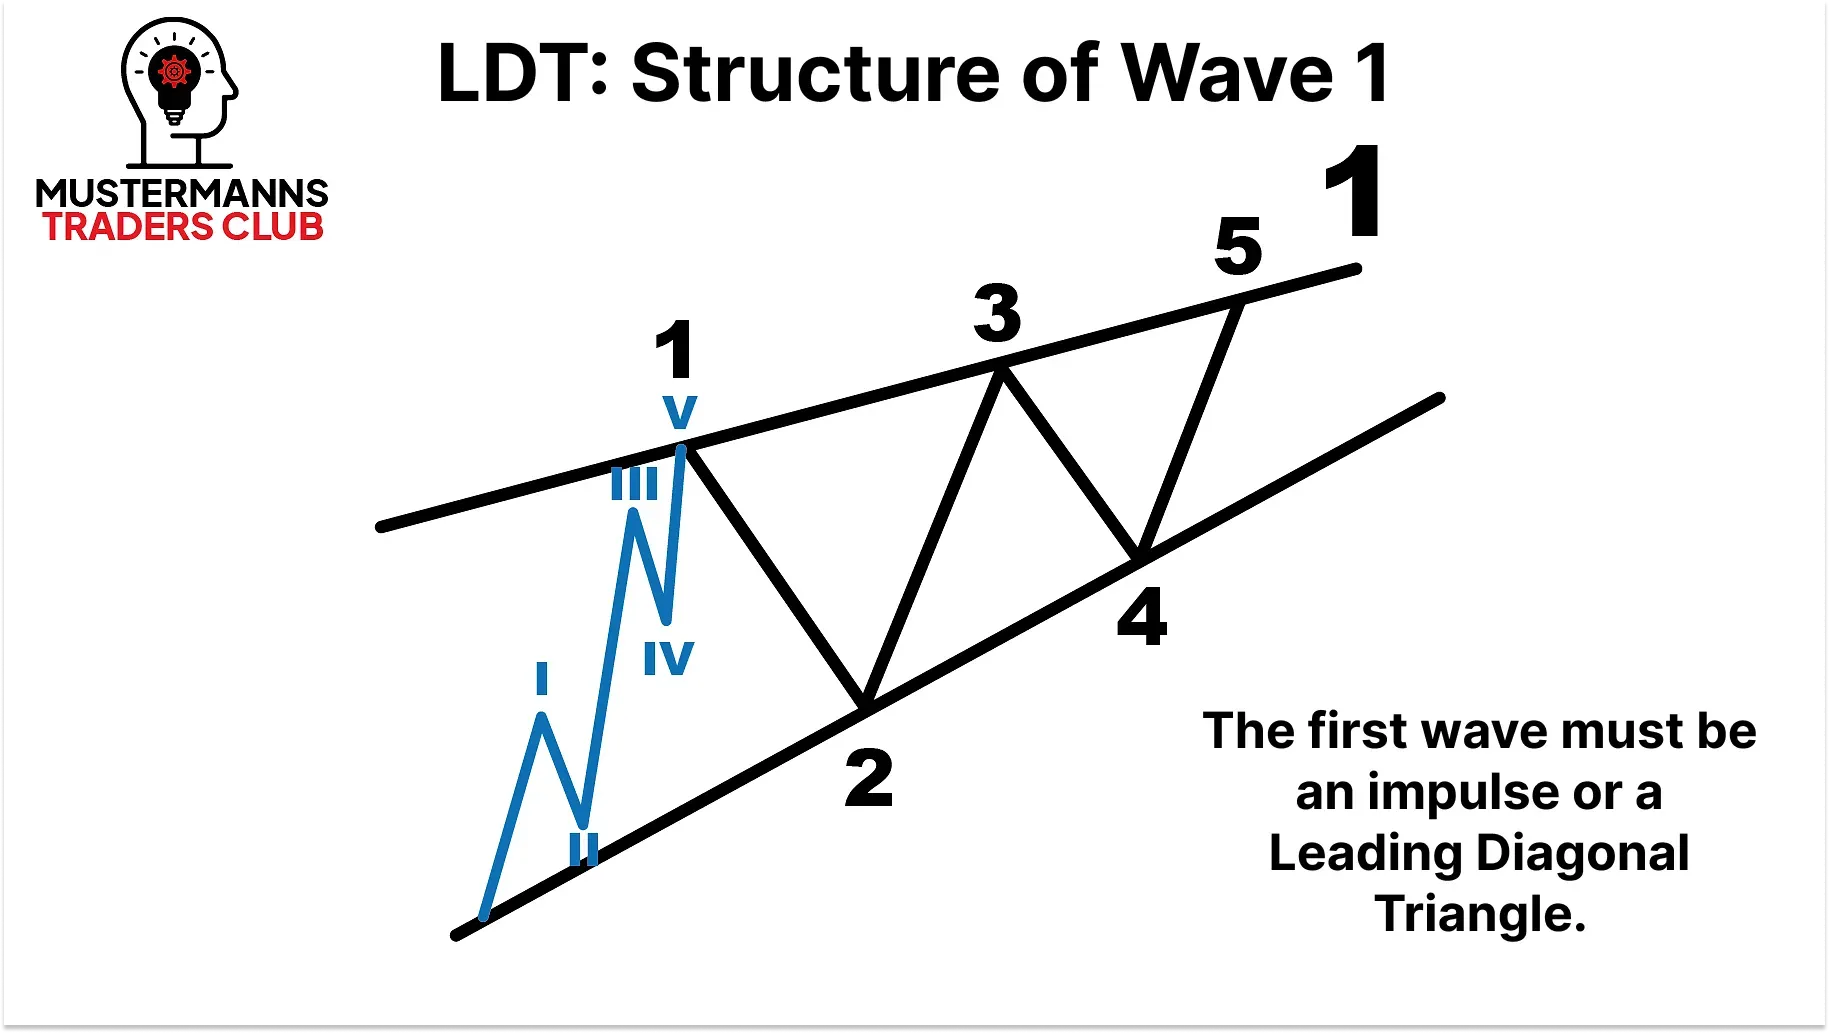
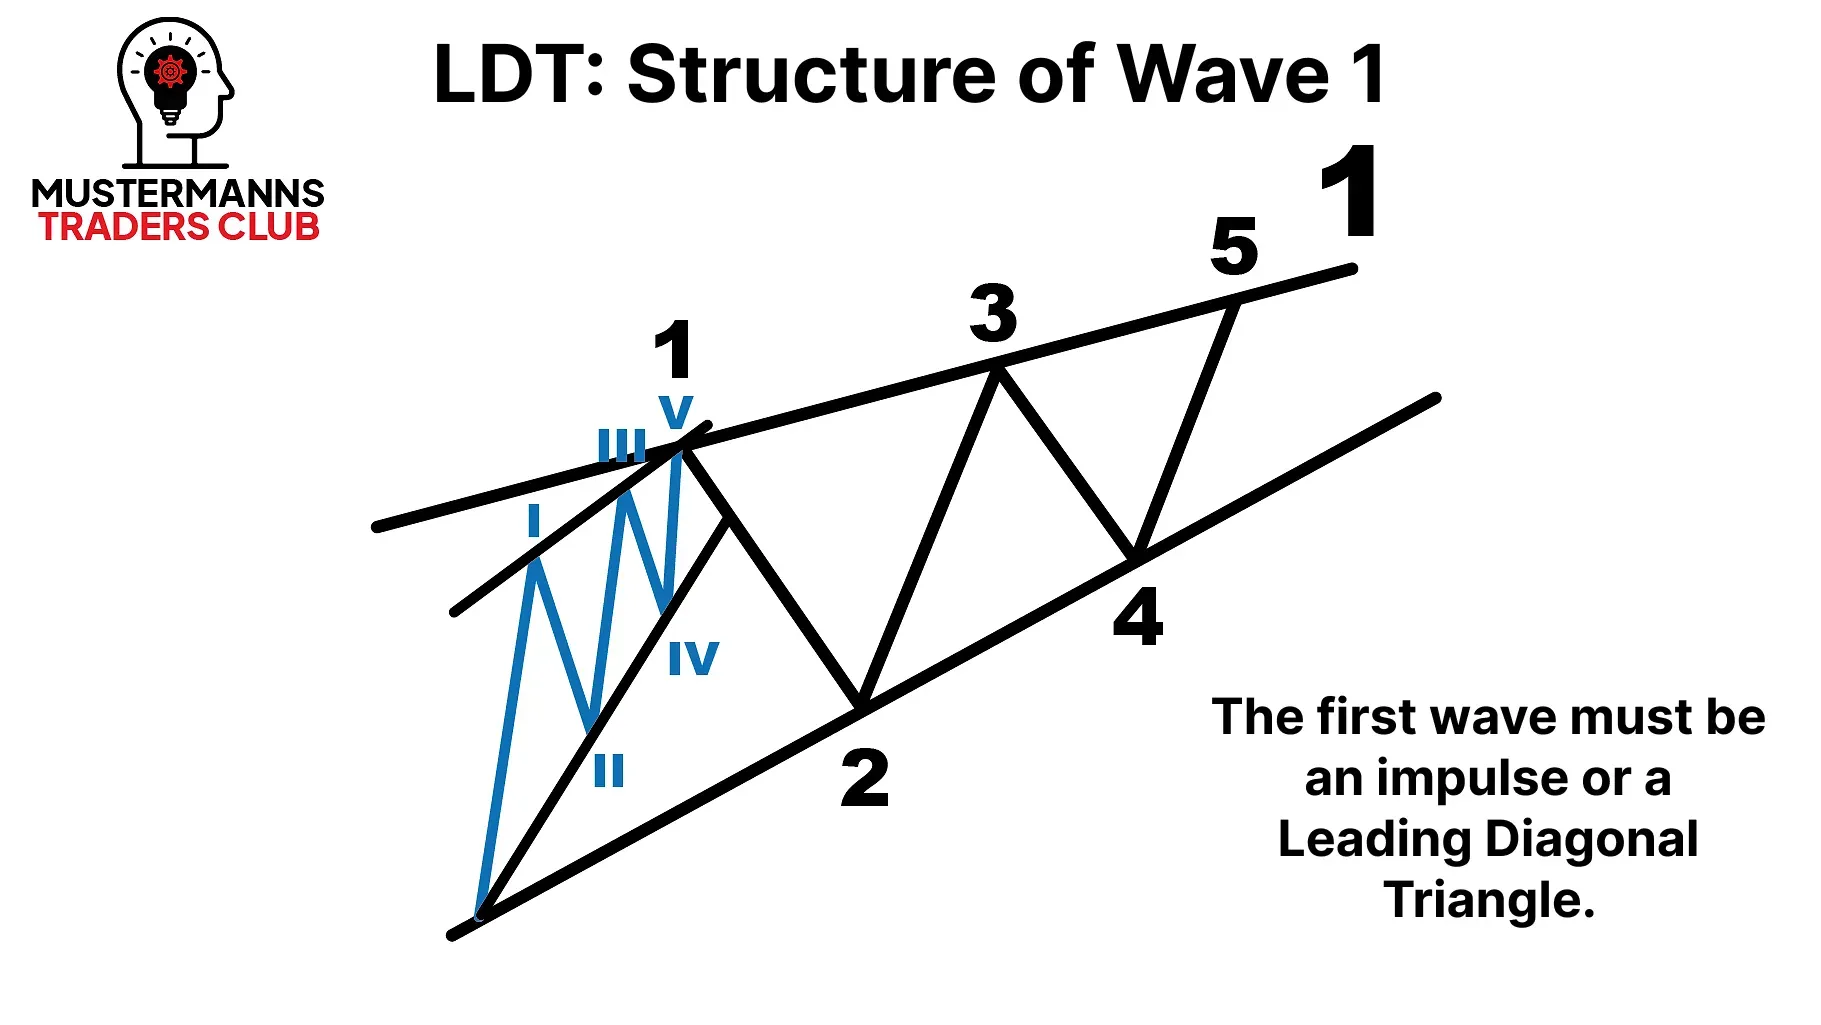
The first movement in an LDT can be a five-wave impulse or an LDT itself. Tip: Also analyze the structure of the subordinate impulse wave! There are correction waves, which are also five-wave waves. You can distinguish these from a real impulse wave by making sure that the first, third and fifth waves themselves have a five-wave structure, i.e. that they are impulse waves.
The Reaction - Wave 2
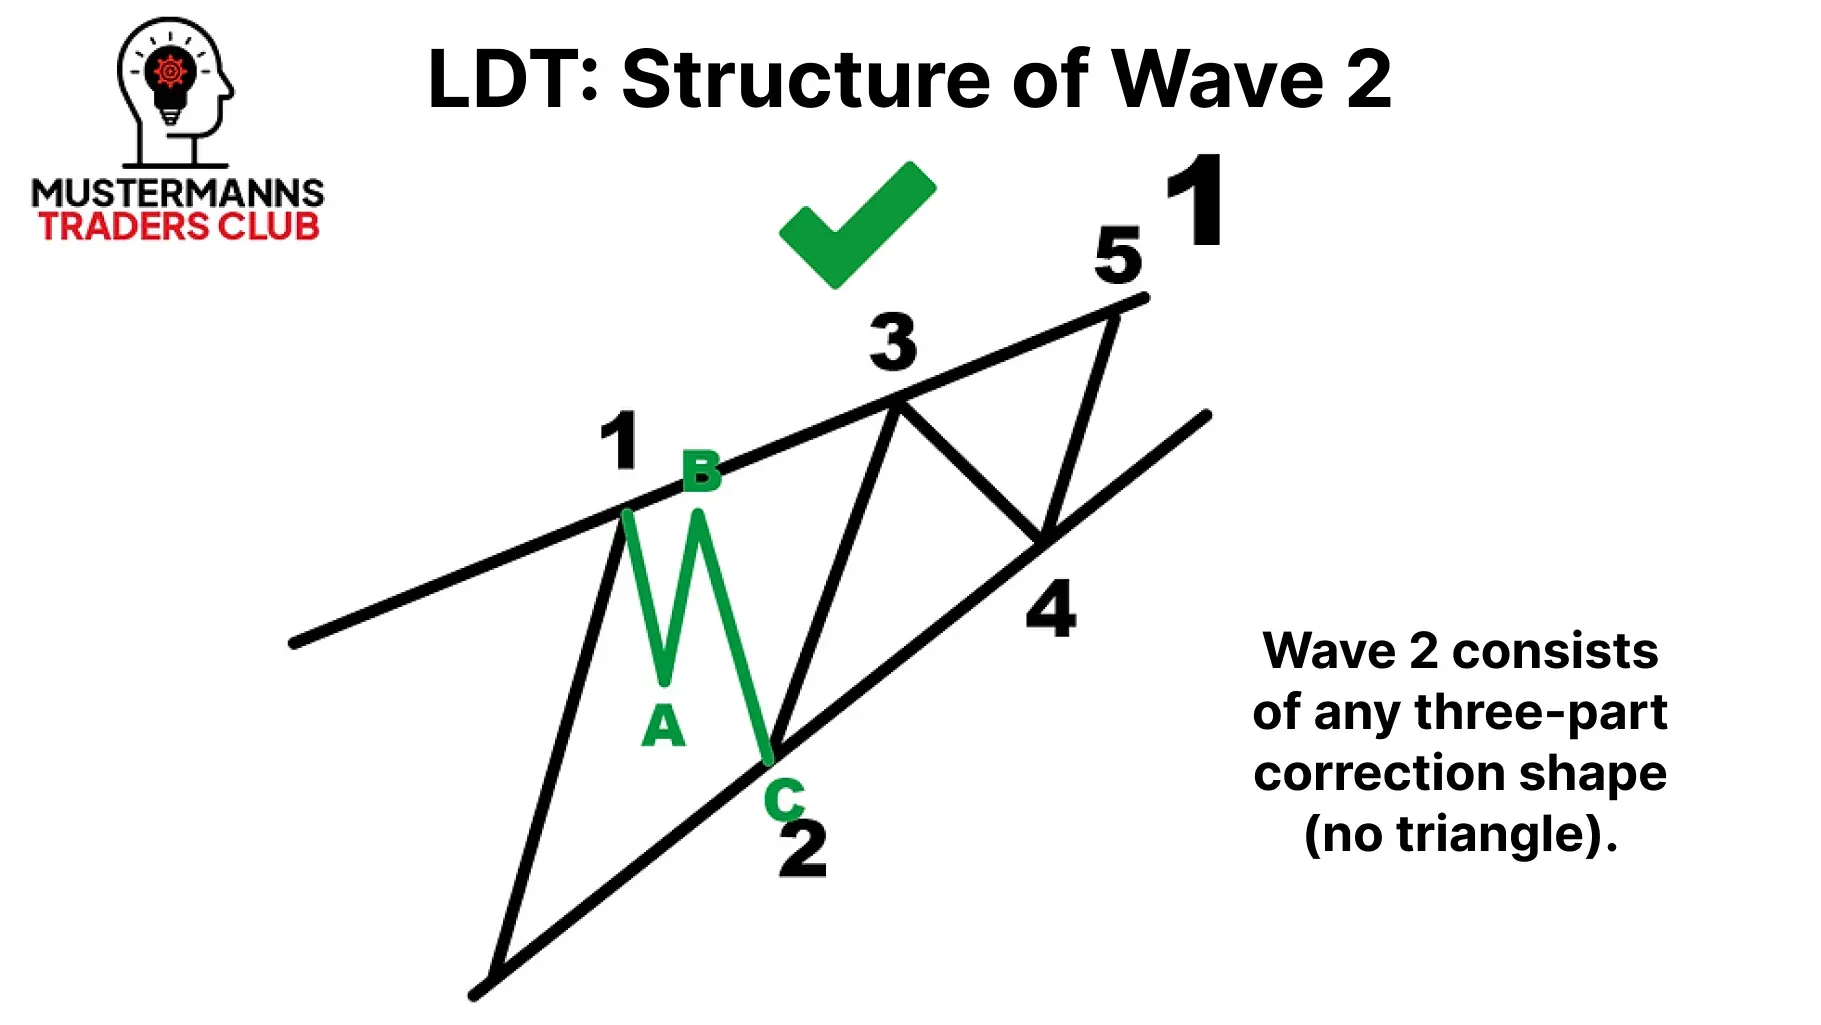
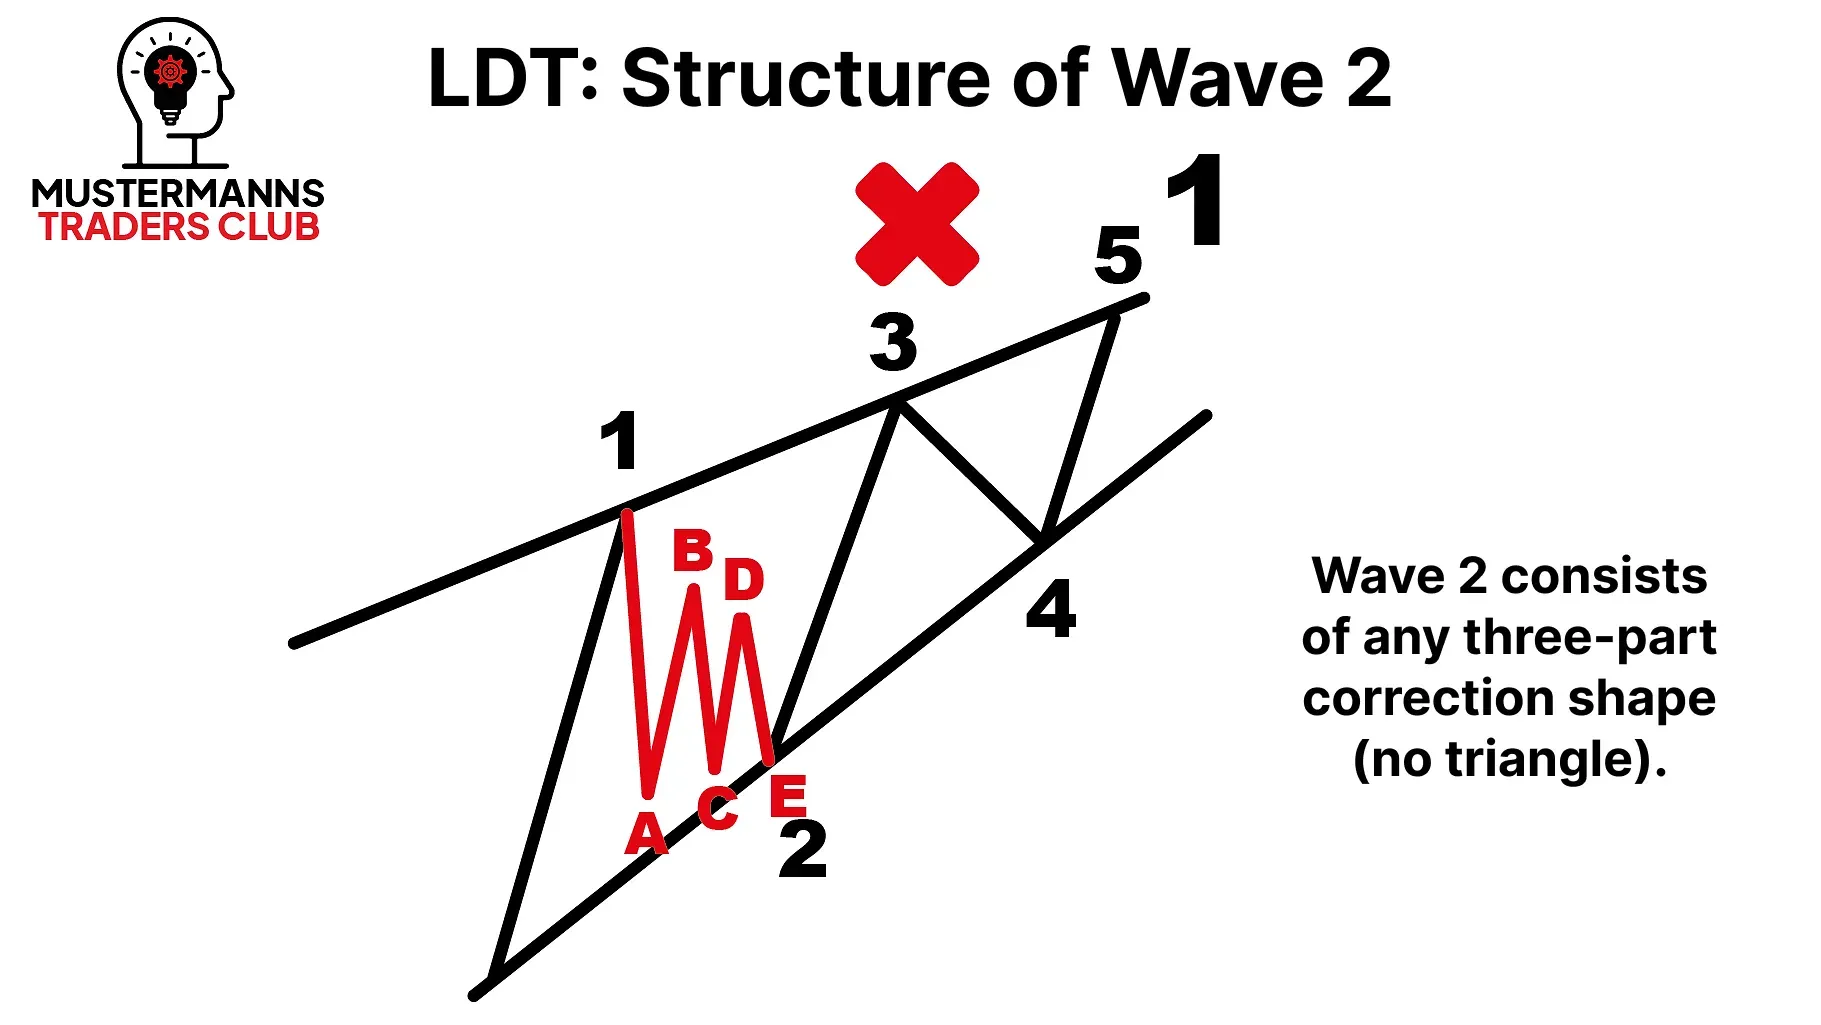
Just like the normal impulse, wave 2 can consist of all possible corrective waves except triangles. If you find a triangle in the second wave of your LDT, your count is wrong.
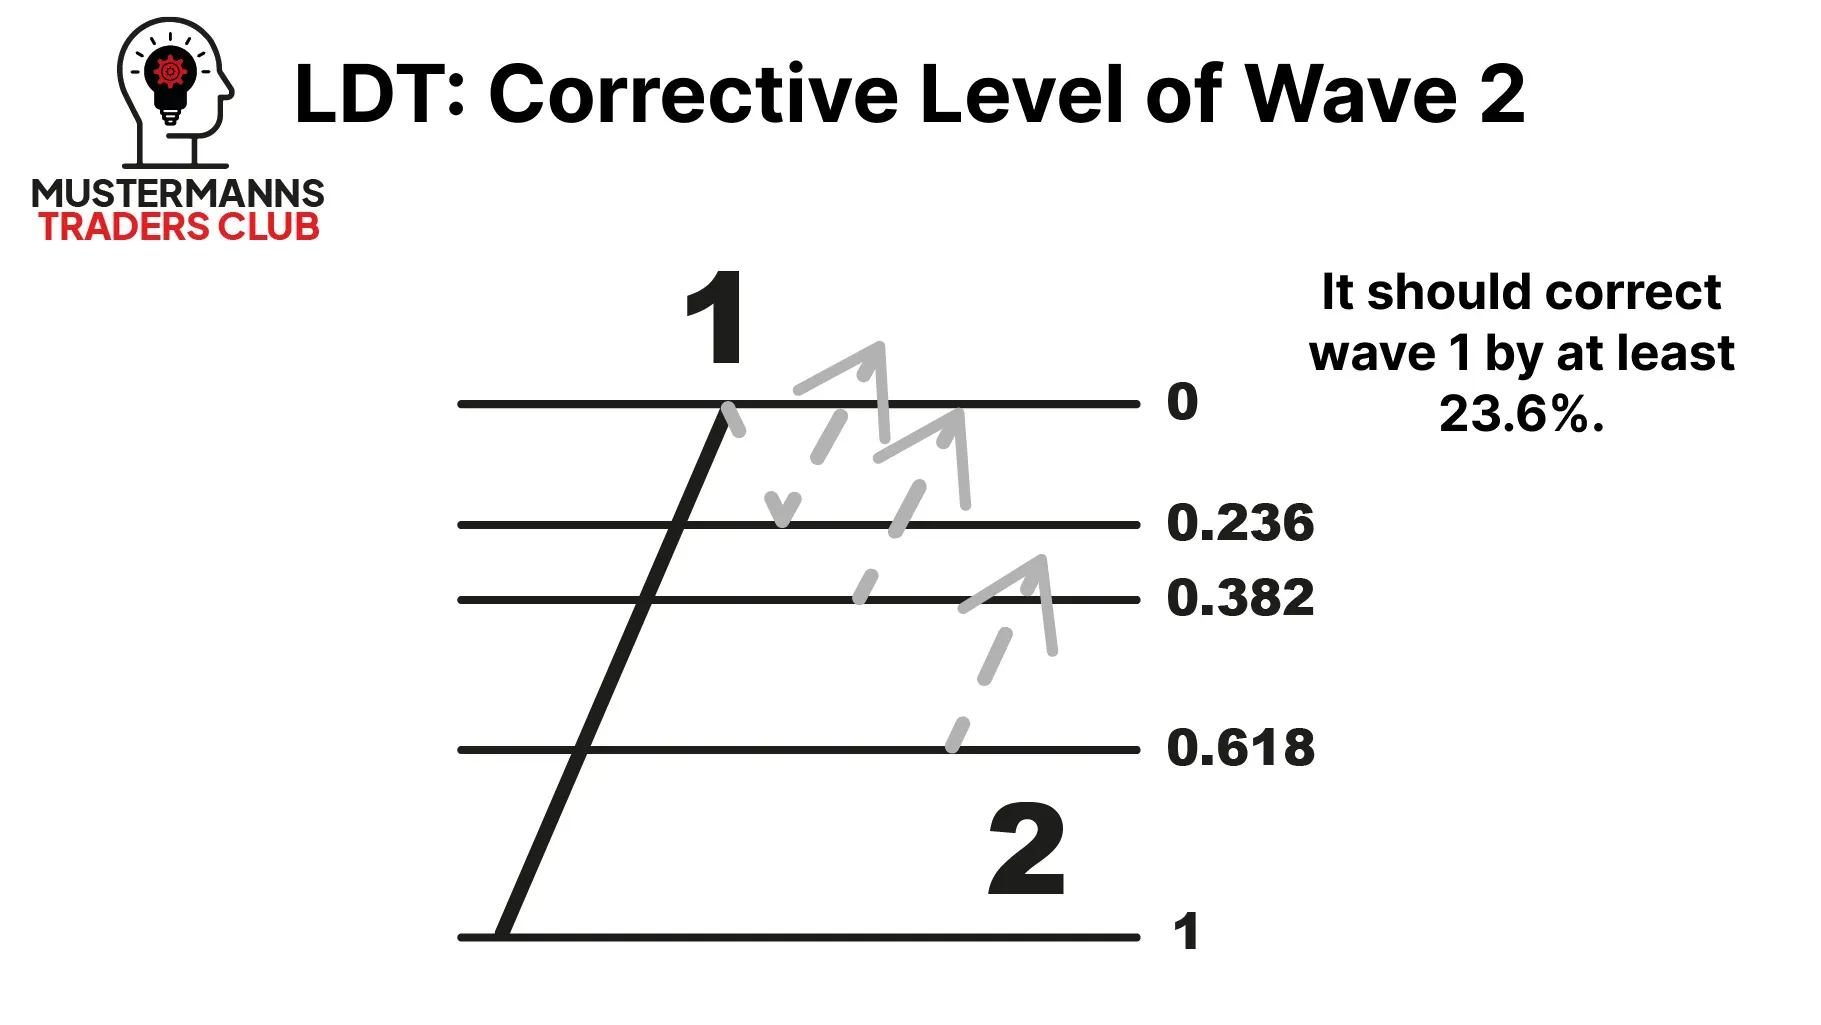
As you can see, the relevant correction levels of wave 2 are the same as for the impulse. Wave 2 should correct wave 1 by at least 23.6%. The 38.2% and 61.8% Fibonacci retracement are also important starting points for the correction. Since the LDT is an impulse wave, you must always take into account that the correction in wave 2 does not intersect the origin (i.e. the low) of wave 1.
No rocket? - Wave 3
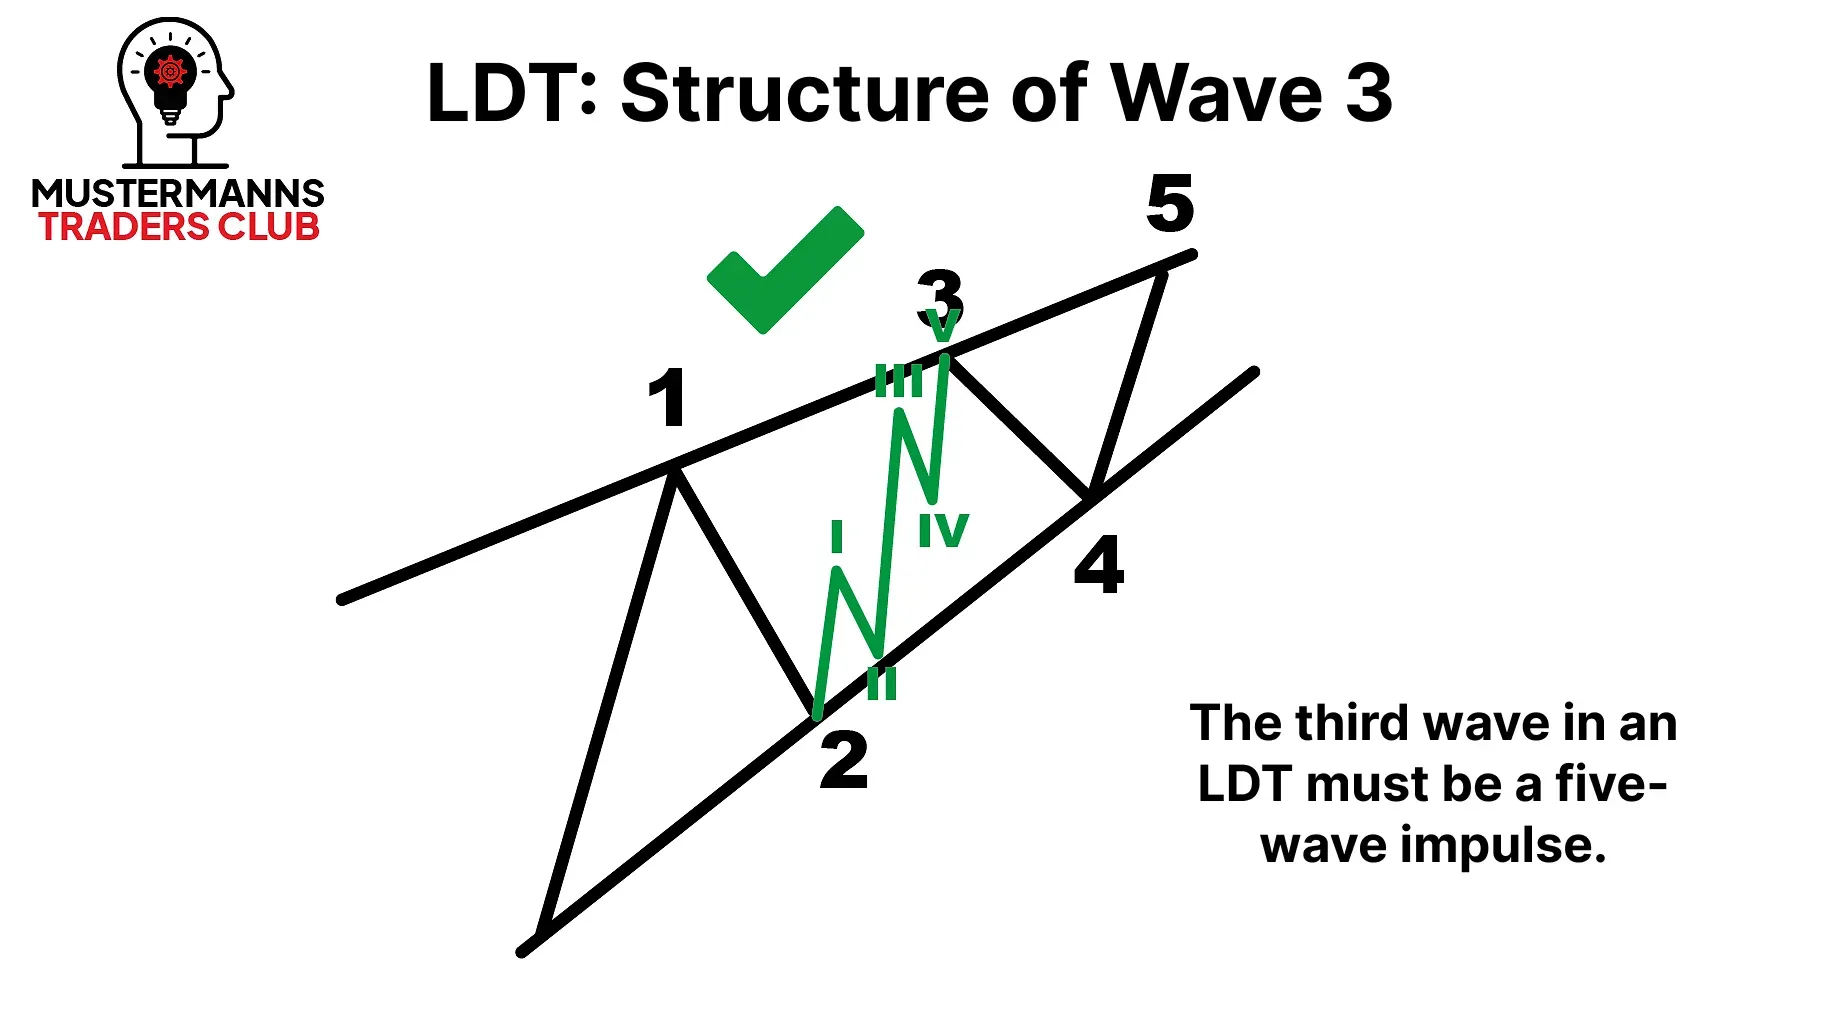
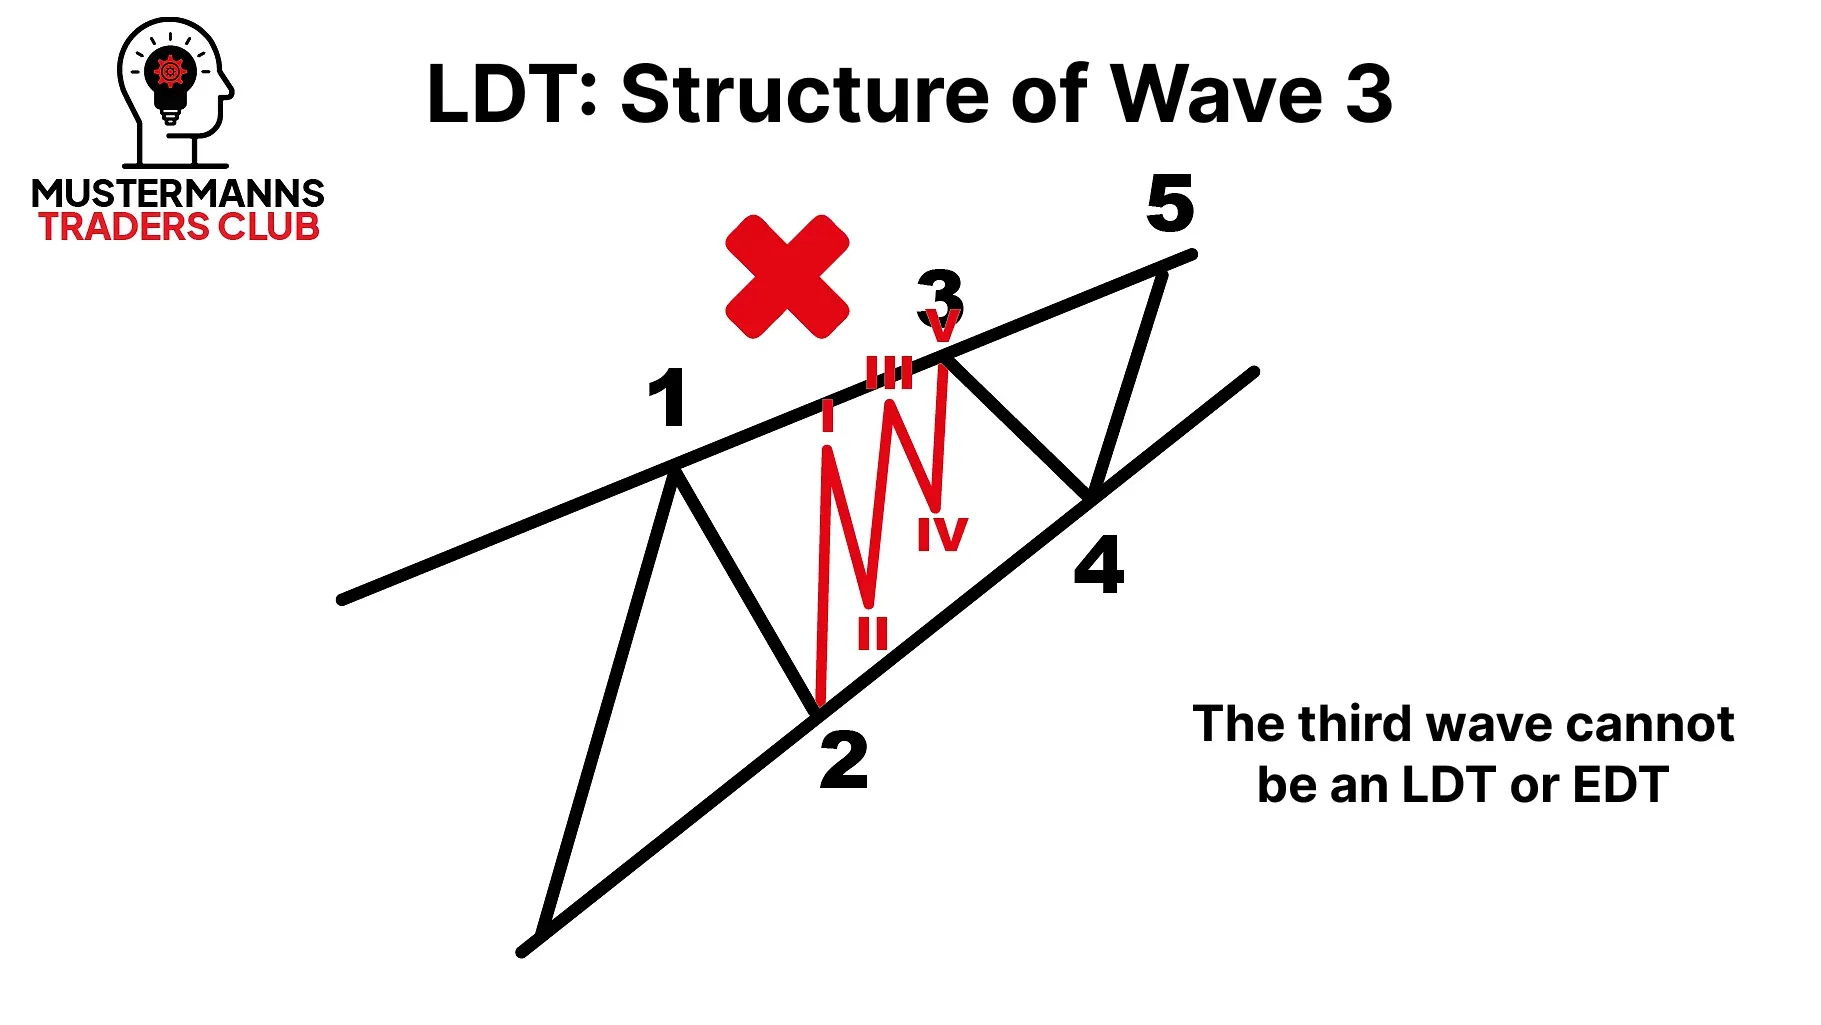
There are also similarities in wave 3 to wave 3 in the impulse. Here, wave 3 must also consist of an impulse and be higher in price than the high of wave 1. The biggest visual difference between the impulse and the LDT is probably the extent of wave 3. While it is common for it to be the largest wave in the impulse, it is usually smaller than wave 1 in the LDT. However, it should not be forgotten that it must never be the smallest.
The Trademark - Wave 4
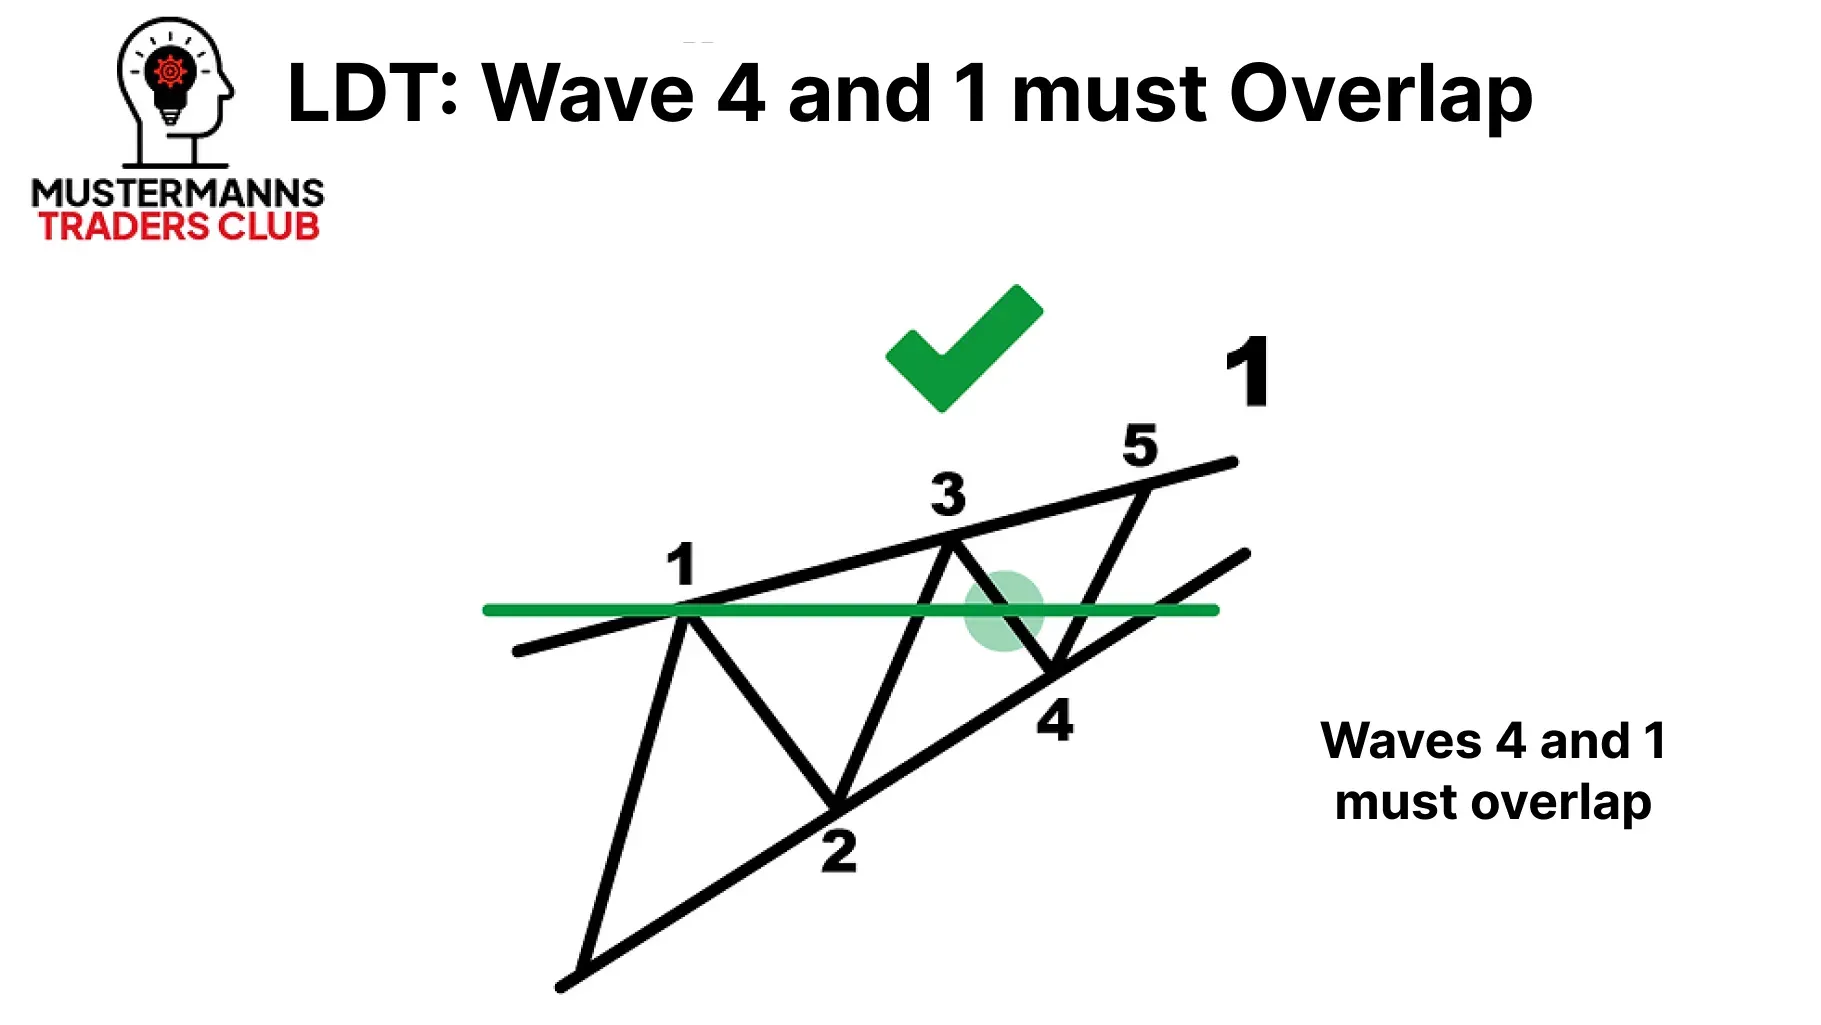
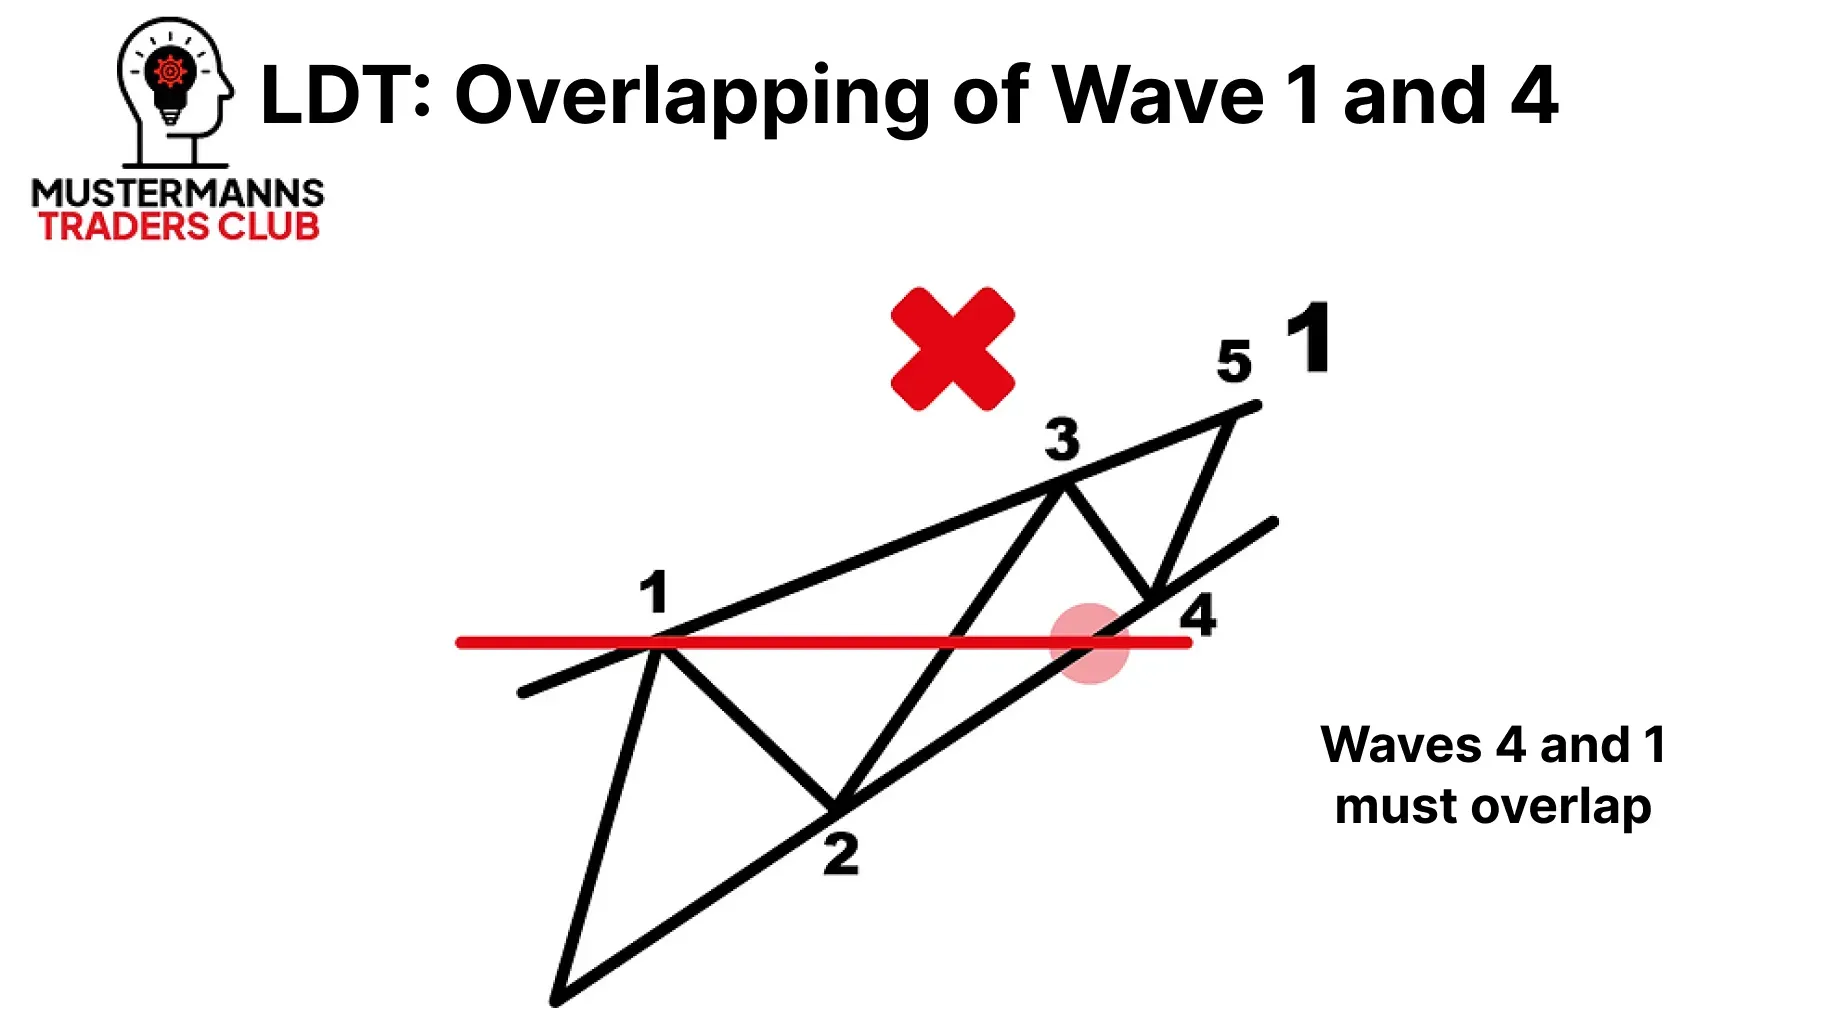
The correction that follows wave 3, wave 4, makes the LDT special. In contrast to the impulse, wave 4 must intersect the high of wave1. This characteristic is the prerequisite for identifying an impulse wave(in wave 1) as an LDT. If waves 1 and 4 do not overlap, a normal impulse is present in most cases.
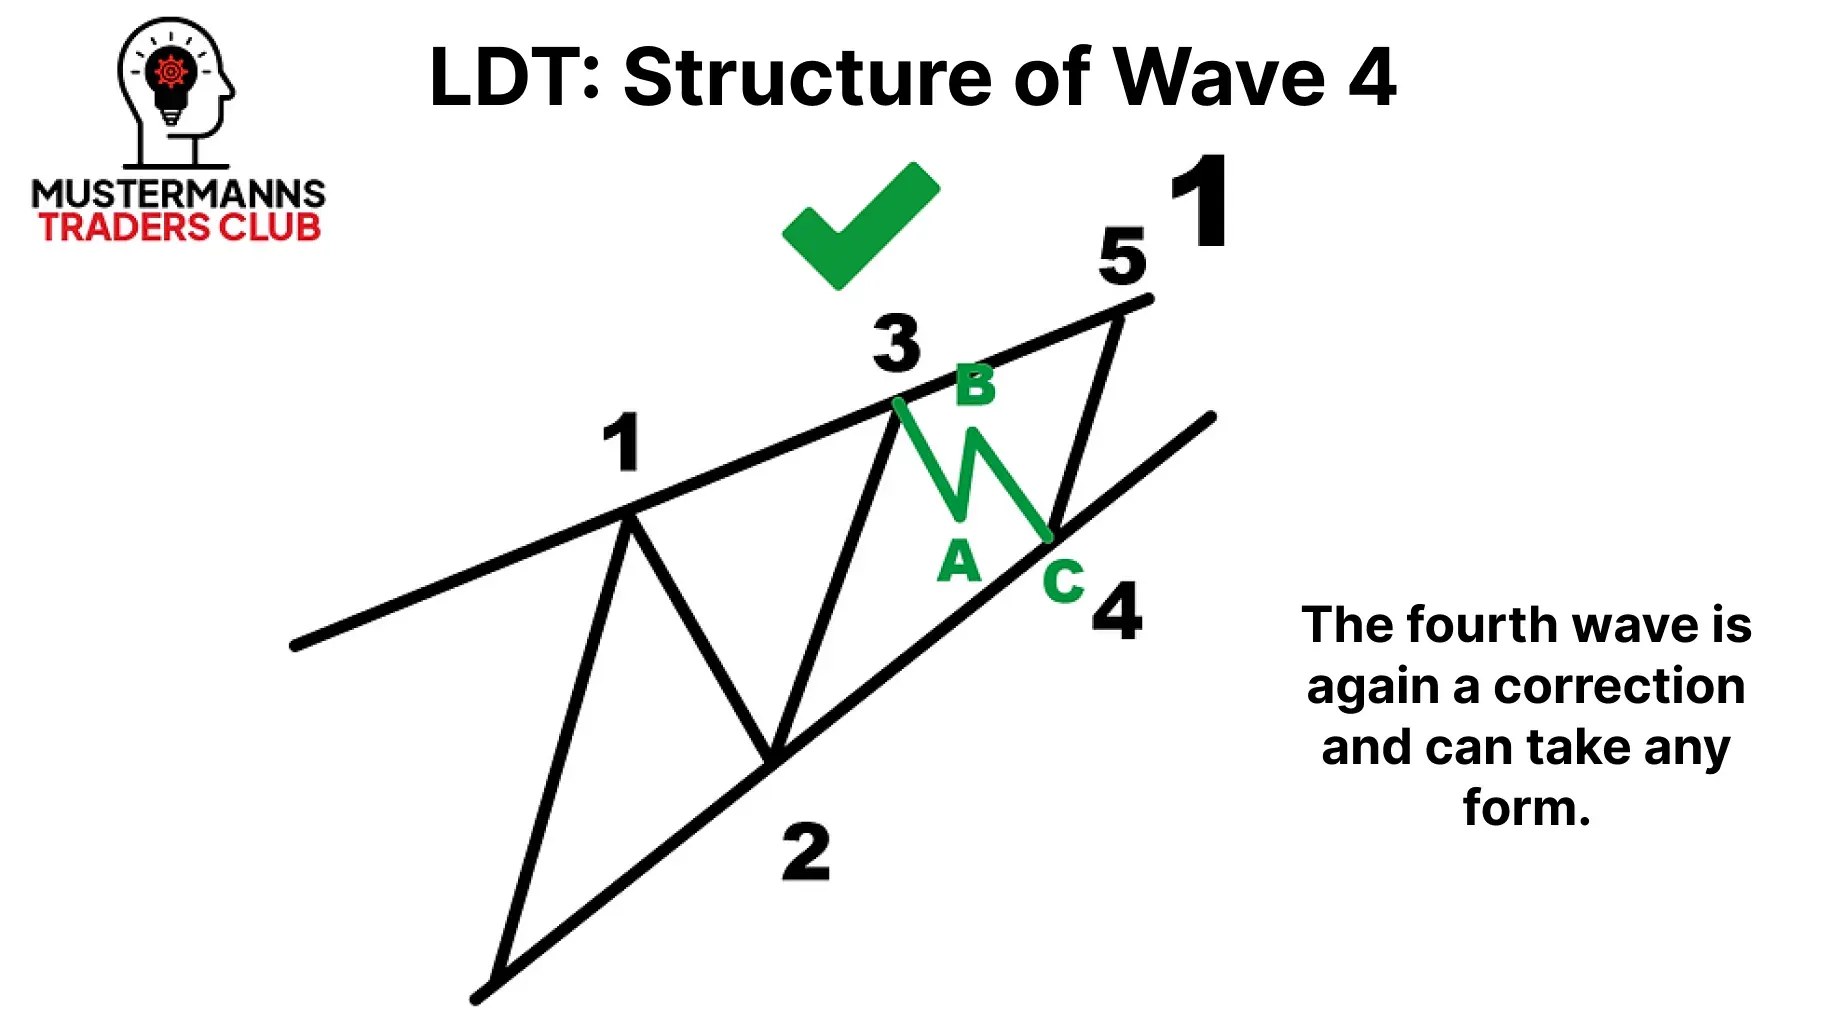
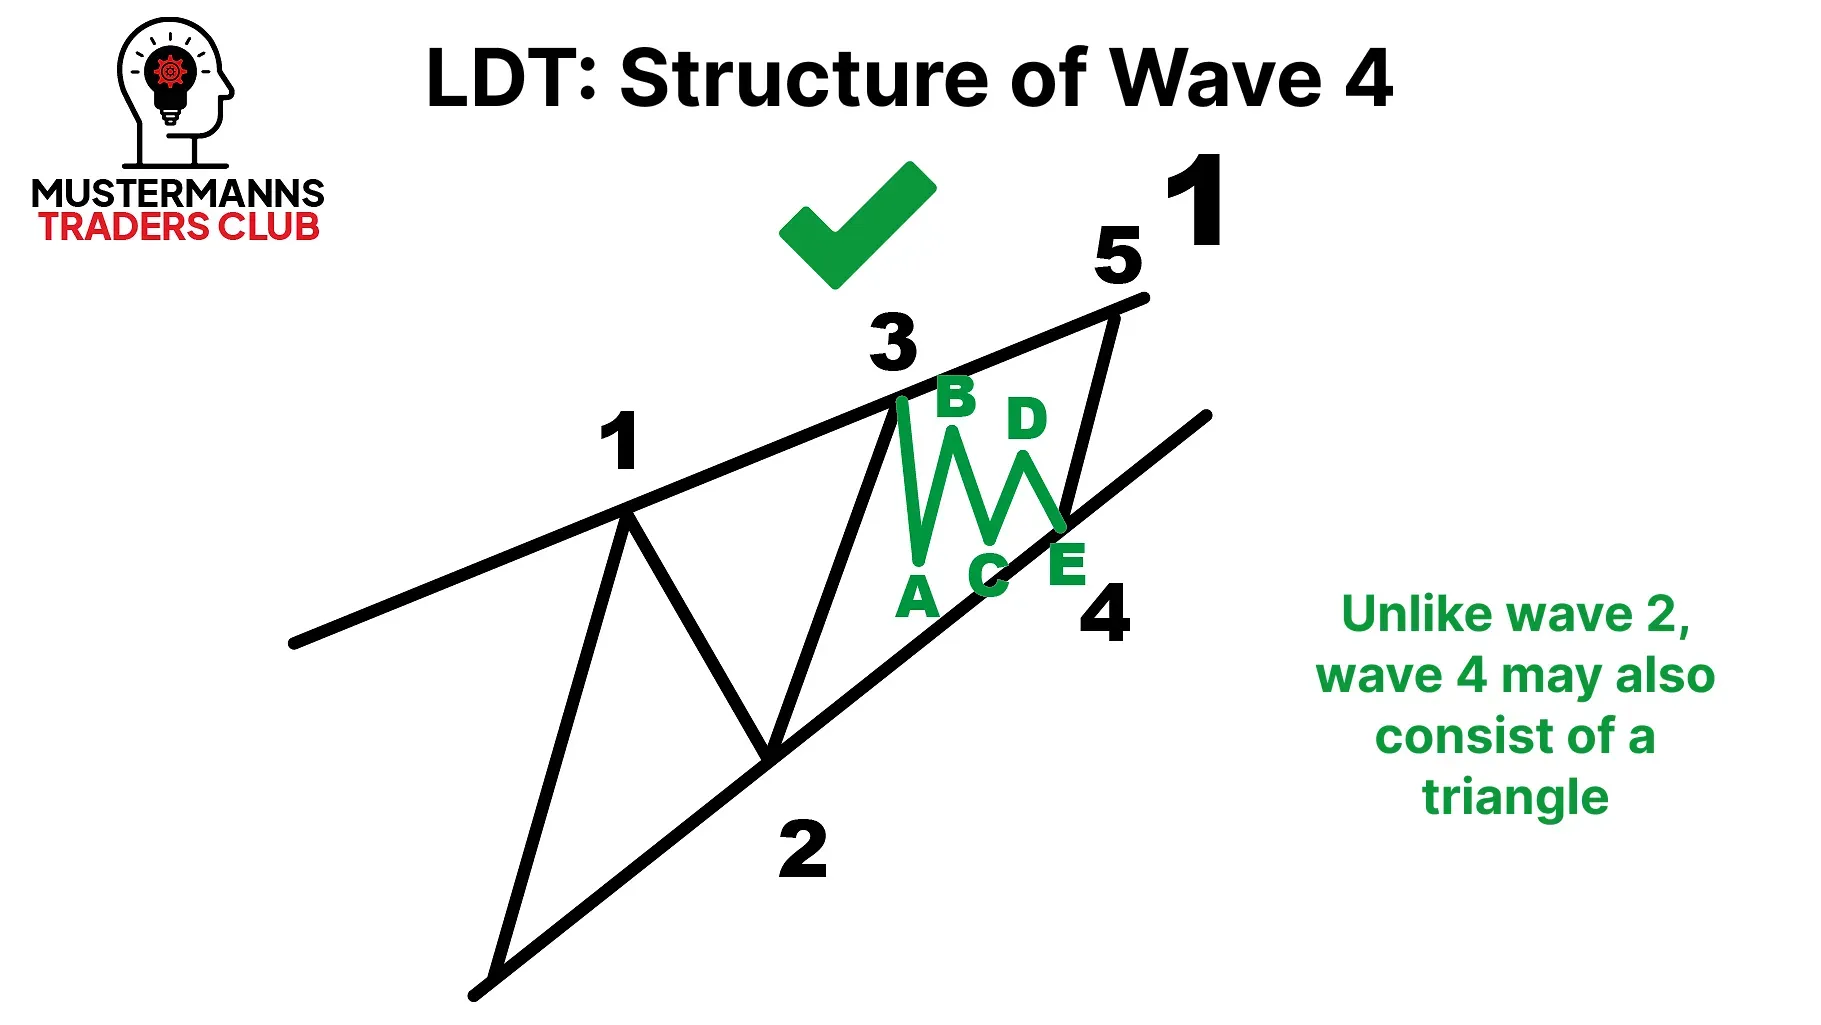
Wave 4 can consist of any correction. A triangular formation is also possible.
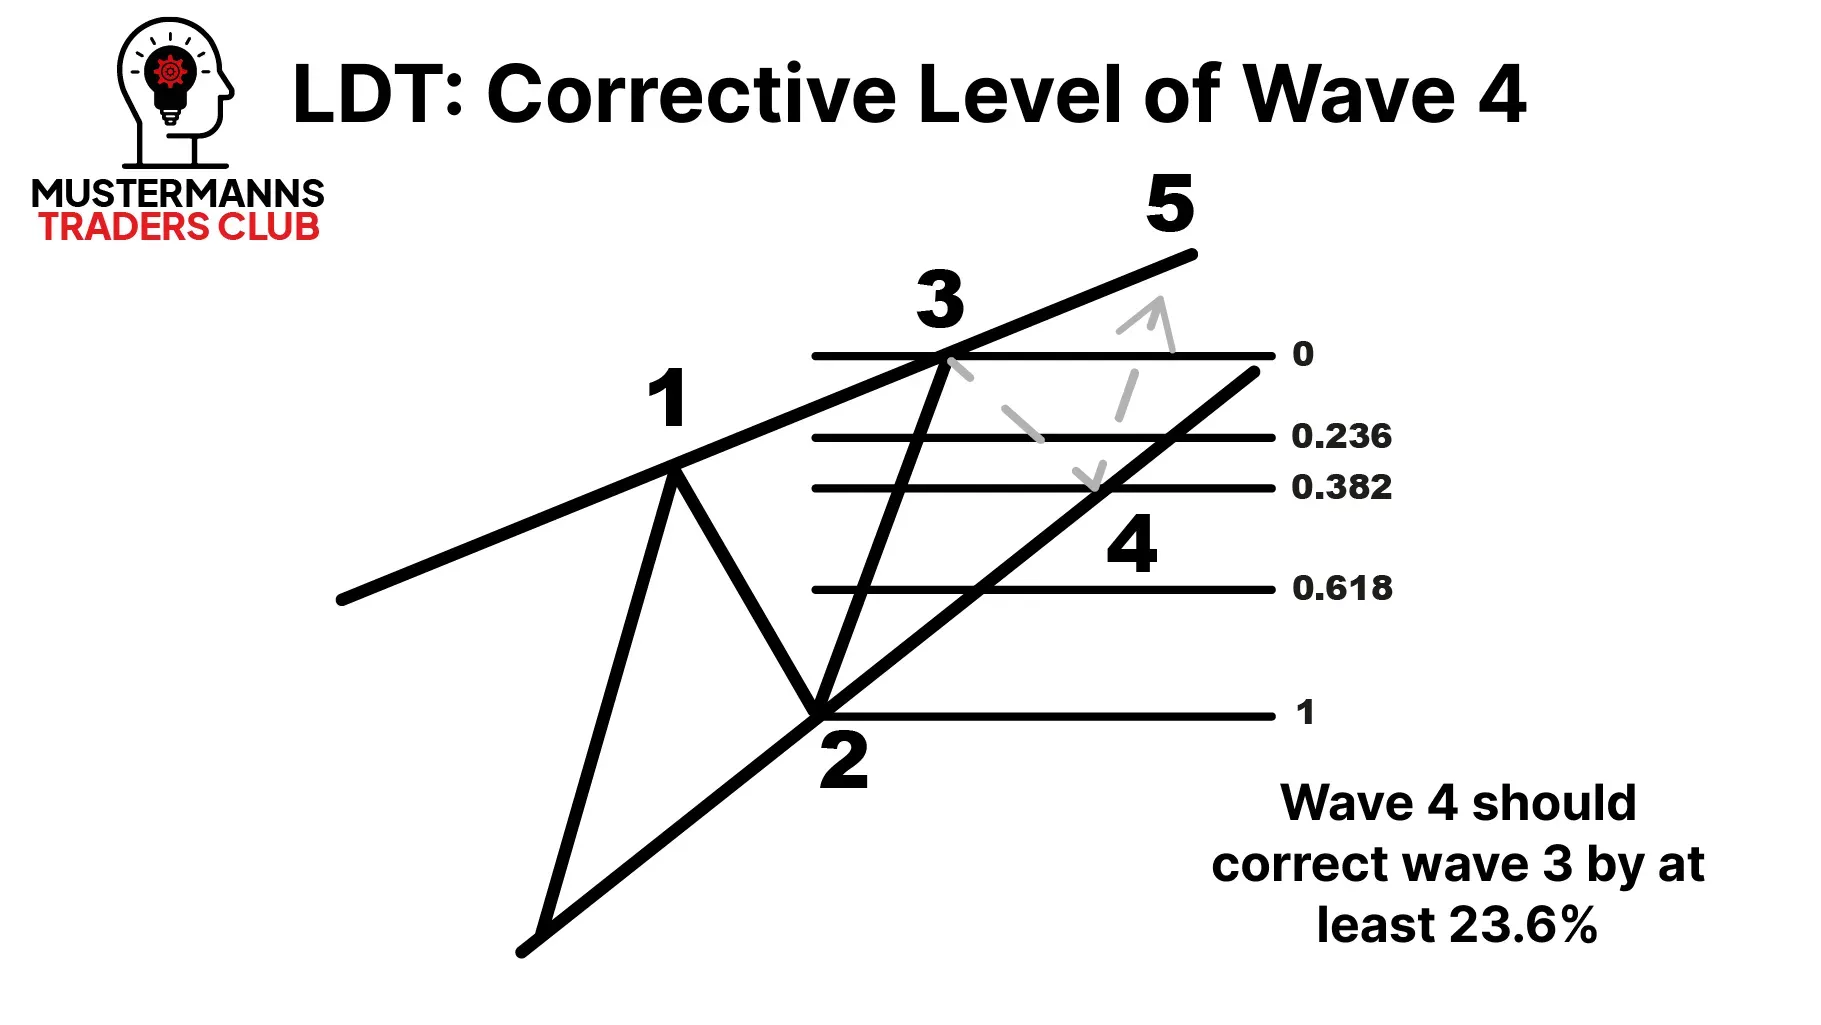
Wave 4 should at least correct wave 3 by23.6%. The lower trend line, which you were able to draw with the help of the lows of waves 1 and 2, helps you to narrow down the possible reversal points from wave 4 to wave 5.
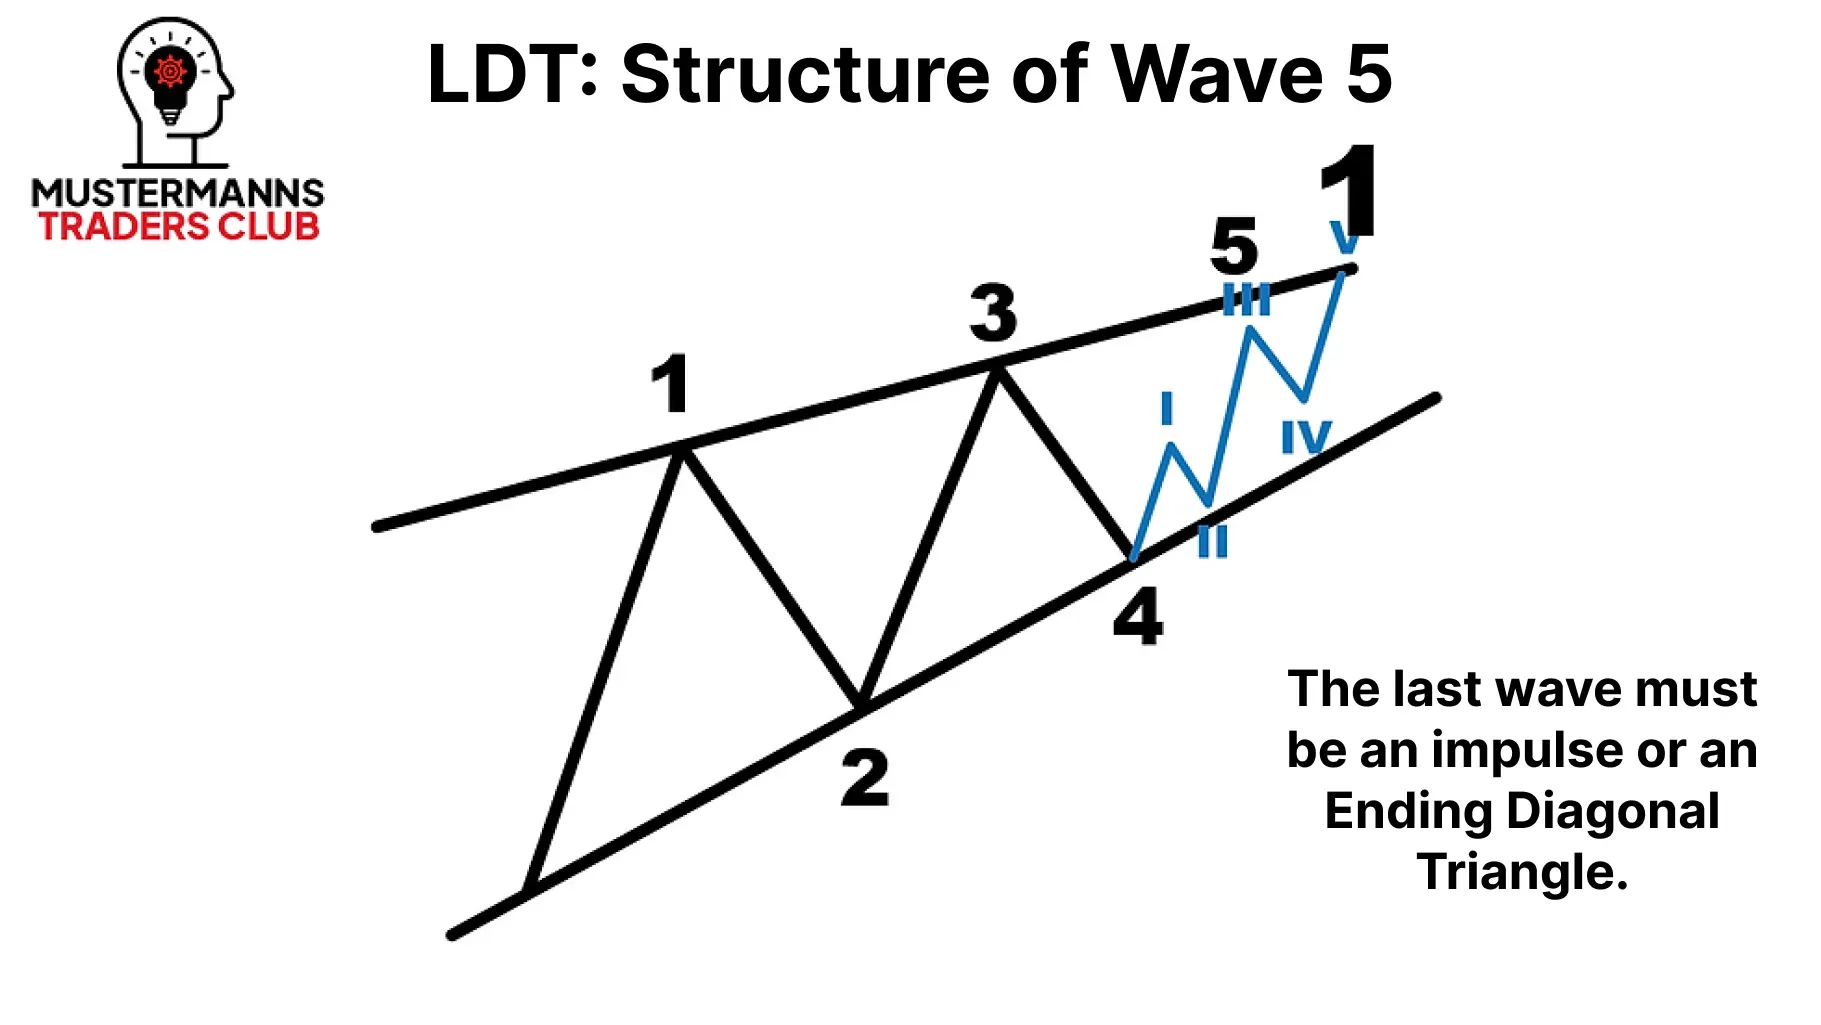
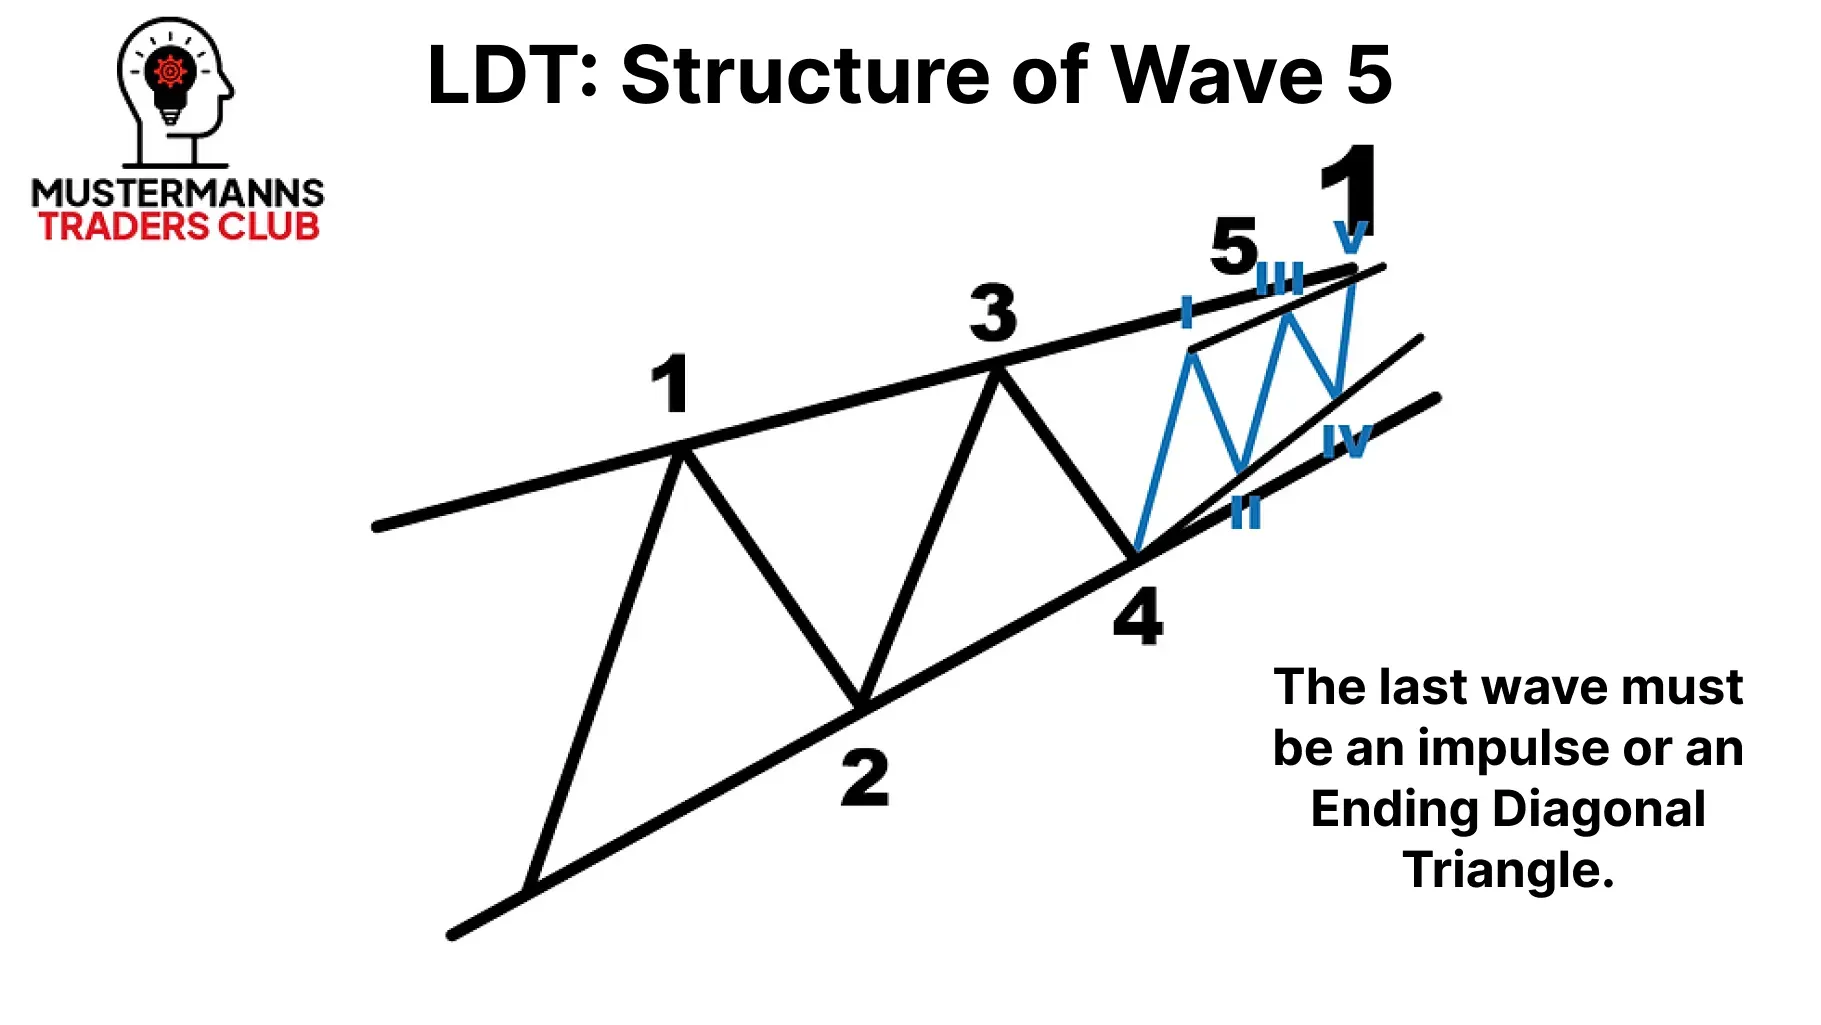
Similar to wave 1, wave 5 can occur in two different variants in the chart. While the normal impulse can be found in all waves, wave 5 is characterized by the fact that it can also consist of an EDT. Bear in mind, however, that an LDT cannot be built up from an LDT and EDT at the same time.
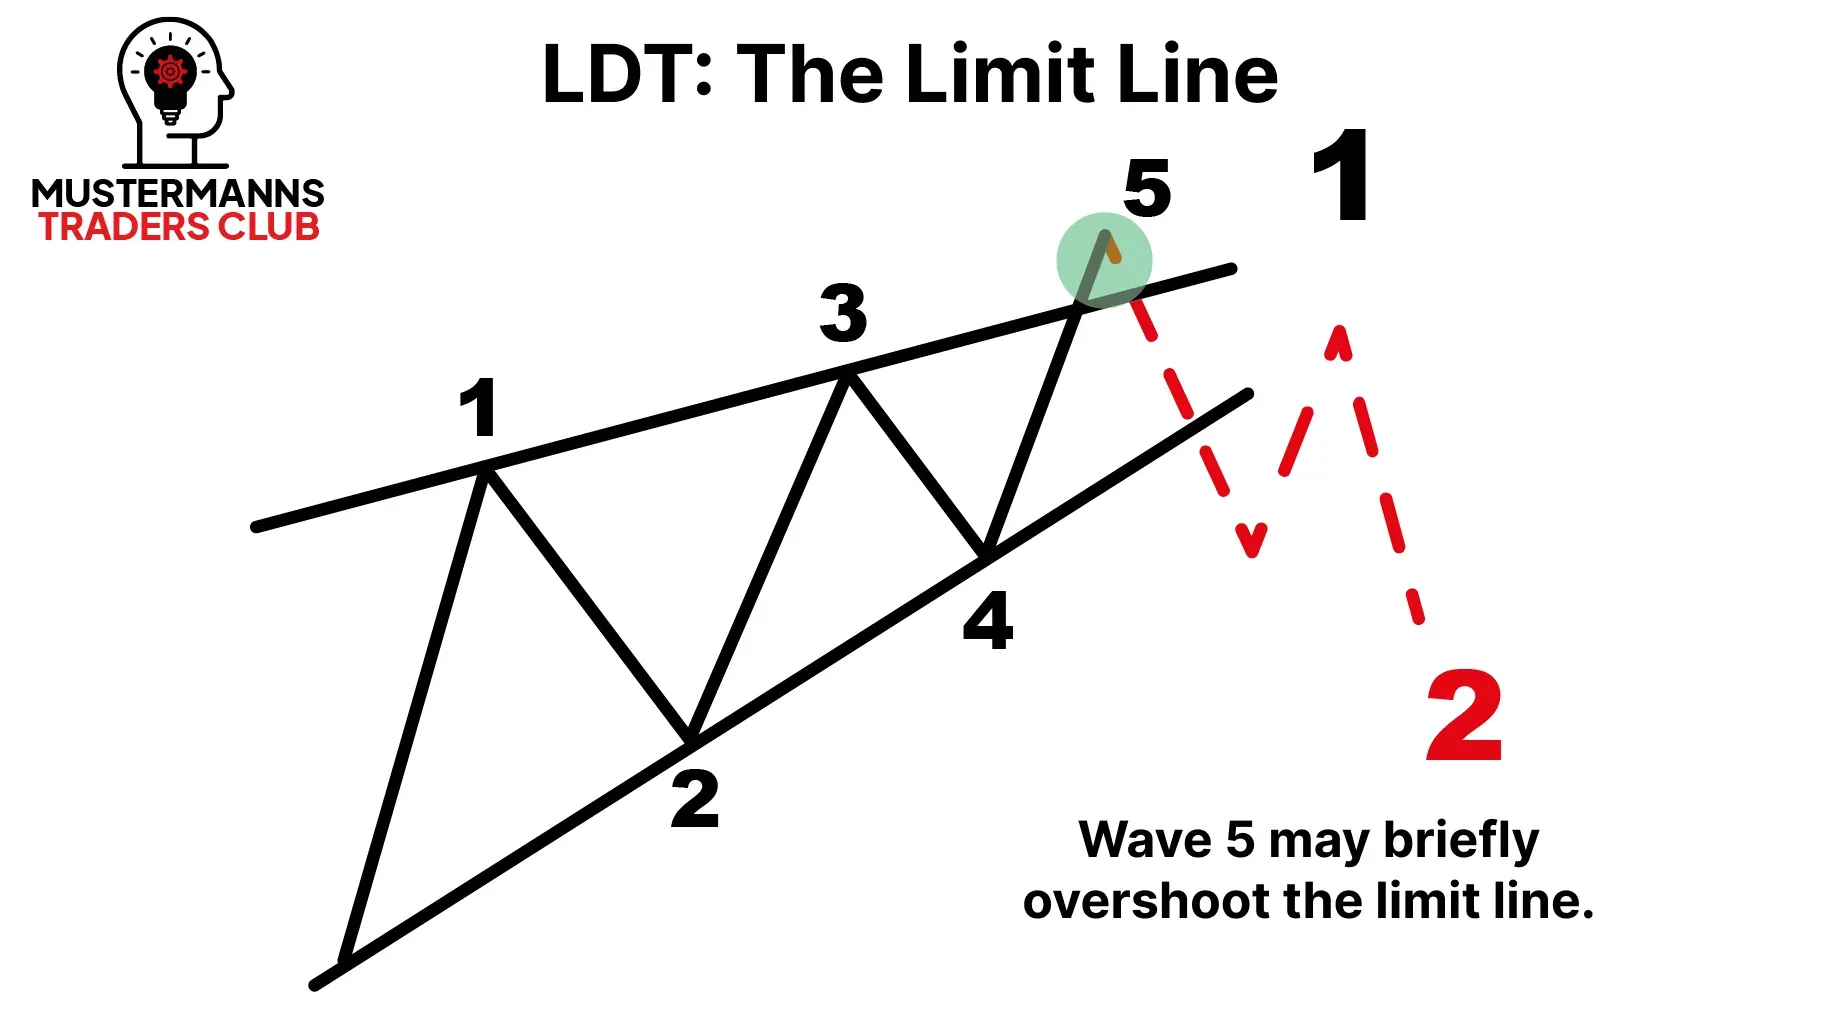
The trend lines, which are defined by the lows and highs, are important reaction markers for the subsequent price movements. If the LDT continues into wave 2, for example, it can often be observed that the corrective wave B represents a retest of the previously broken trend line.
Furthermore, it can often be observed in the chart that the high of wave 5 is formed outside the upper trend line. This phenomenon is also known as a"fake-out" in the break-out strategy. While many market participants see this supposed breakout from the trend line as a buy signal, you should be aware that an LDT could possibly also form, which would then lead to the above-mentioned"fake-out".
Ending Diagonal Triangle (EDT)
EDT - correction or impulse wave?
In the last lesson on the LDT, you already learned that not every impulse wave has the same rules. However, you were able to see that the LDT is very similar to the normal impulse, as both have a 5-3-5-3-5 structure.
The EDT, which we will discuss in more detail here, is different. Although it looks quite similar to the LDT, it has a different internal structure.
Ending Diagonal Triangle
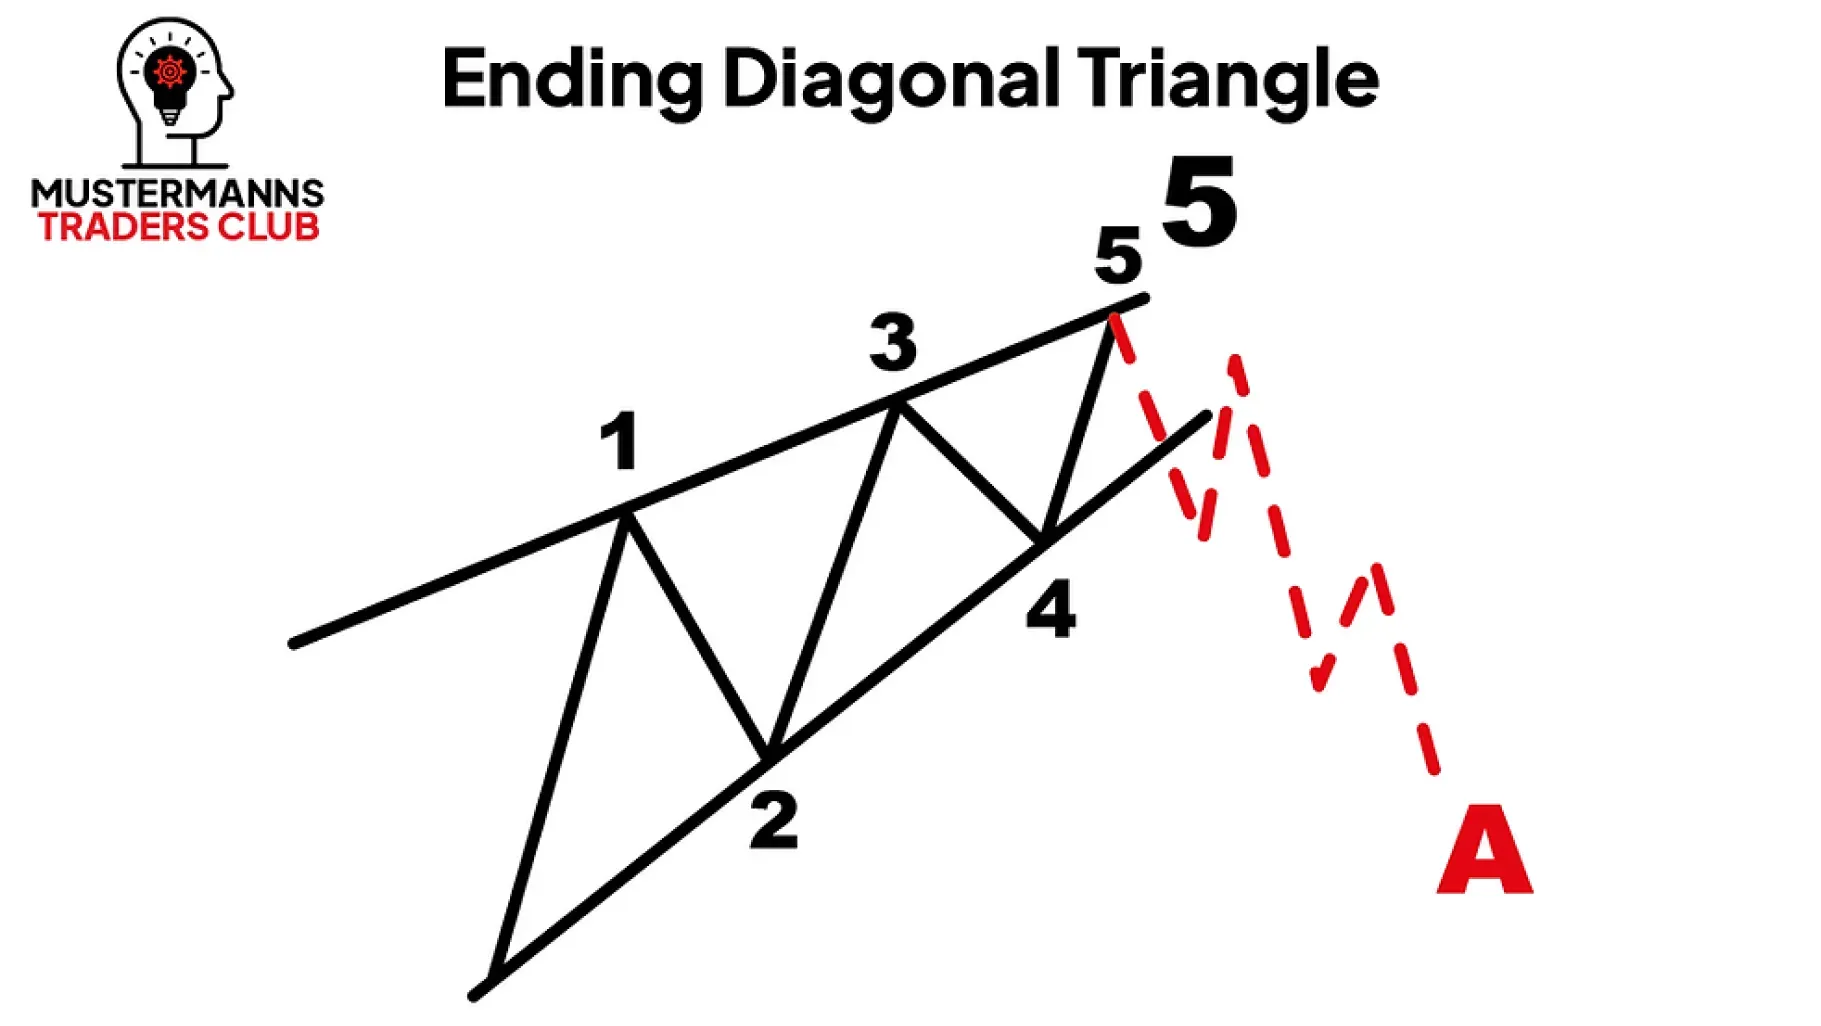
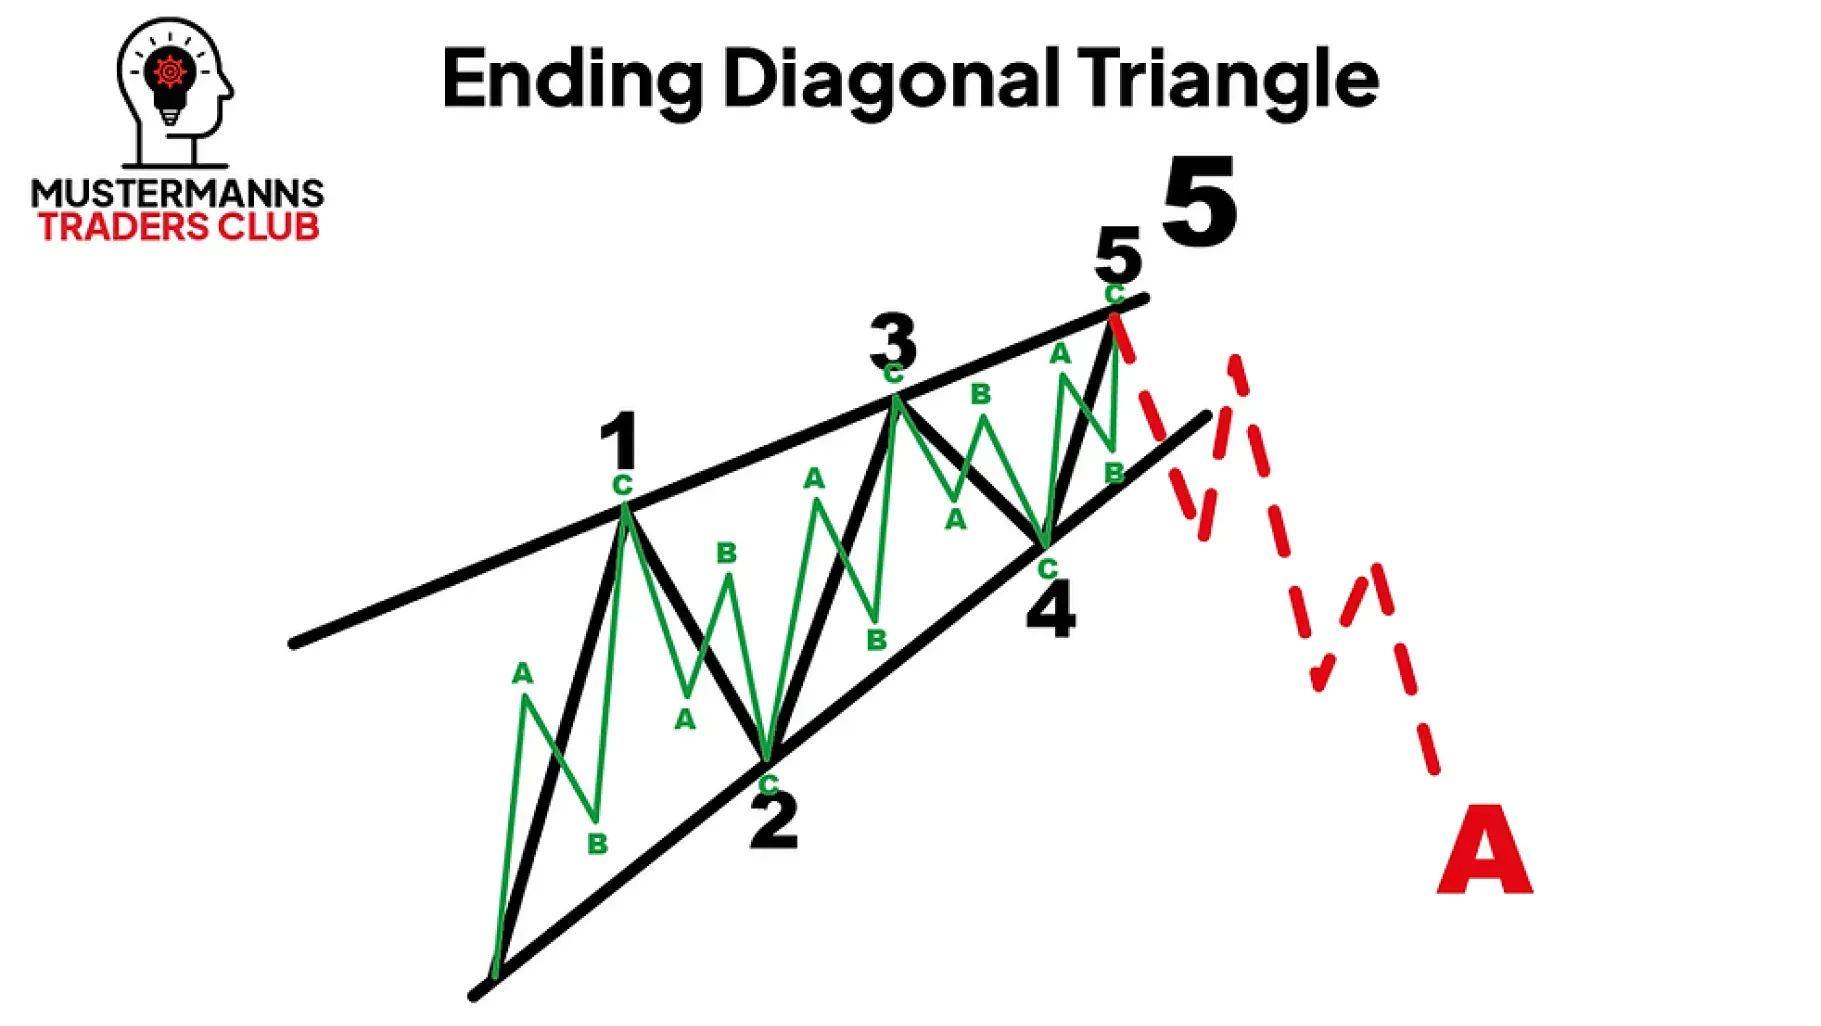
Only corrections - this is what characterizes the EDT. It therefore has a 3-3-3-3-3 structure. Below you can find out which corrective waves are possible in an EDT. Don't be confused if you are not yet familiar with some of the corrective waves. Your knowledge of the basics is sufficient to understand this impulse wave.
The Beginning - Wave 1
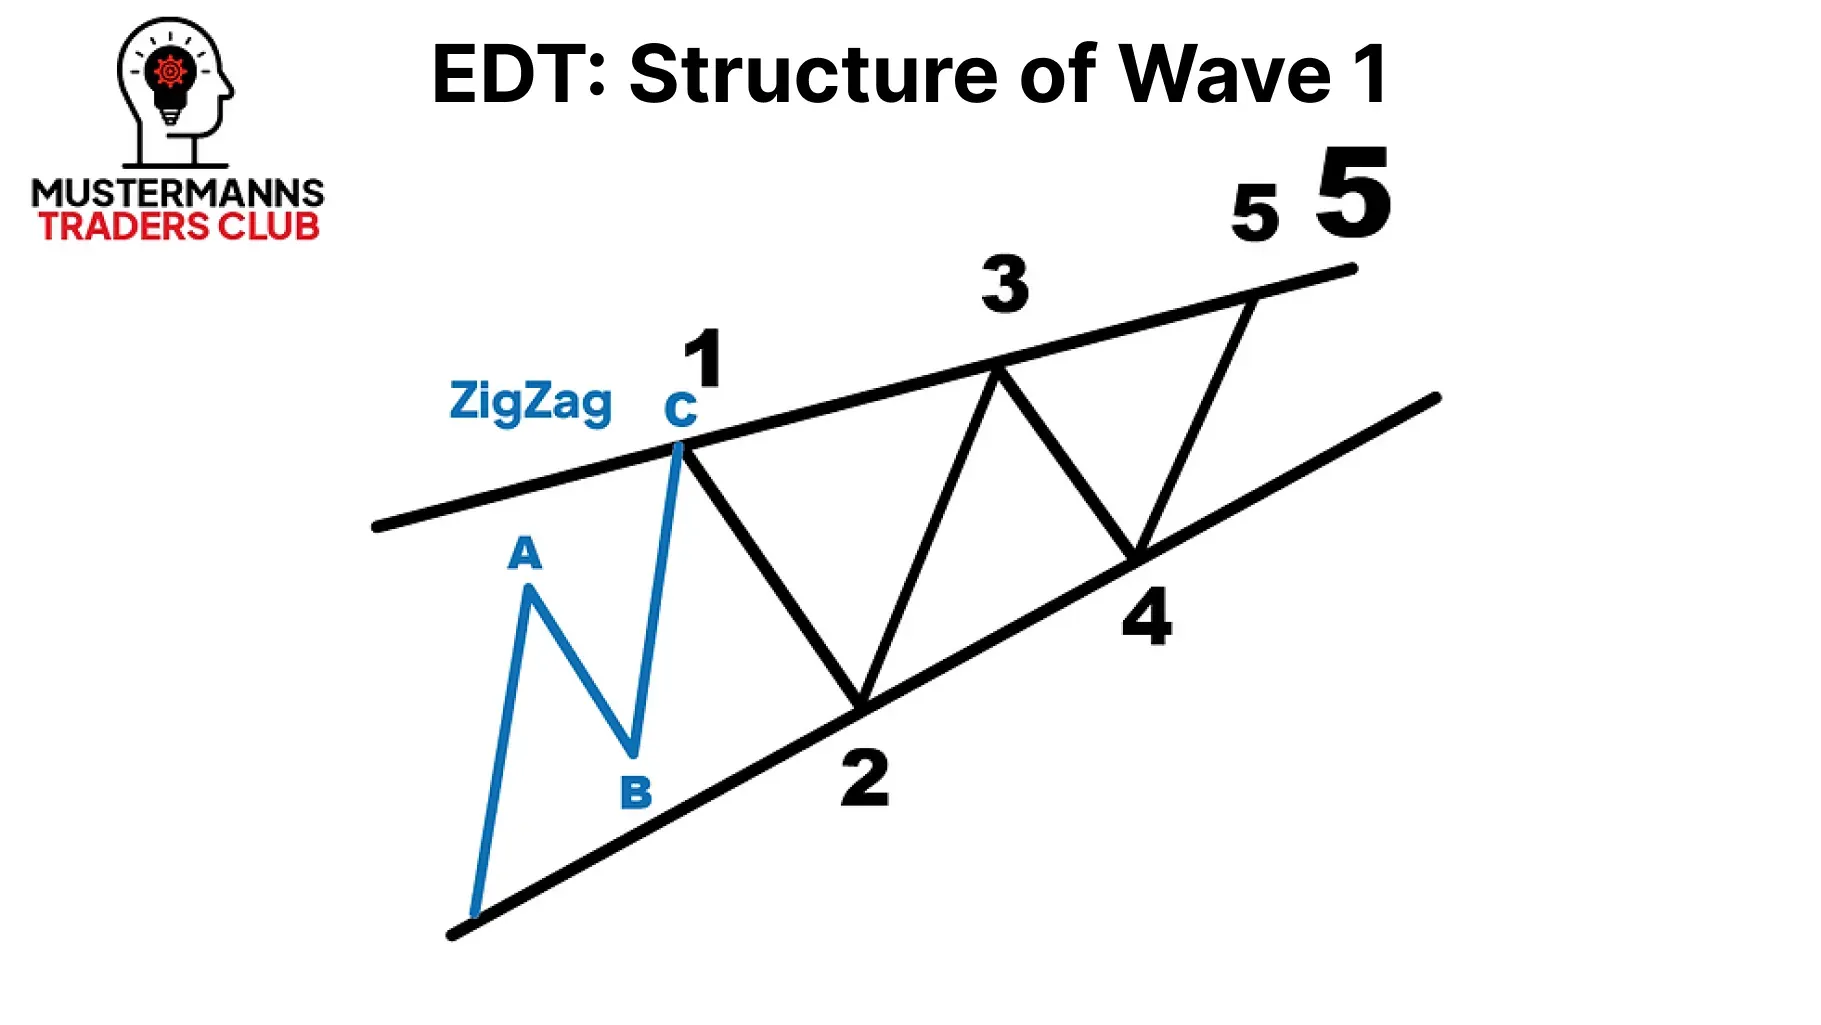
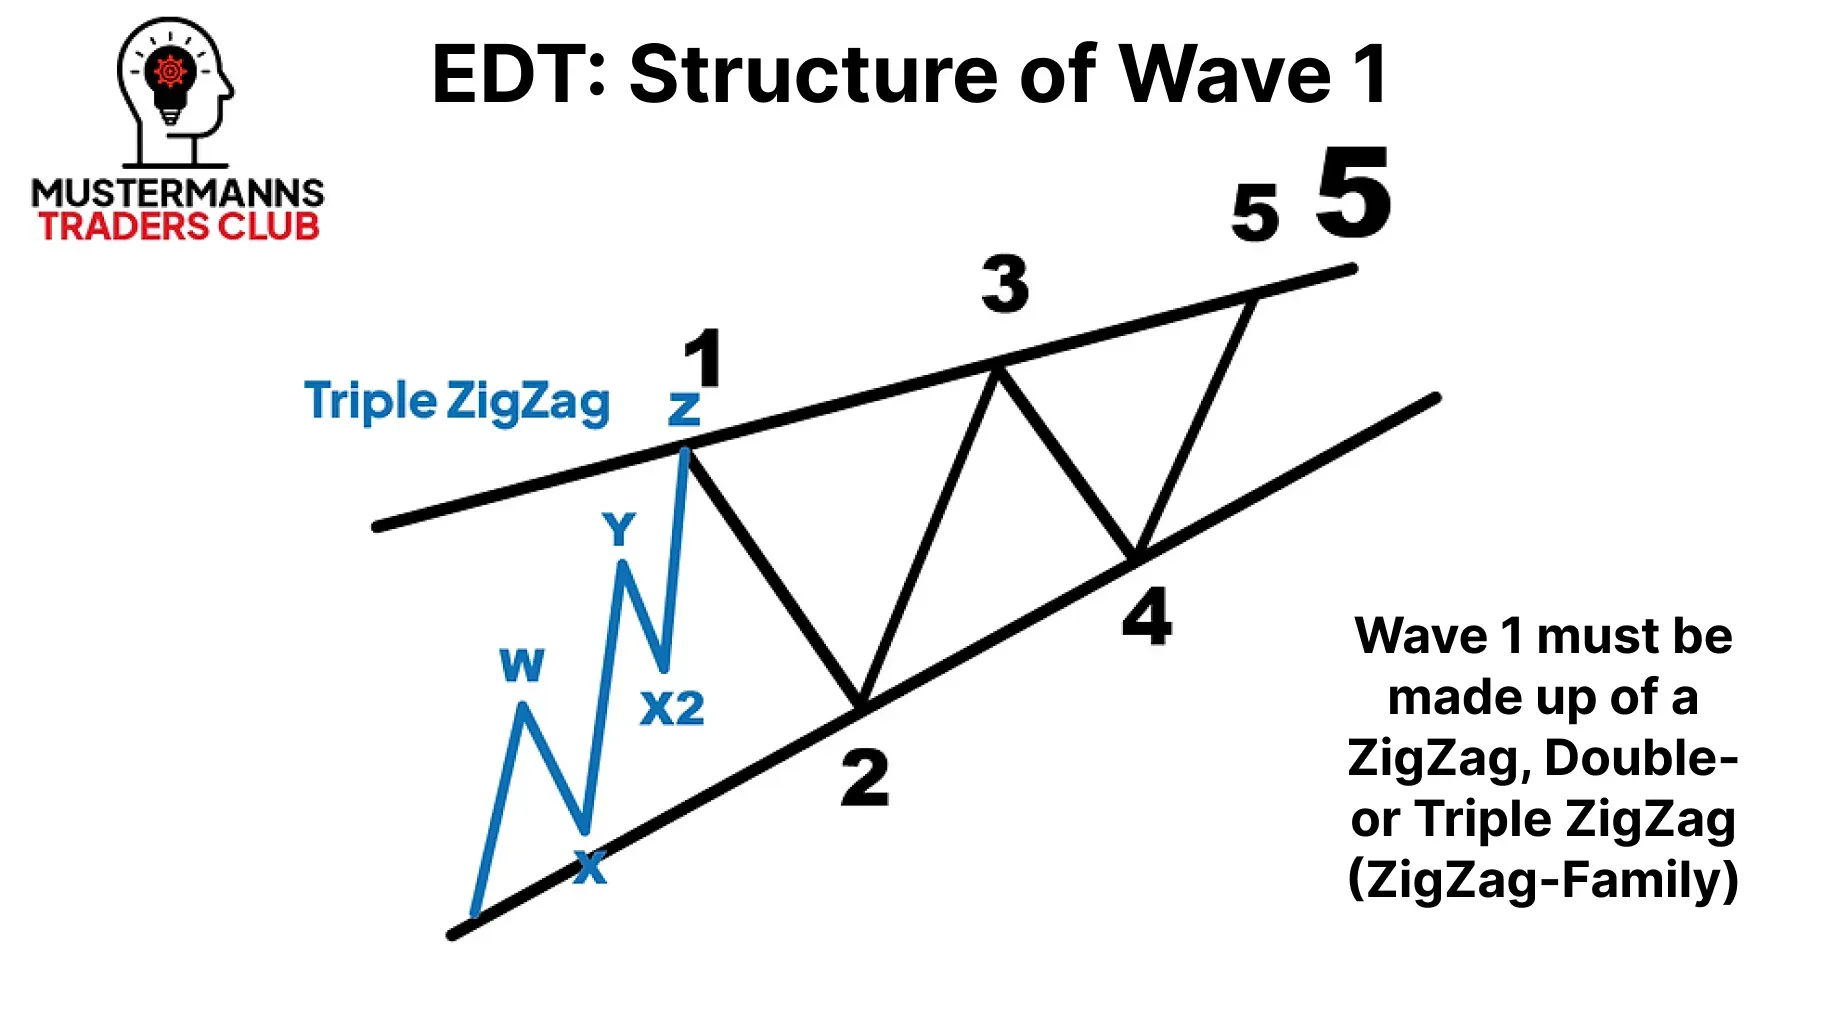
The first move in an EDT must be a corrective wave of the ZigZag family. In other words, a ZigZag, Double-ZigZag or Triple-ZigZag. Unlike the LDT, wave 1 cannot consist of an LDT. Because remember: wave 1 is not an impulse wave, but a corrective wave, which means that the LDT cannot be considered an impulse wave.
From Correction to Correction - Wave 2
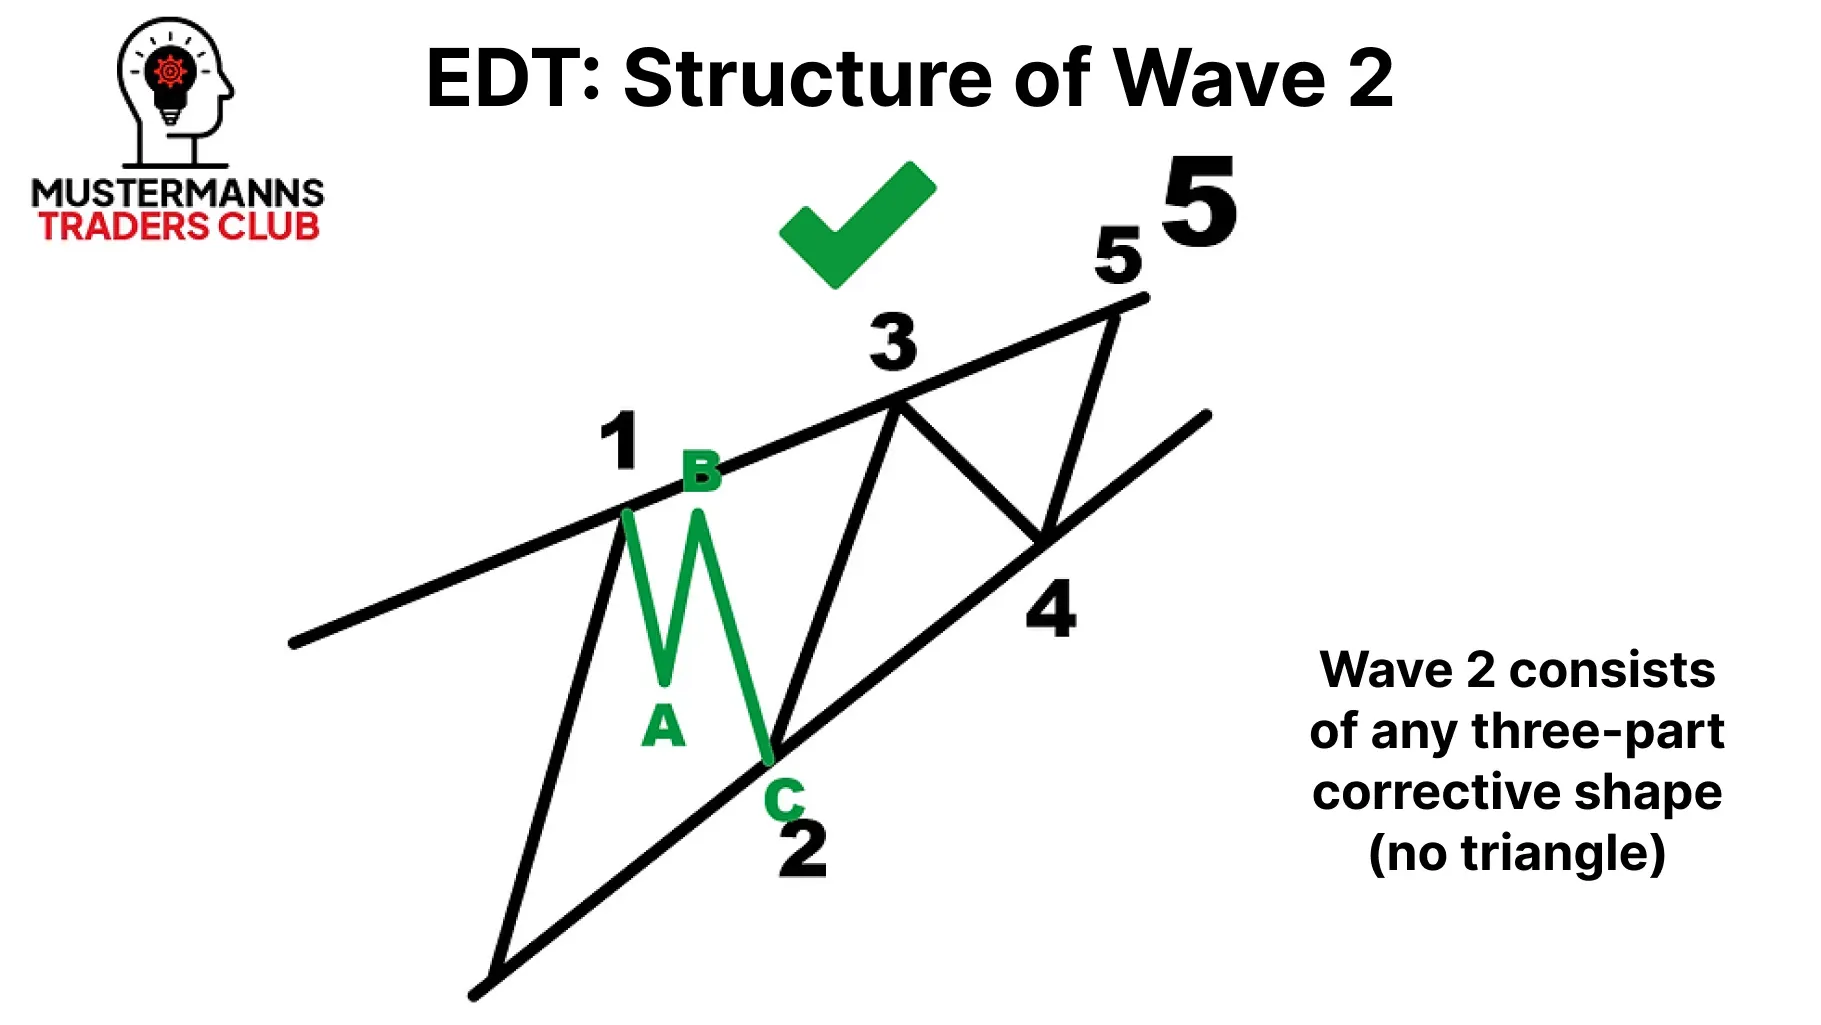
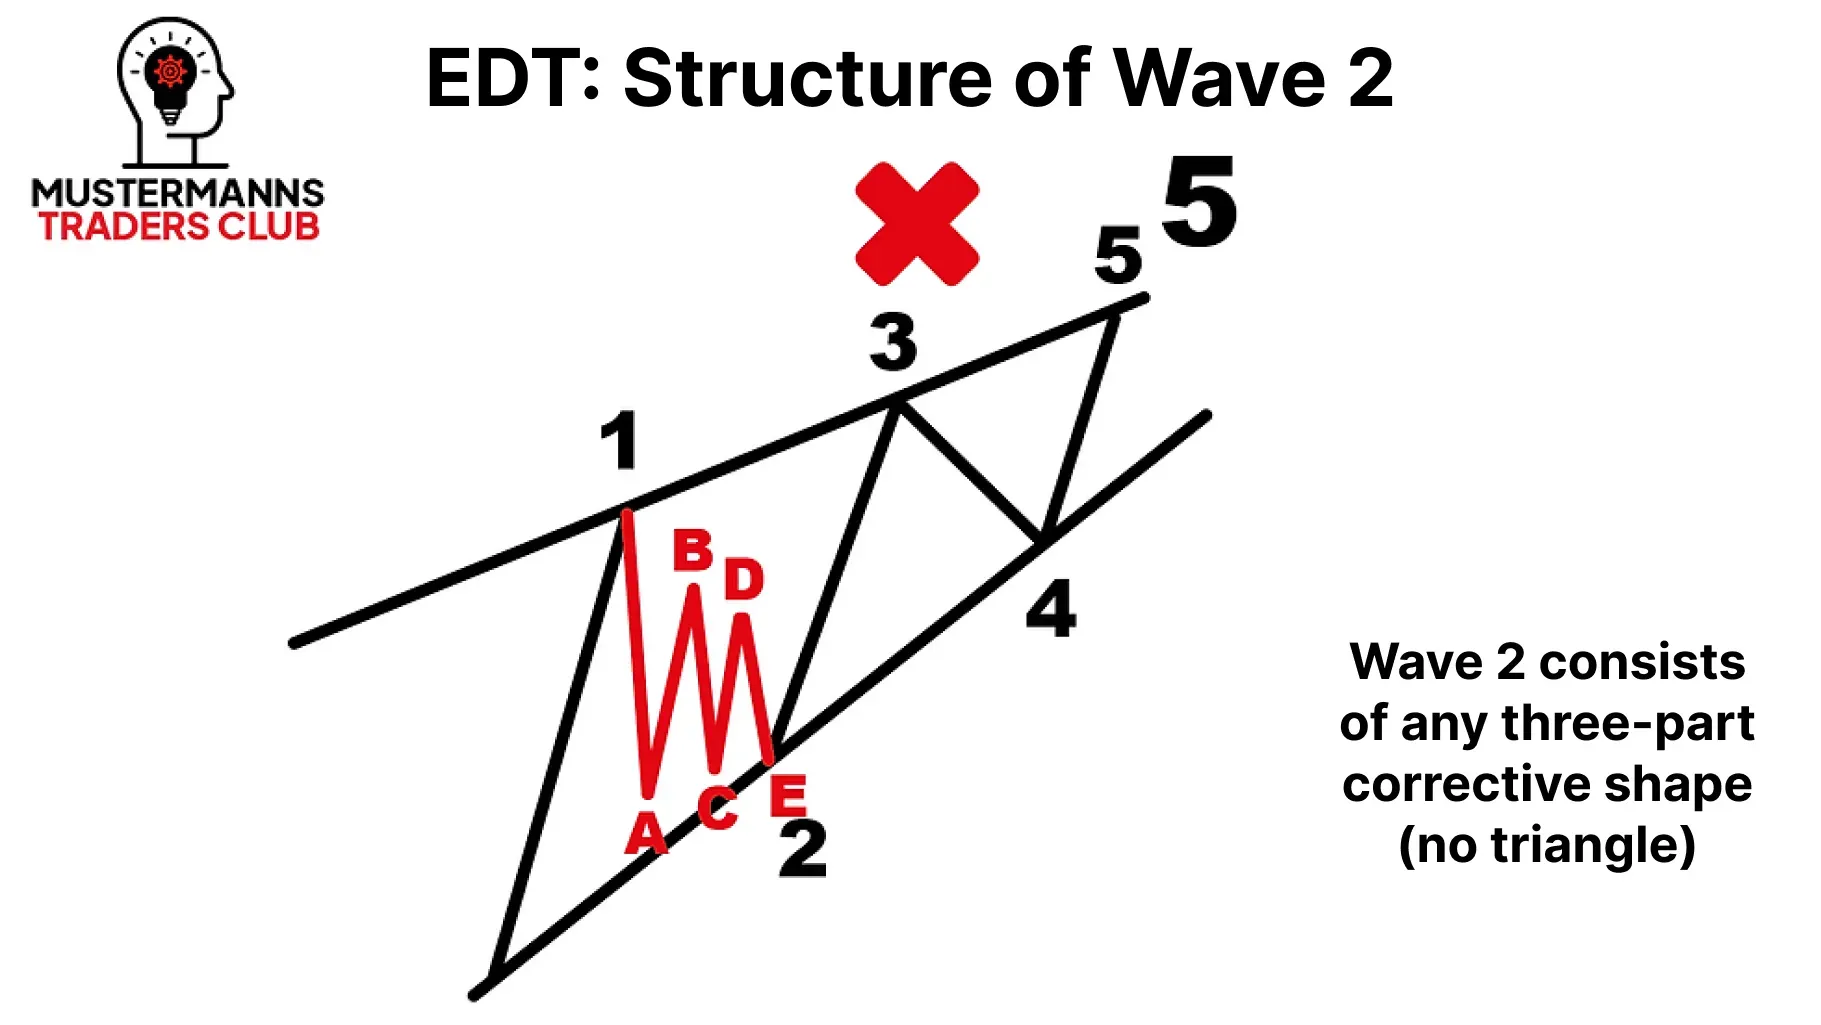
Wave 2 in the EDT will remind you of wave 2 in the impulse and LDT. Here too, all corrective waves are permitted. With the exception of triangles.
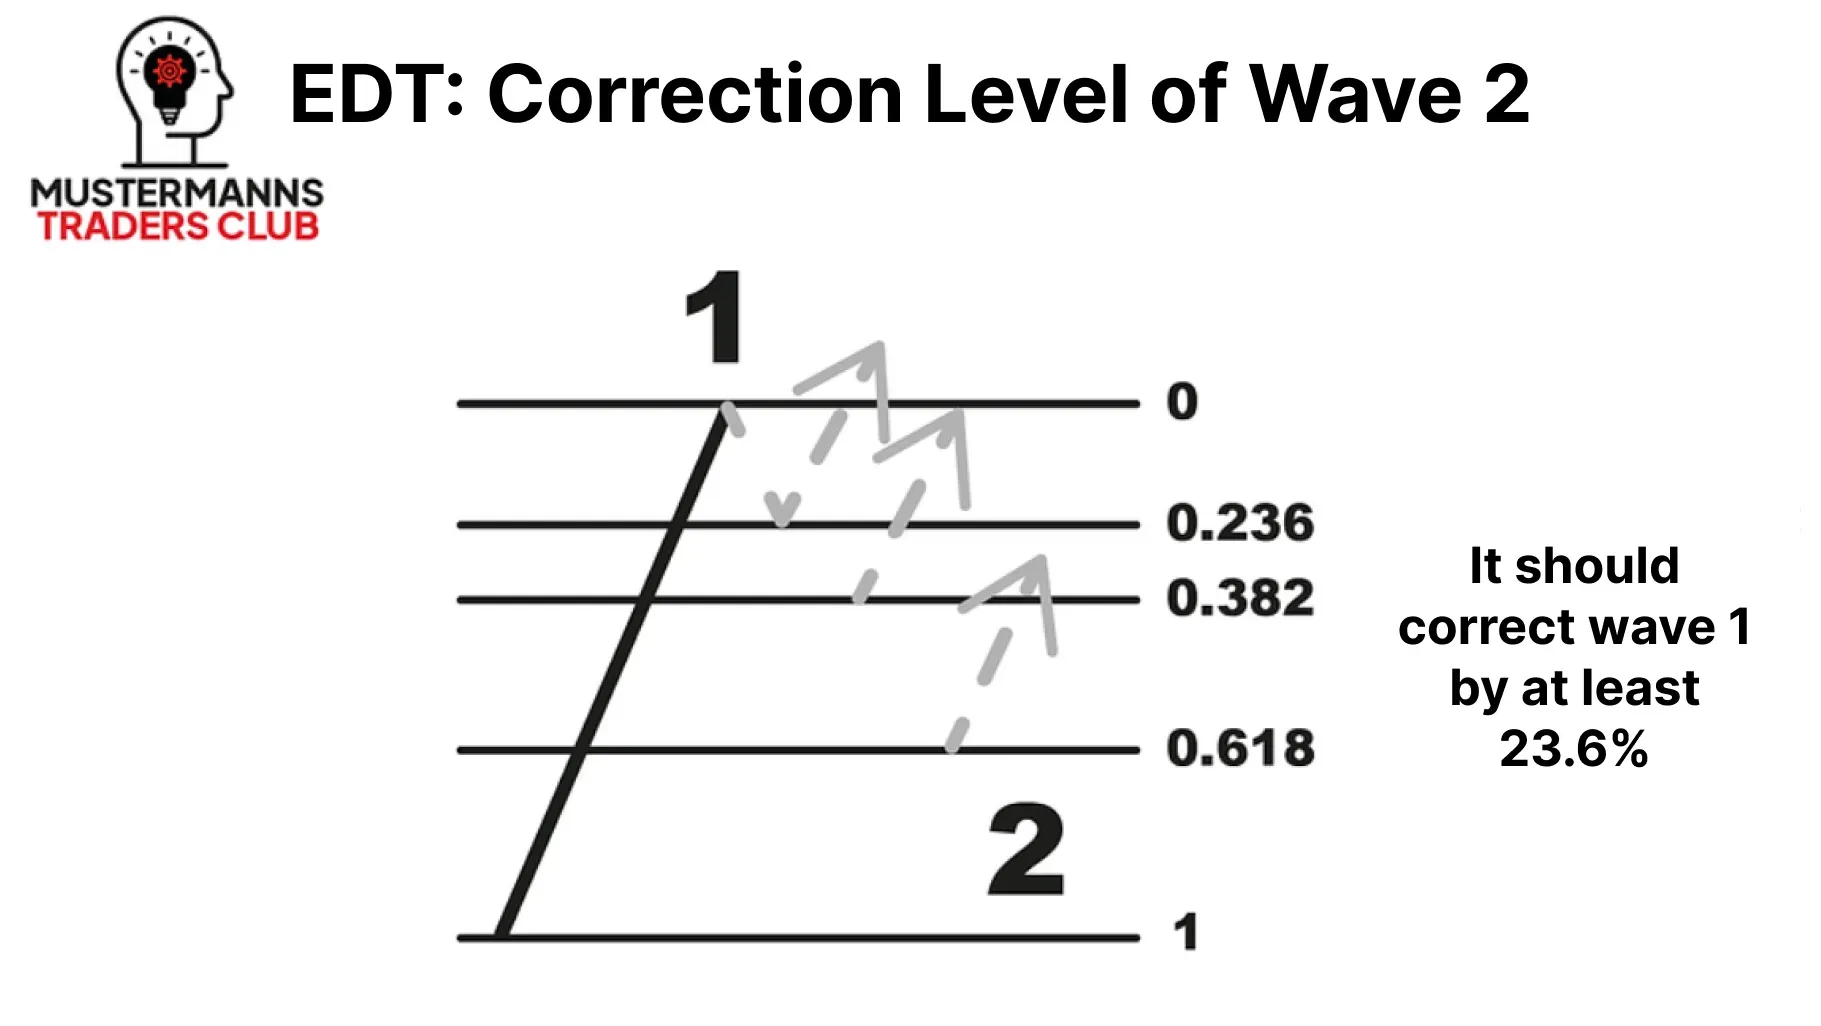
The EDT is no different: the correction in wave 2 should at least correct wave 1 by 23.6%. The subsequent Fibonacci levels represent potential reversal zones.
ZigZag on ZigZag - Wave 3
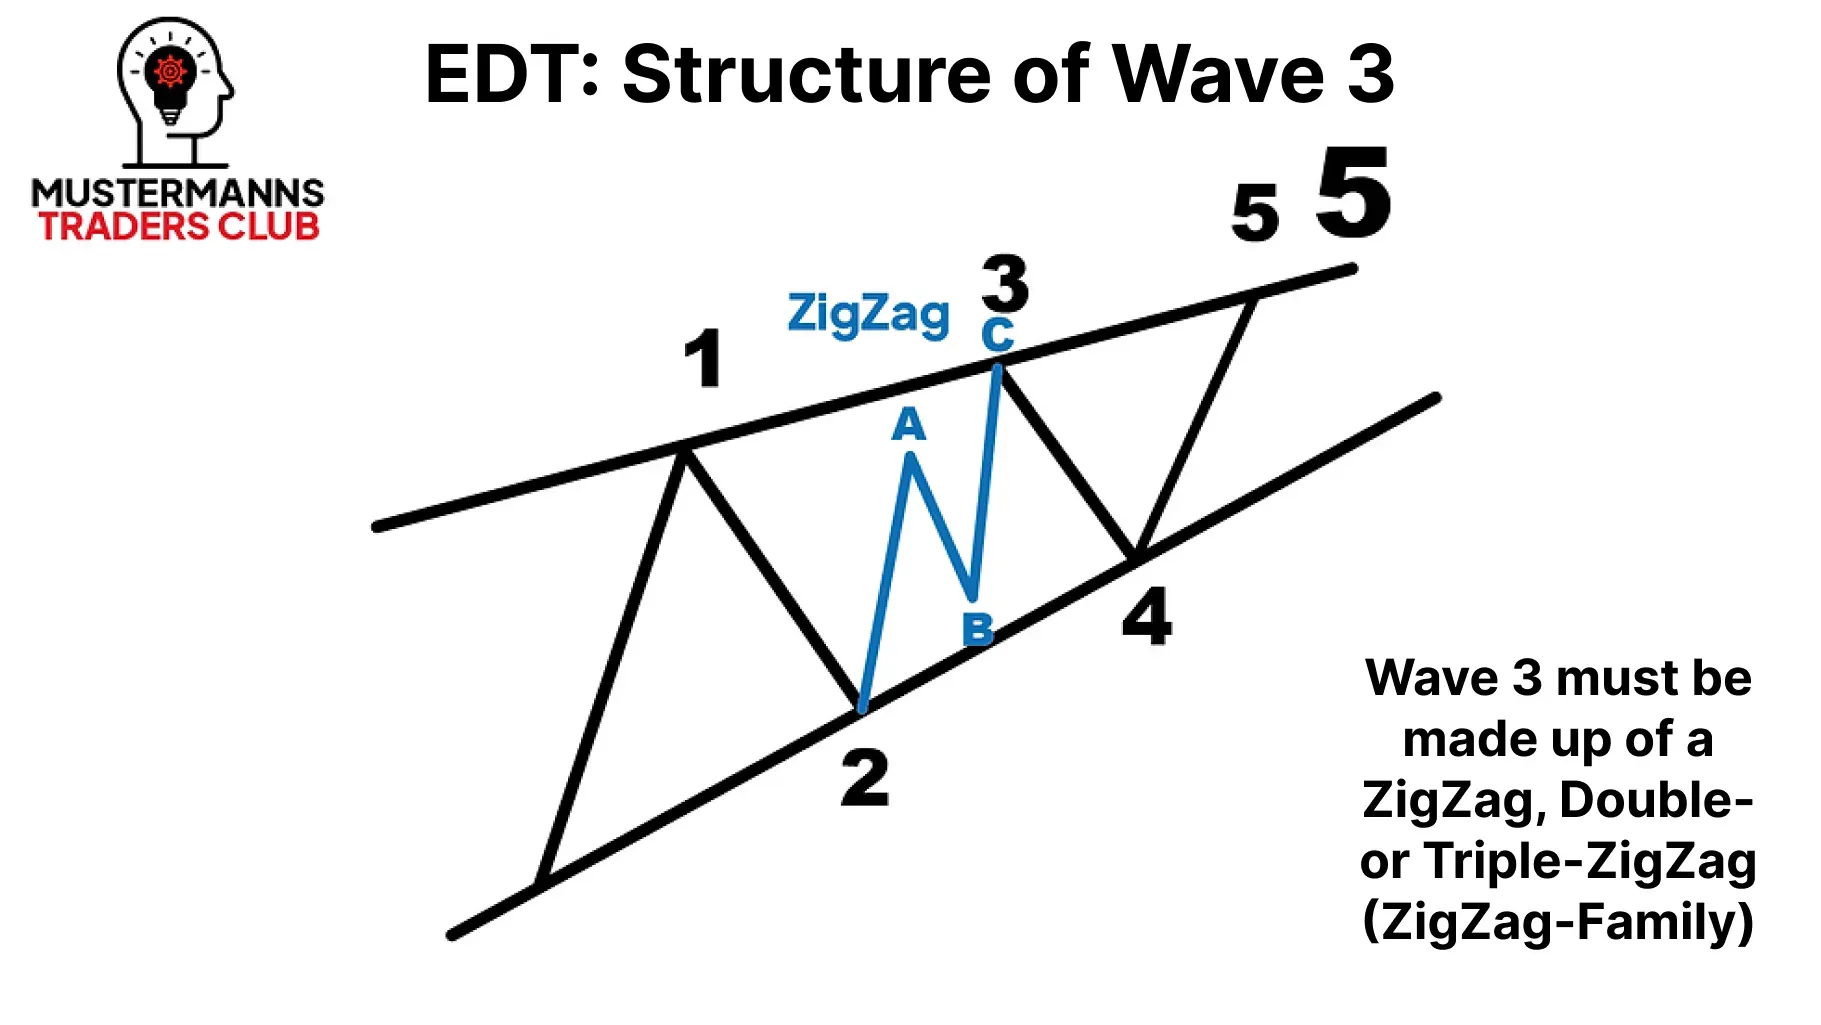
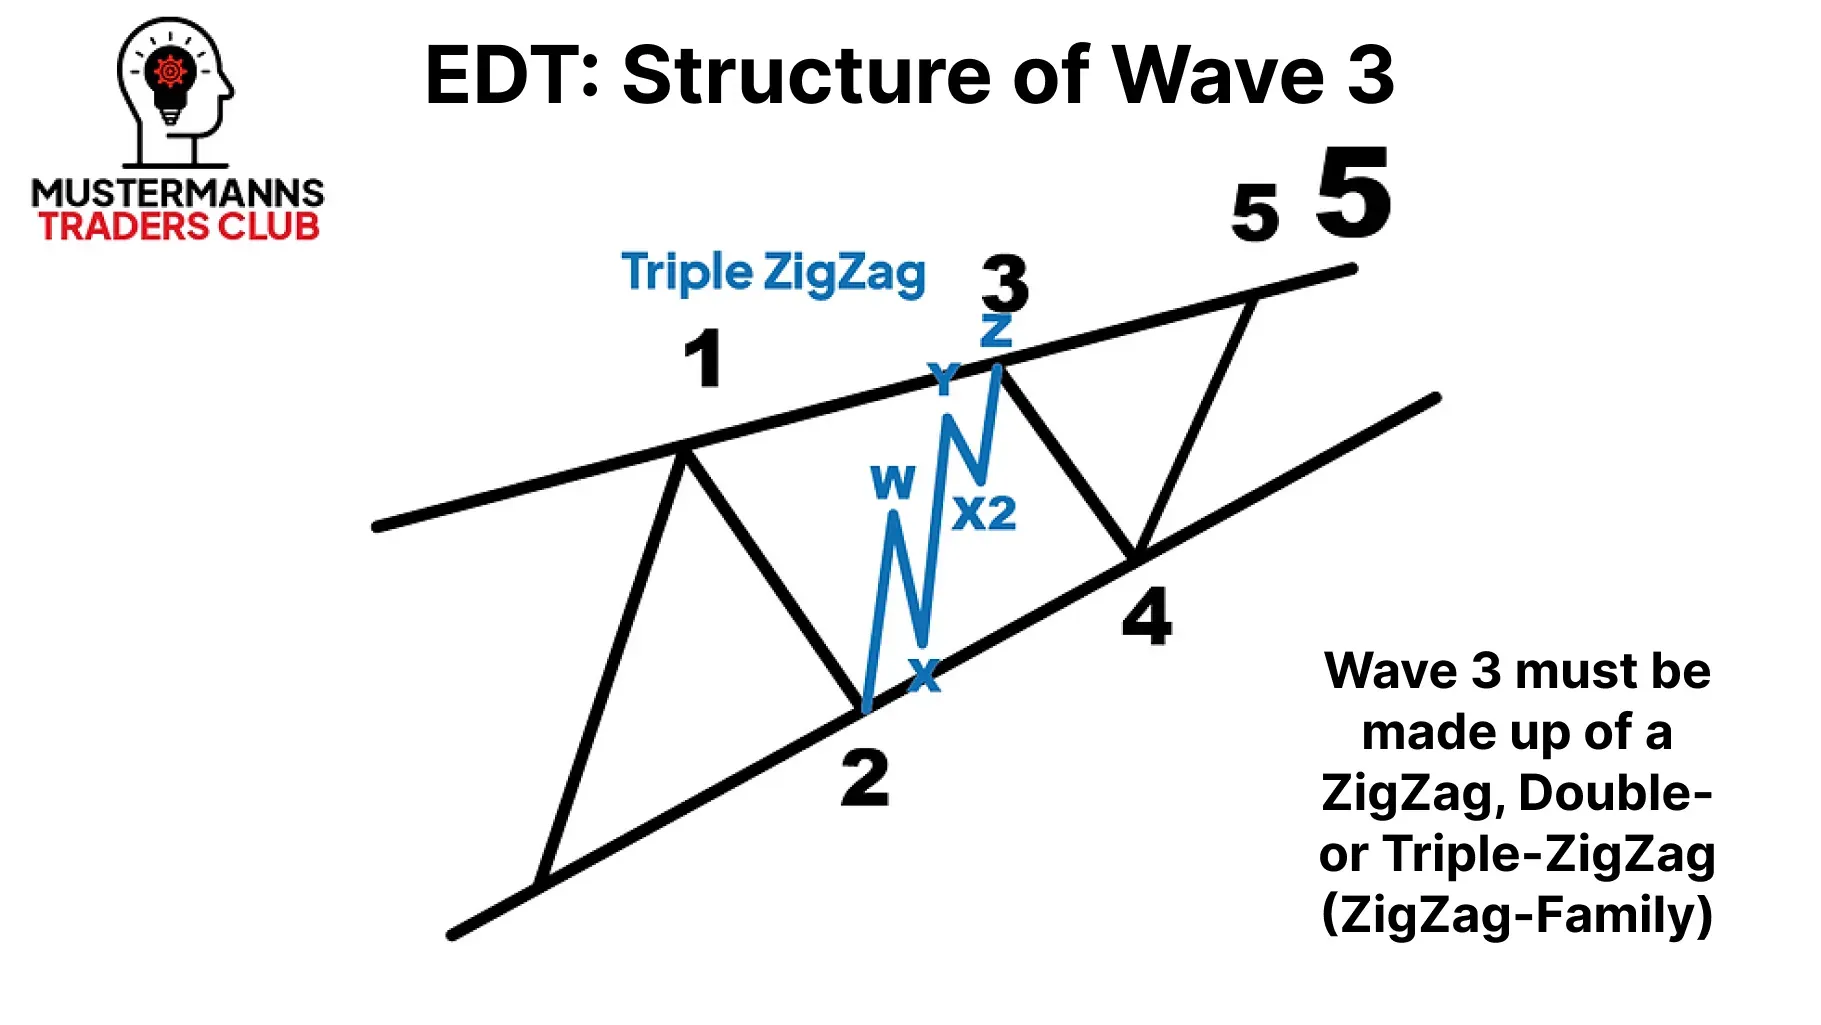
Wave 3 may also only consist of a ZigZag of the ZigZag family. Other corrective waves such as combos, flats or triangles are not permitted.
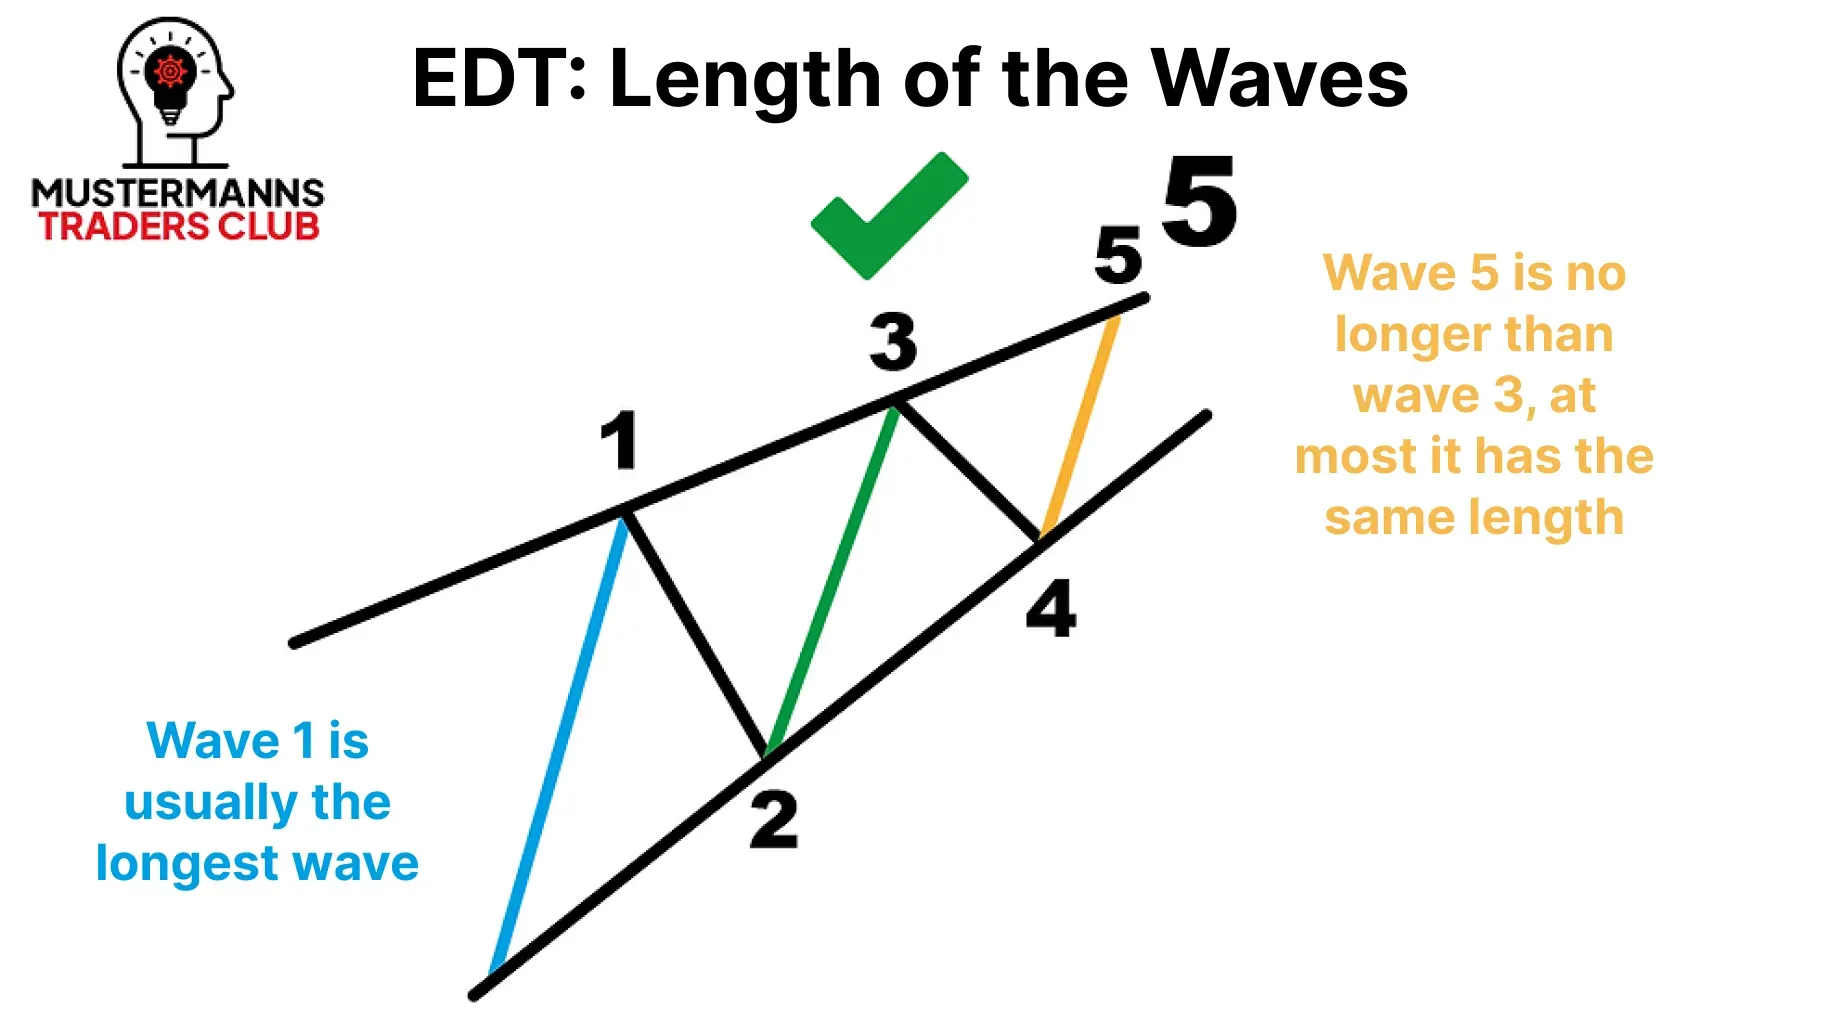
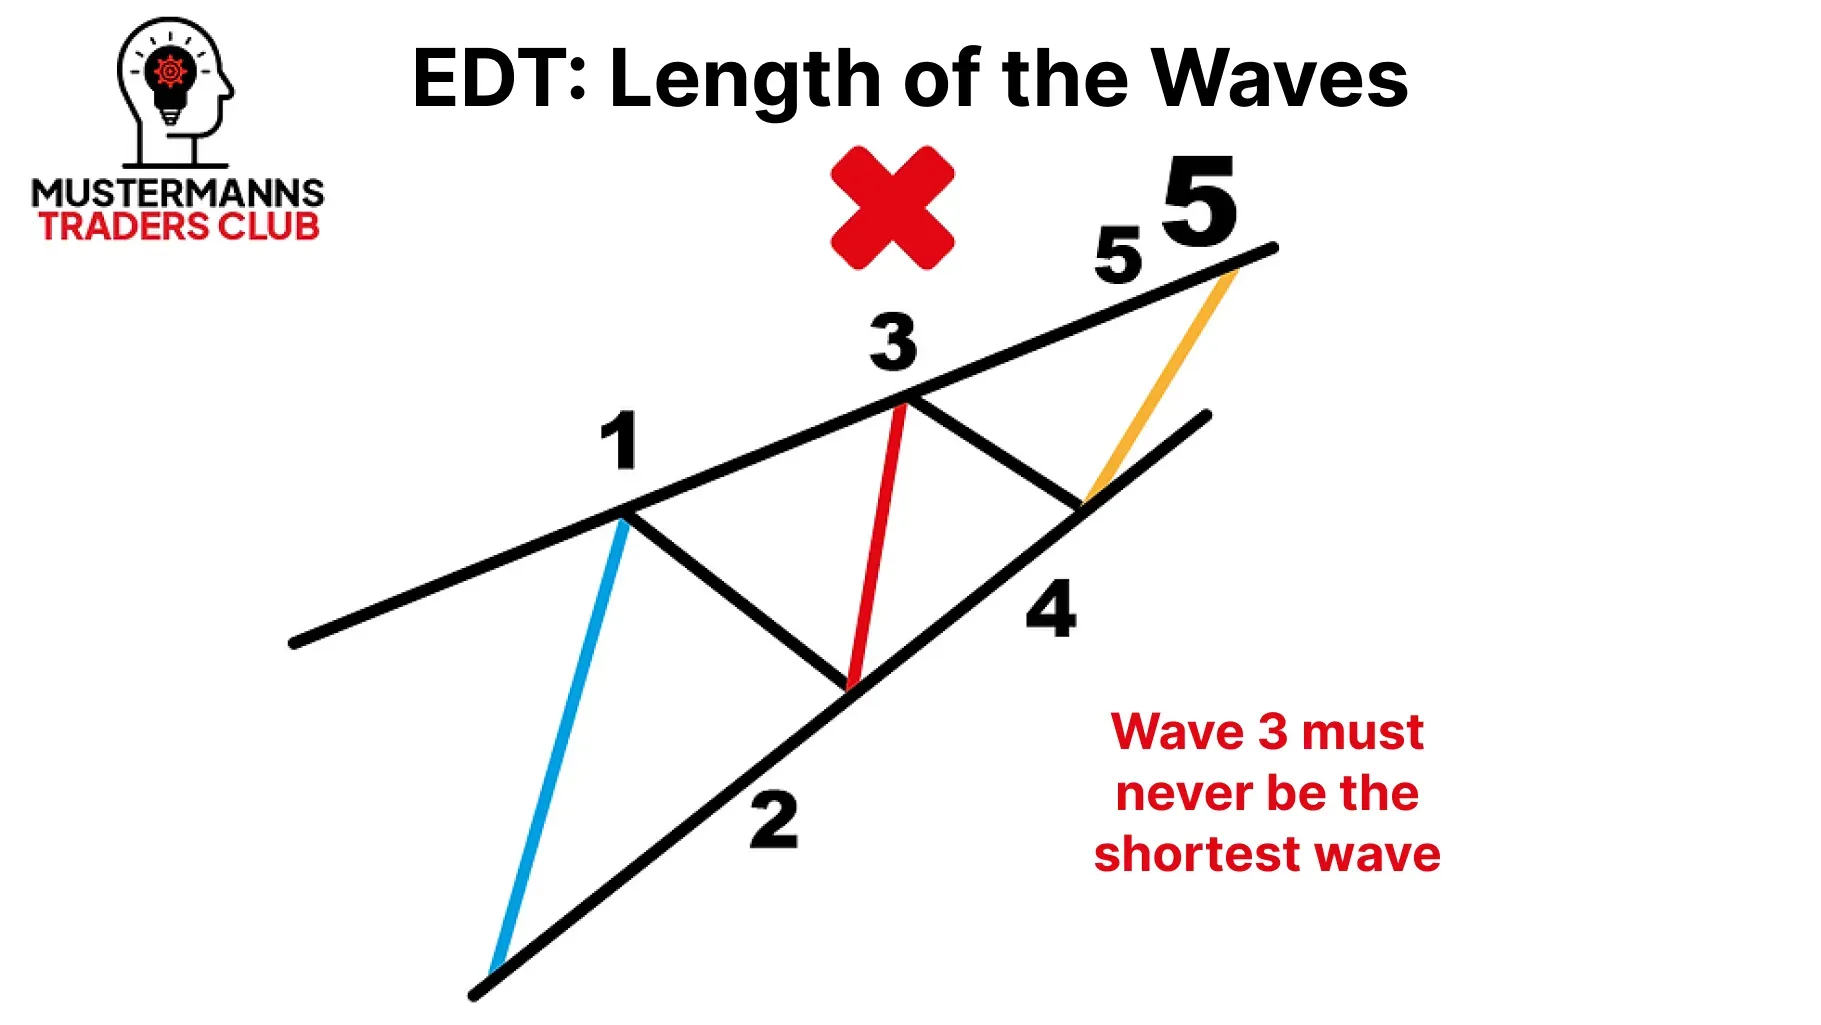
Due to the wedge shape, wave 3 is not the longest wave in most cases, even in an EDT.
If the third wave is shorter than the first wave, you can better define the last movement in the EDT. In this case, it must not be longer than wave 3, as wave 3 can never be the shortest wave.
The Trademark - Wave 4
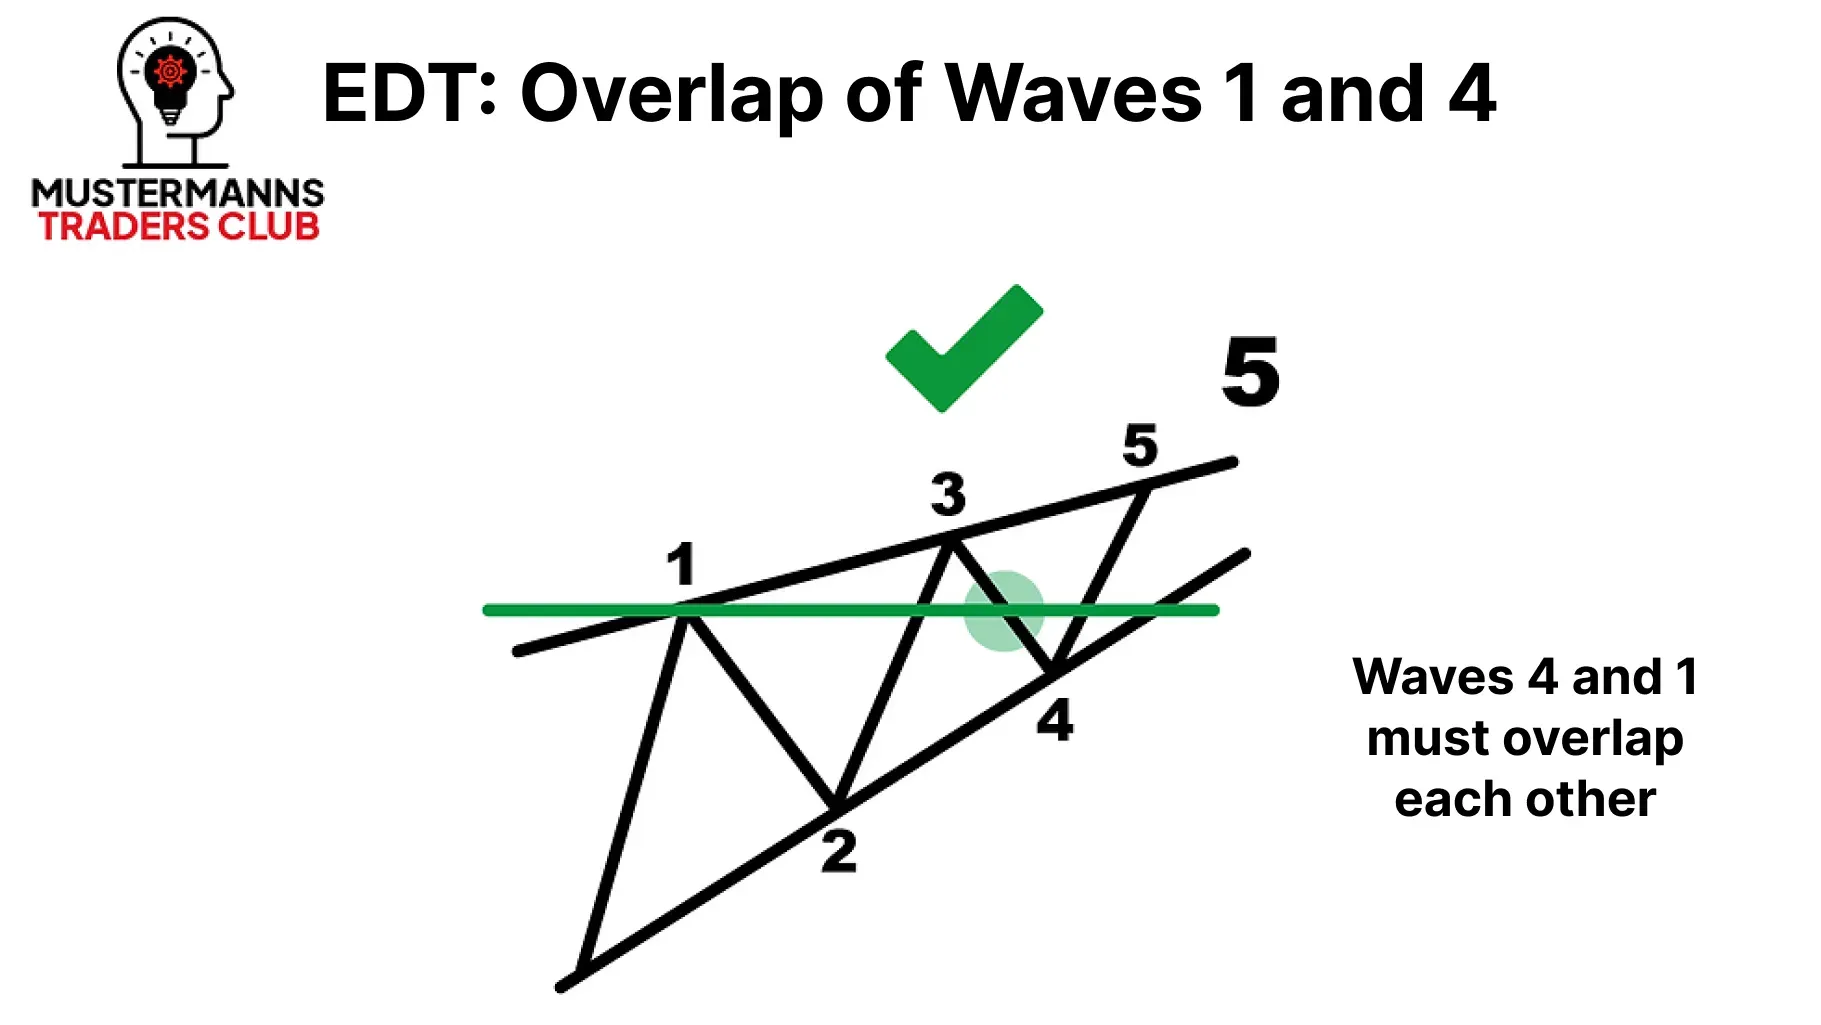
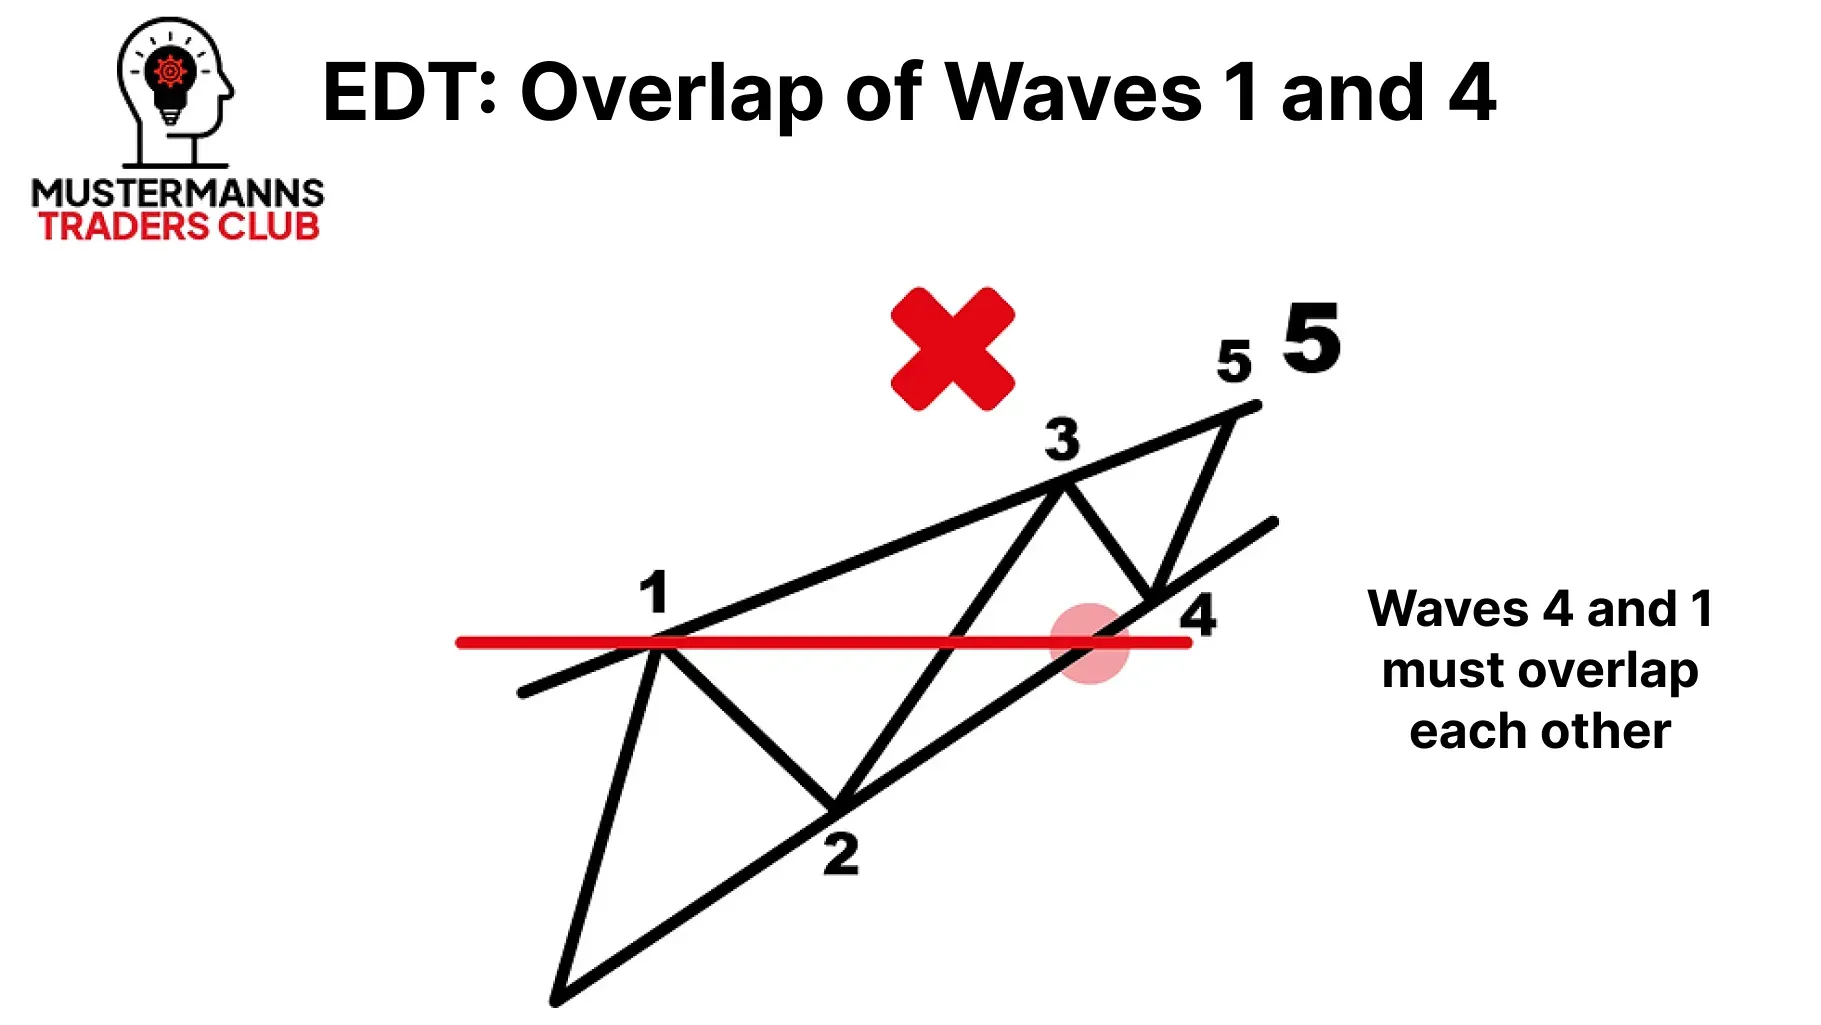
Wave 4 in the EDT corresponds to the same waves in the LDT. As a result, waves 1 and 4 must also overlap here in order to be considered an EDT.
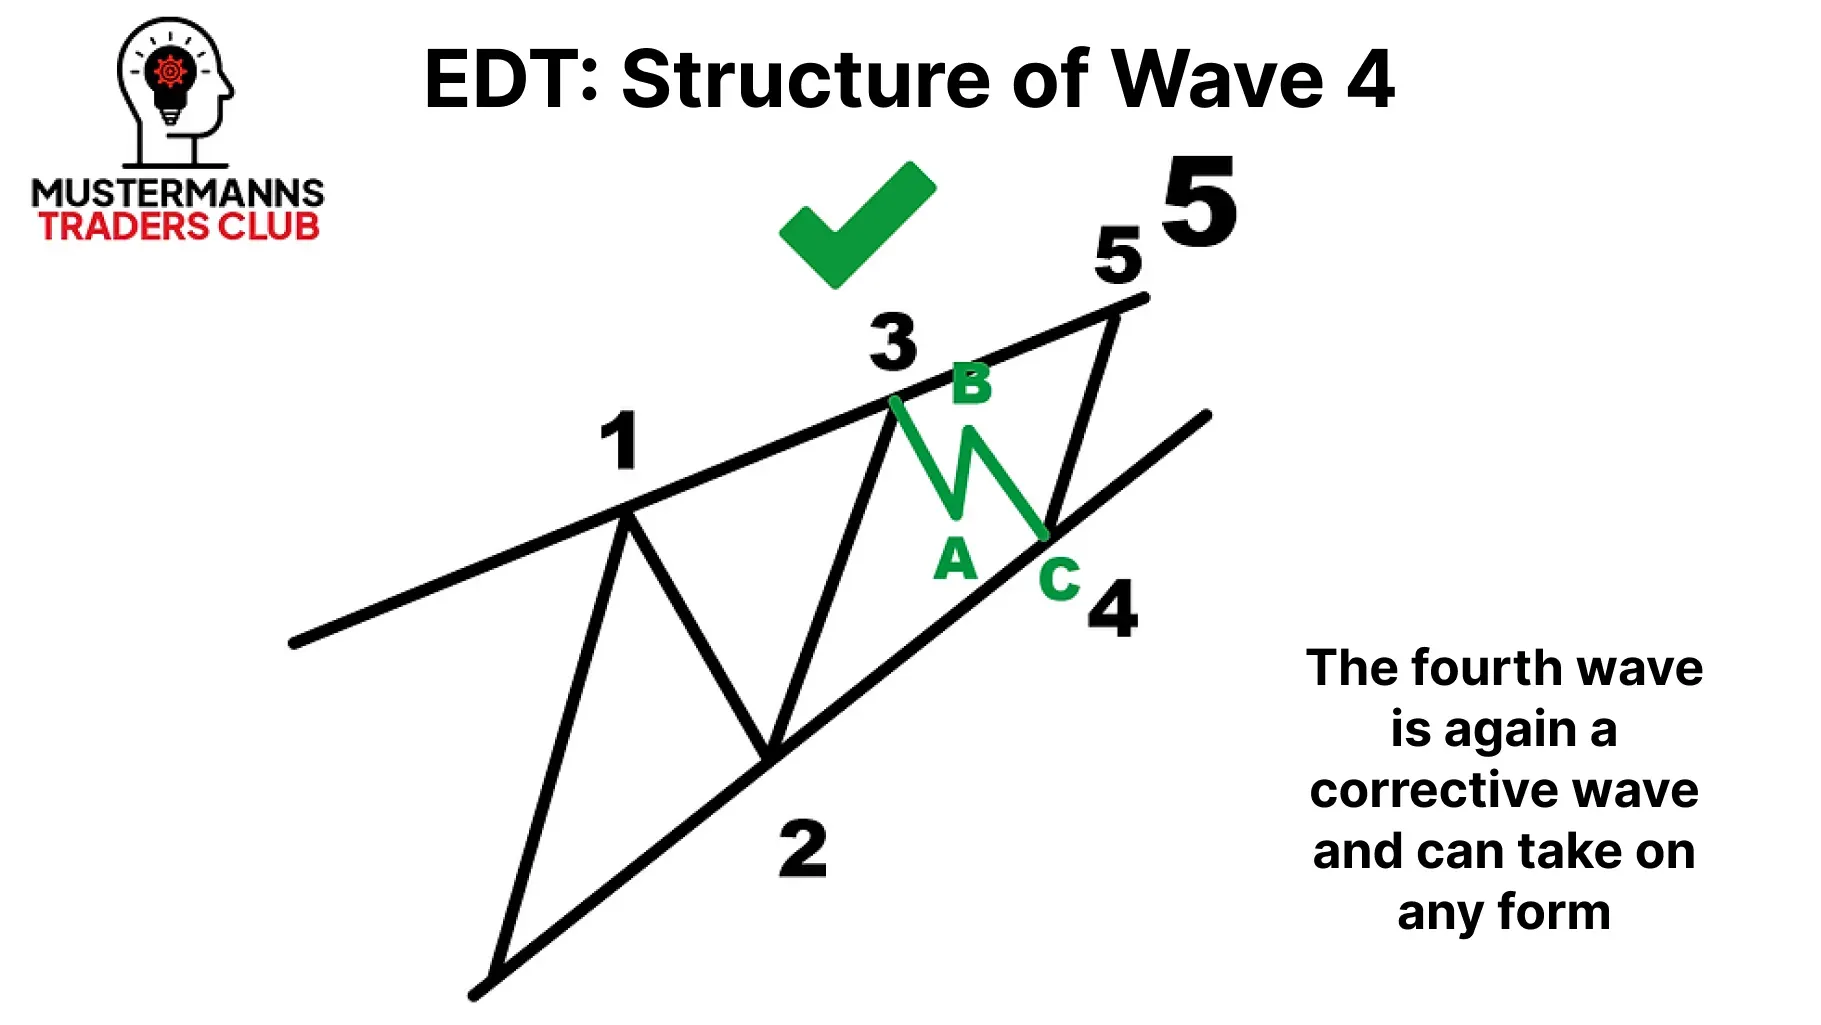
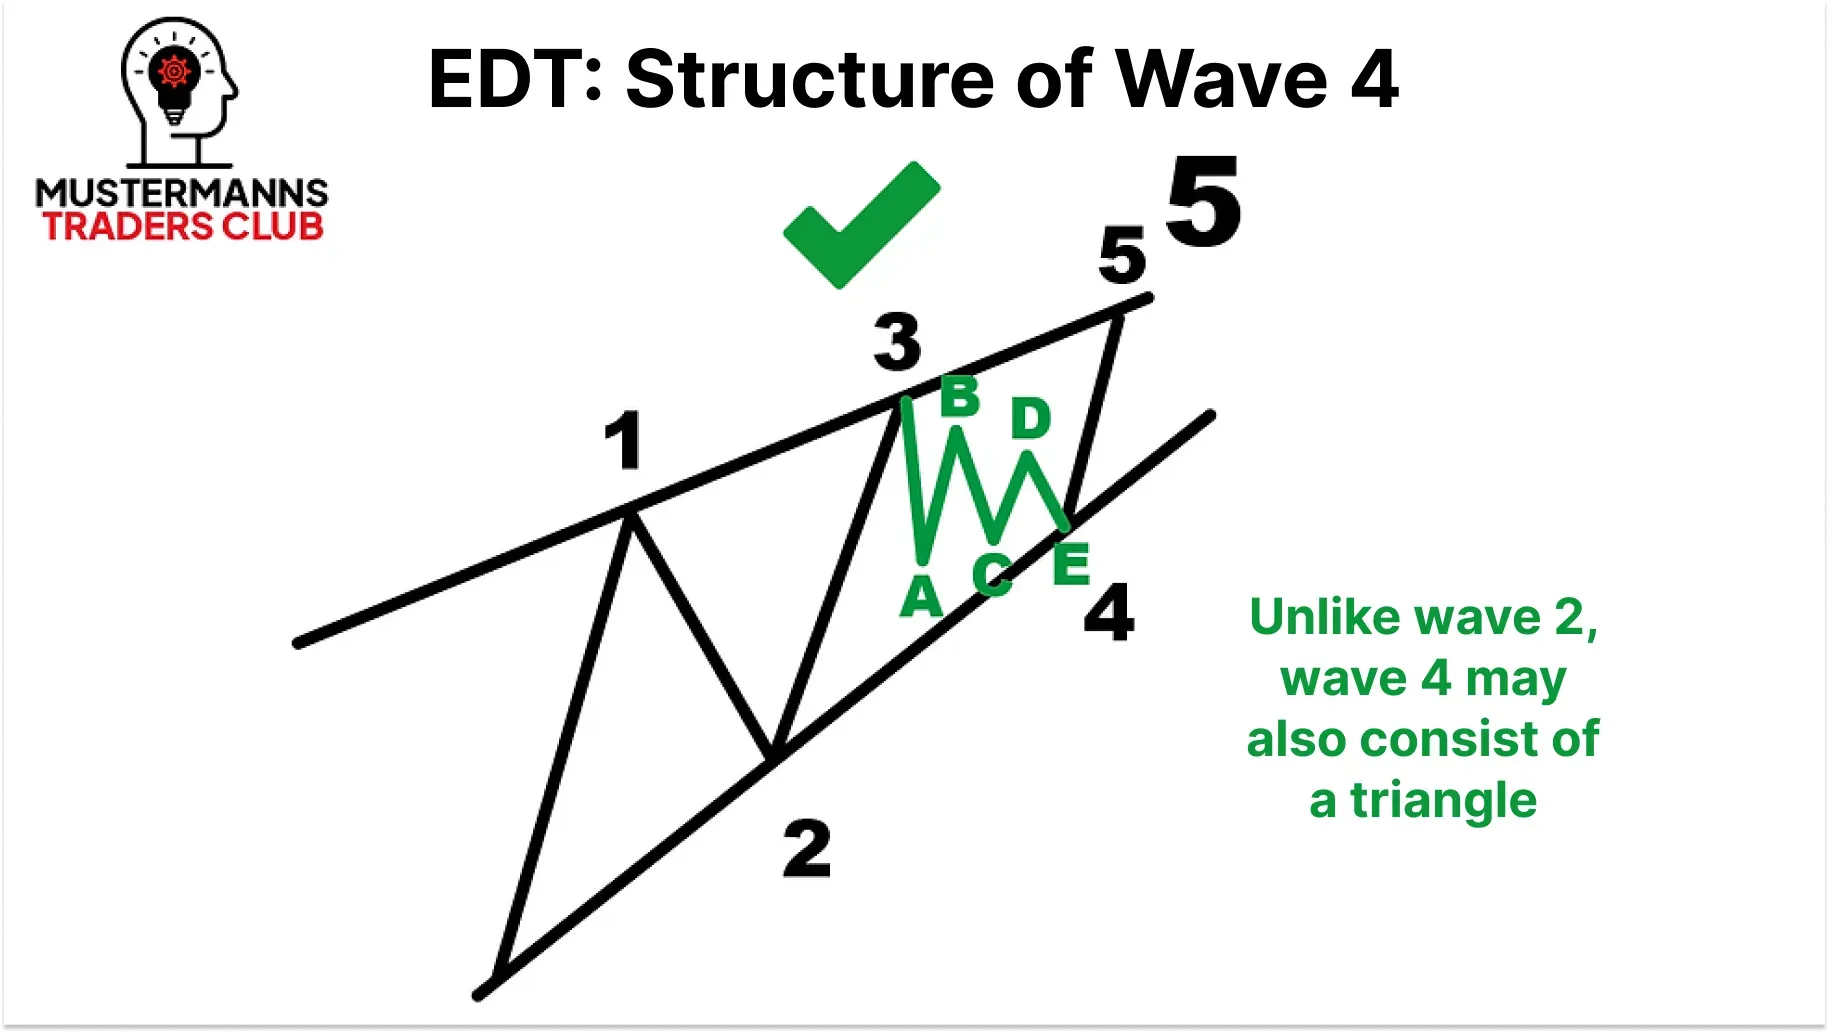
The only possibility that a triangle can be found in an EDT is in wave 4. As with the other impulse waves, all possible corrective waves can be found here.
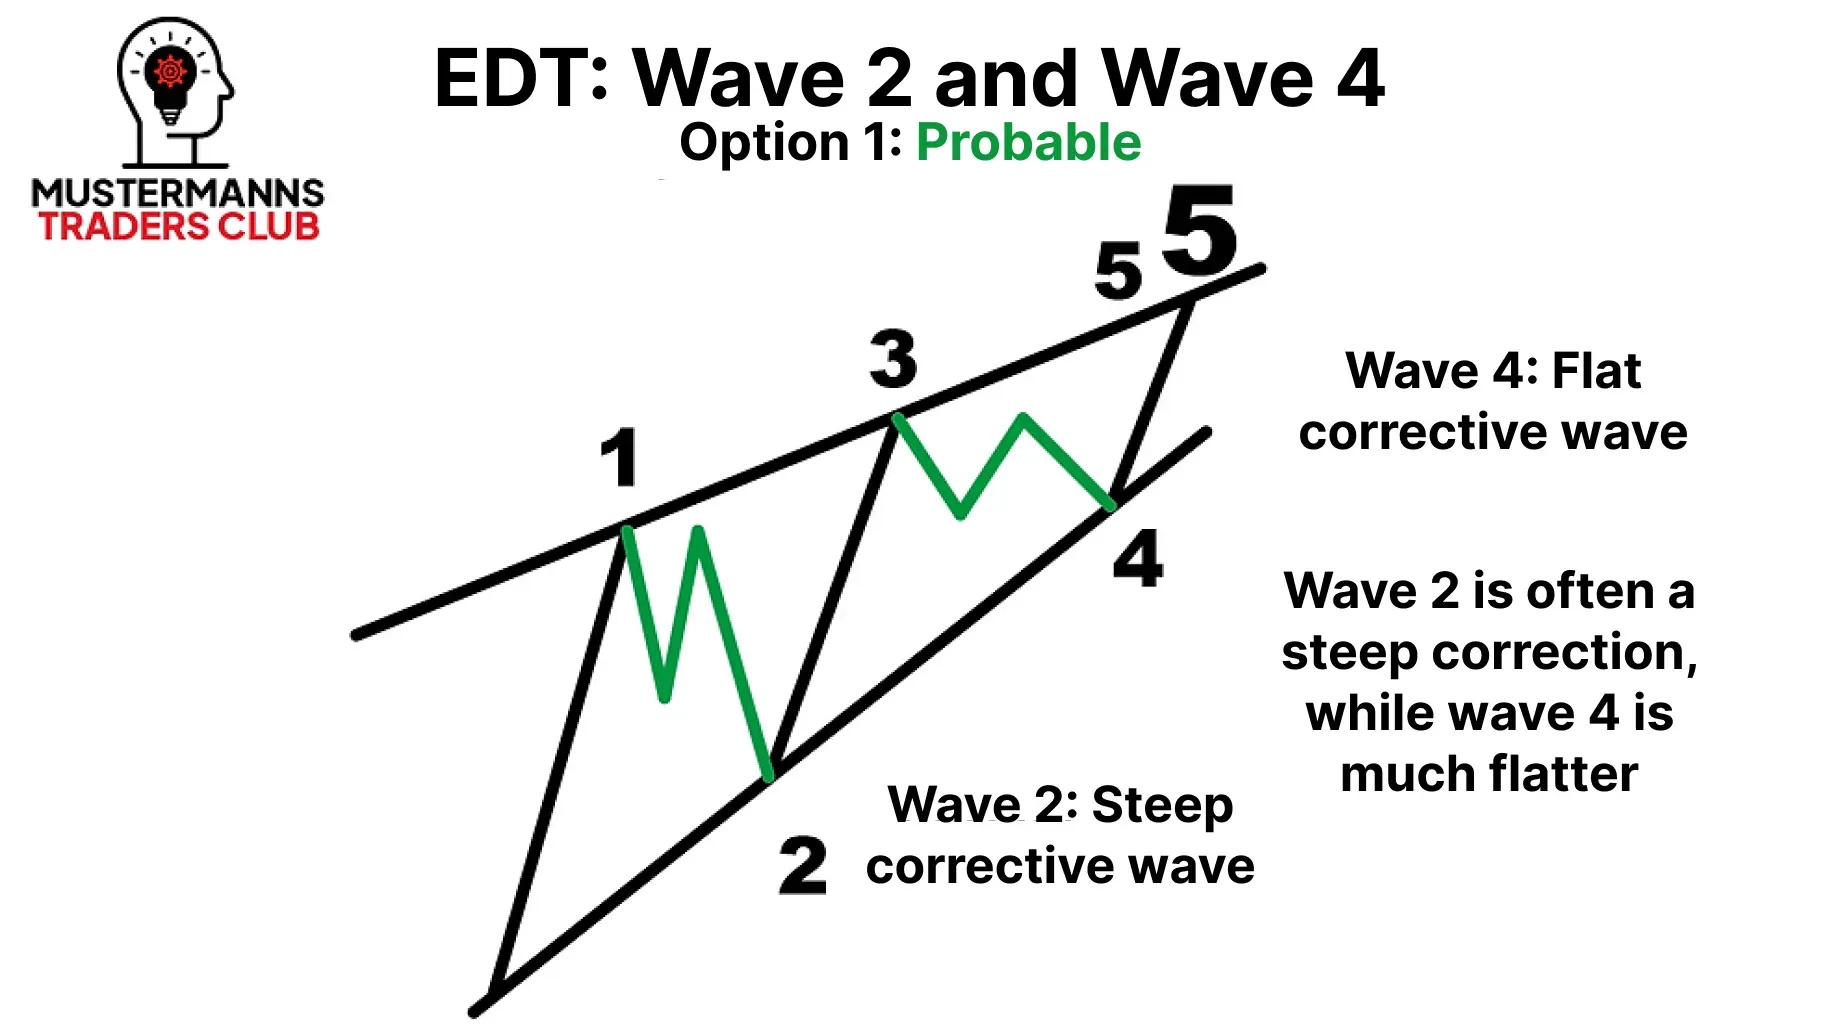
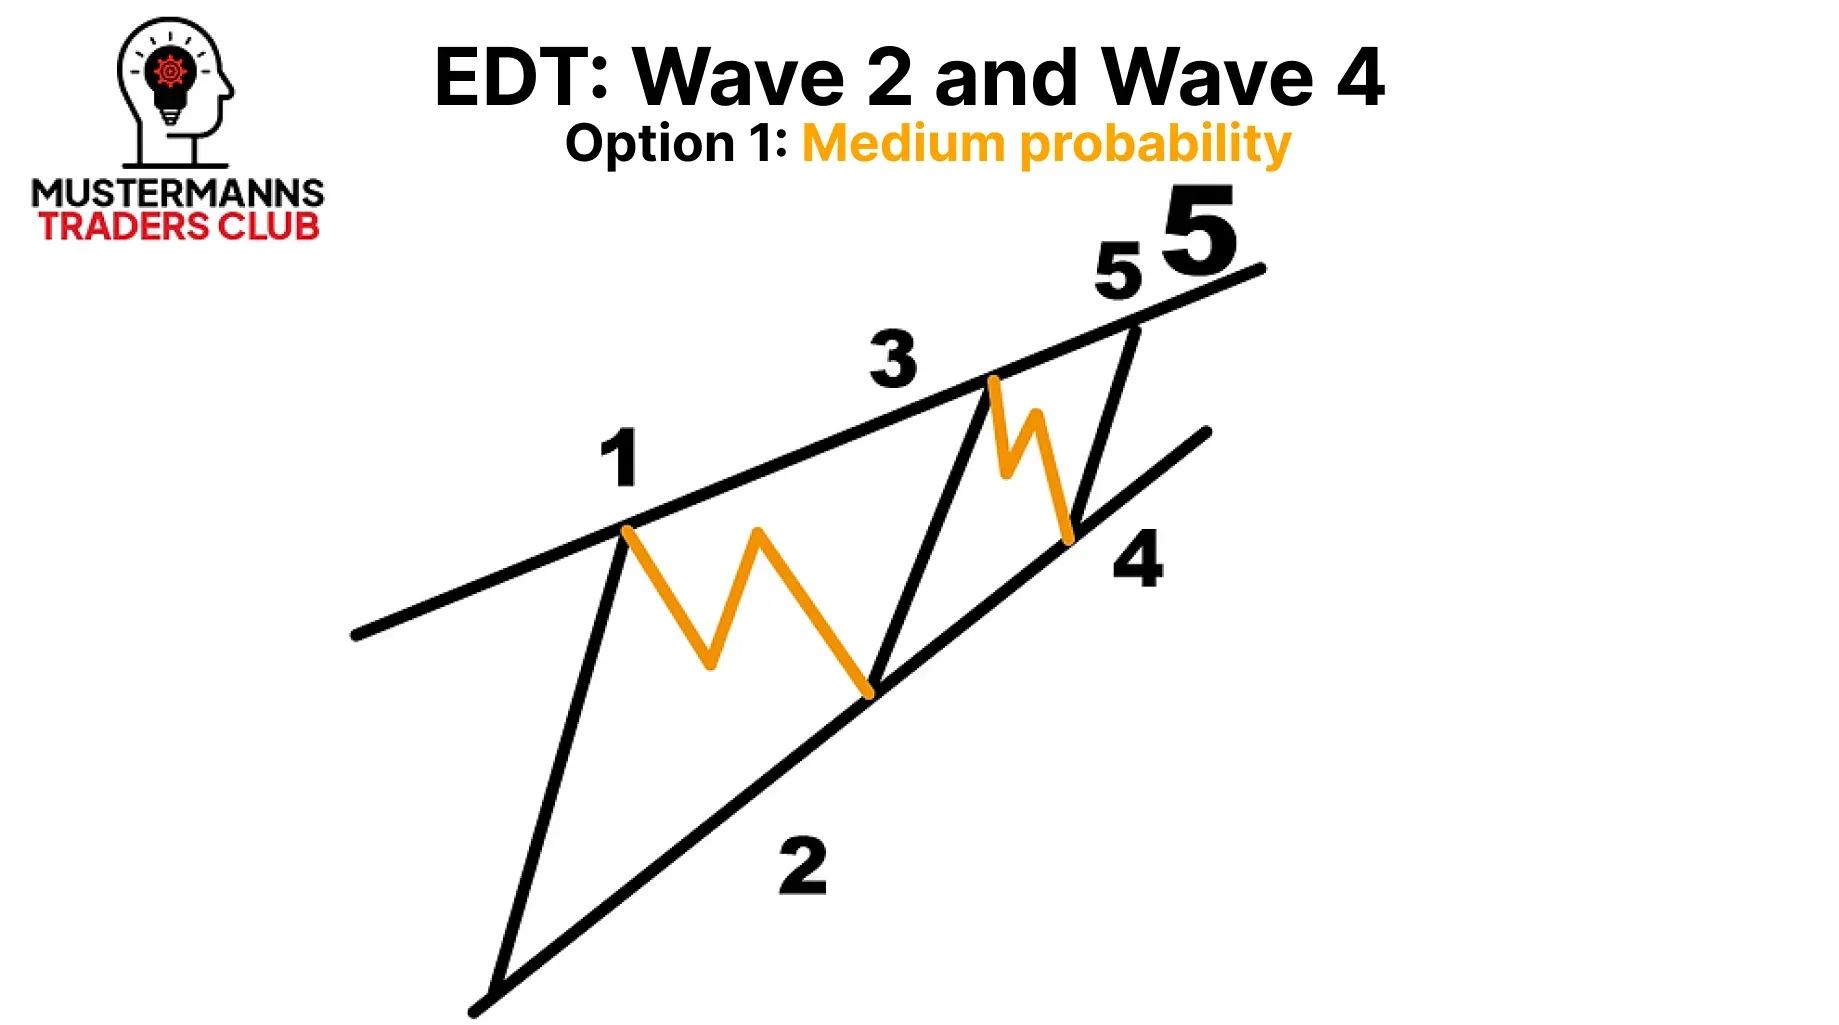
In an EDT, it is more likely that a steep correction will form in wave 2 and that the fourth wave will be flat. Although a flat wave 2 and a steep wave 4 is not a violation of the rules in an EDT, this occurrence can be observed less often.
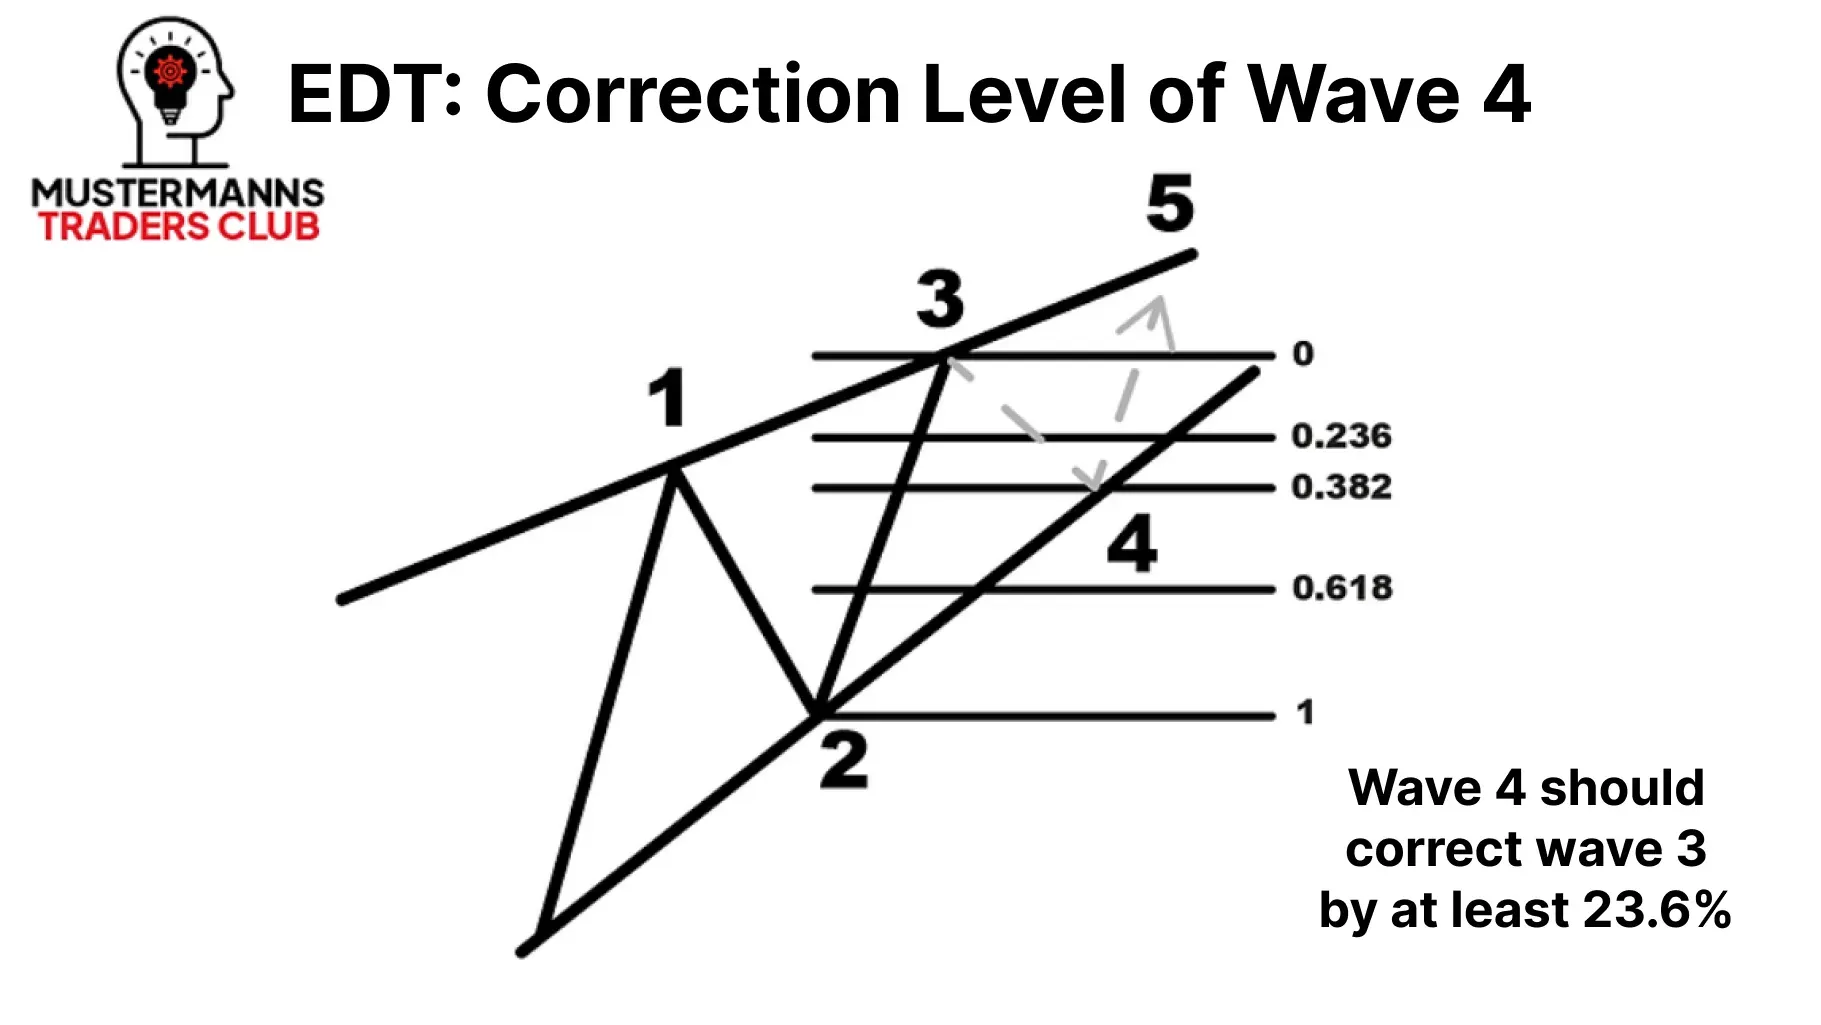
Wave 4 should correct wave 3 by at least 23.6%. The lower trend line, which you were able to draw with the help of the lows of waves 1 and 2, helps you to narrow down the possible reversal points from wave 4 into wave 5.
The End - Wave 5
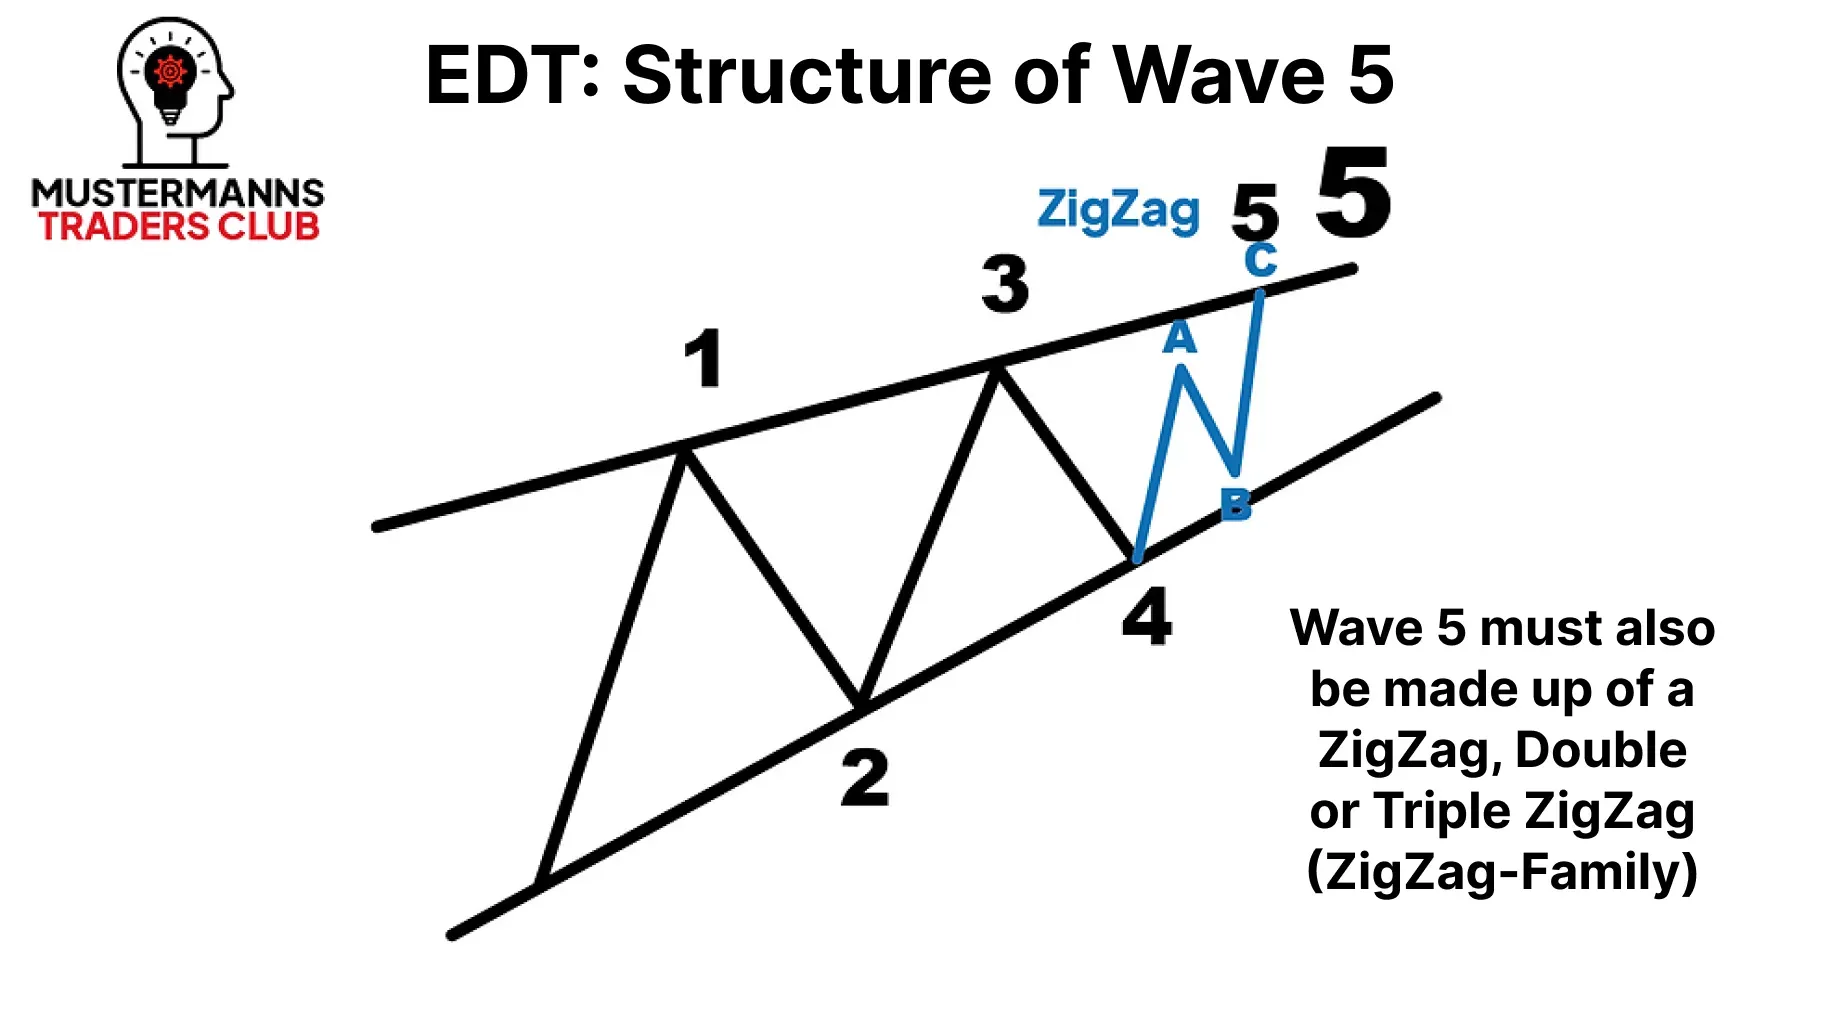
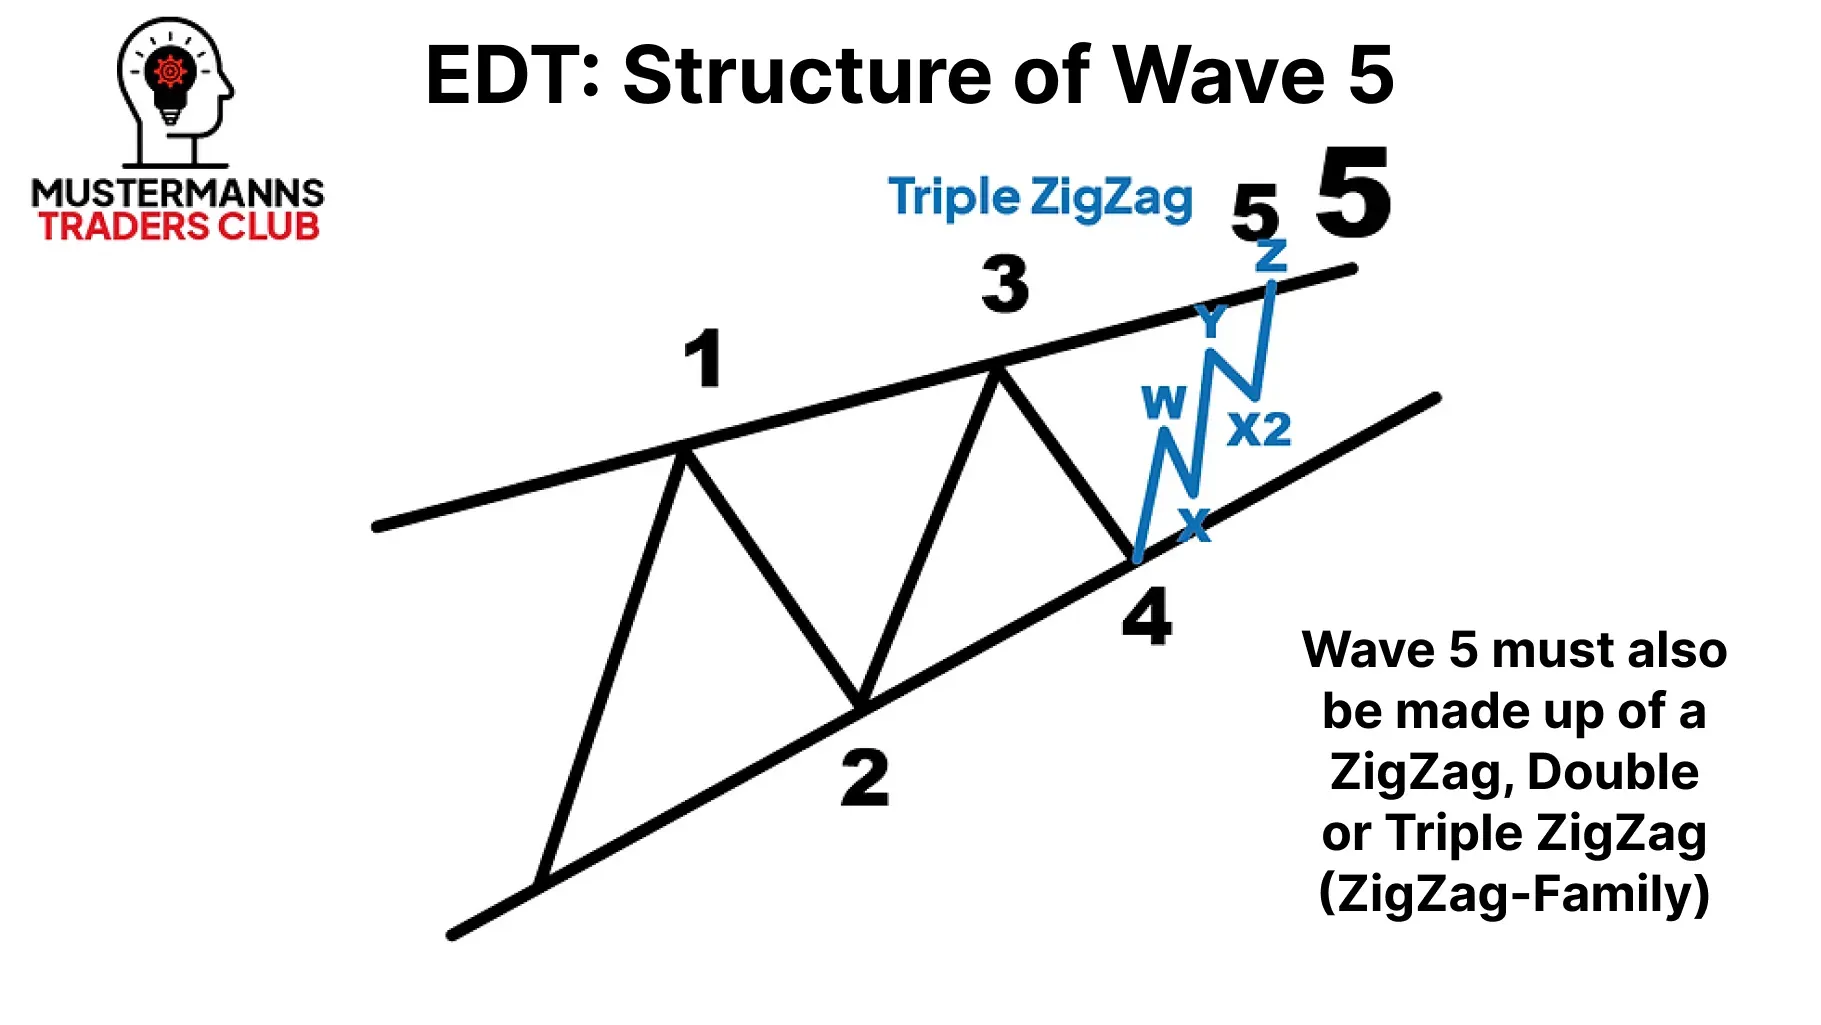
The last wave must also consist of a correction wave of the ZigZag family.
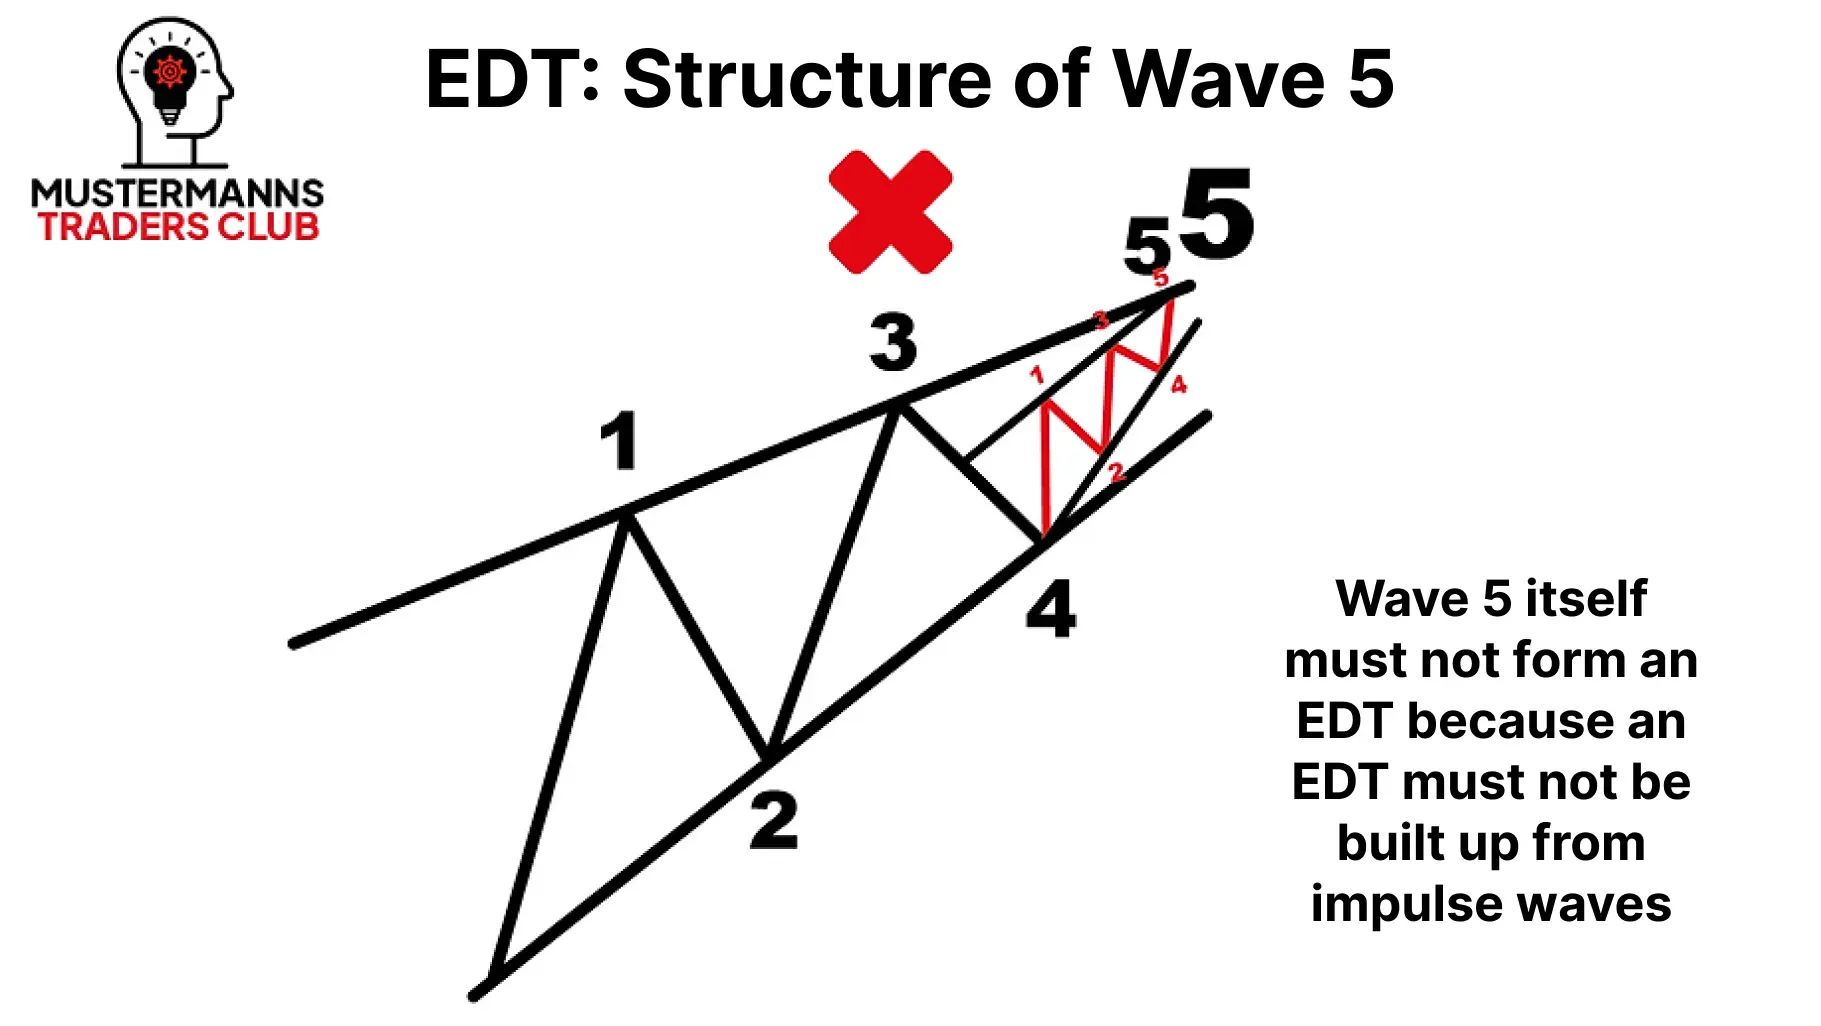
The EDT itself cannot consist of an EDT. Never forget that the EDT consists of corrective waves, which means that an EDT itself, as an impulse wave, is out of the question.


thank you buddie!
For EDT I could add, that wave 2 and 4 must not retrace wave 1 / wave 3 61.8% or even more.