MSCI China ETF

The MSCI China ETF (MCHI) is designed to track the performance of the MSCI China Index, which includes large and mid-cap companies across China’s diverse economy.
The ETF gives investors exposure to a broad range of sectors, with a significant focus on technology, finance, healthcare, and consumer discretionary industries. Some of the largest companies within this ETF include:
- Tencent Holdings
- Alibaba Group
- Meituan
- JD.com
This ETF provides a comprehensive way for investors to gain exposure to China’s economic growth and structural shifts, including the transition from manufacturing to technology and consumer-driven sectors.
Geopolitical and Economic Factors Affecting the MSCI China ETF
The performance of the MCHI ETF is closely tied to China’s economic outlook and its geopolitical environment. Several key factors play a role:
- US-China Relations: Ongoing trade tensions, especially around technology and tariffs, can significantly impact the companies included in the MSCI China ETF. Any changes in policy, such as tariffs or restrictions on Chinese technology, can lead to market volatility.
- Domestic Economic Policies: China's government continues to intervene in certain sectors, including technology and real estate. Regulations or economic stimuli can directly influence the ETF's performance, making it essential for investors to monitor domestic policy changes.
- Global Economic Environment: With China being a critical player in global supply chains, any disruptions, such as those caused by the COVID-19 pandemic or the global energy crisis, have a ripple effect on Chinese companies and, by extension, on the MSCI China ETF.
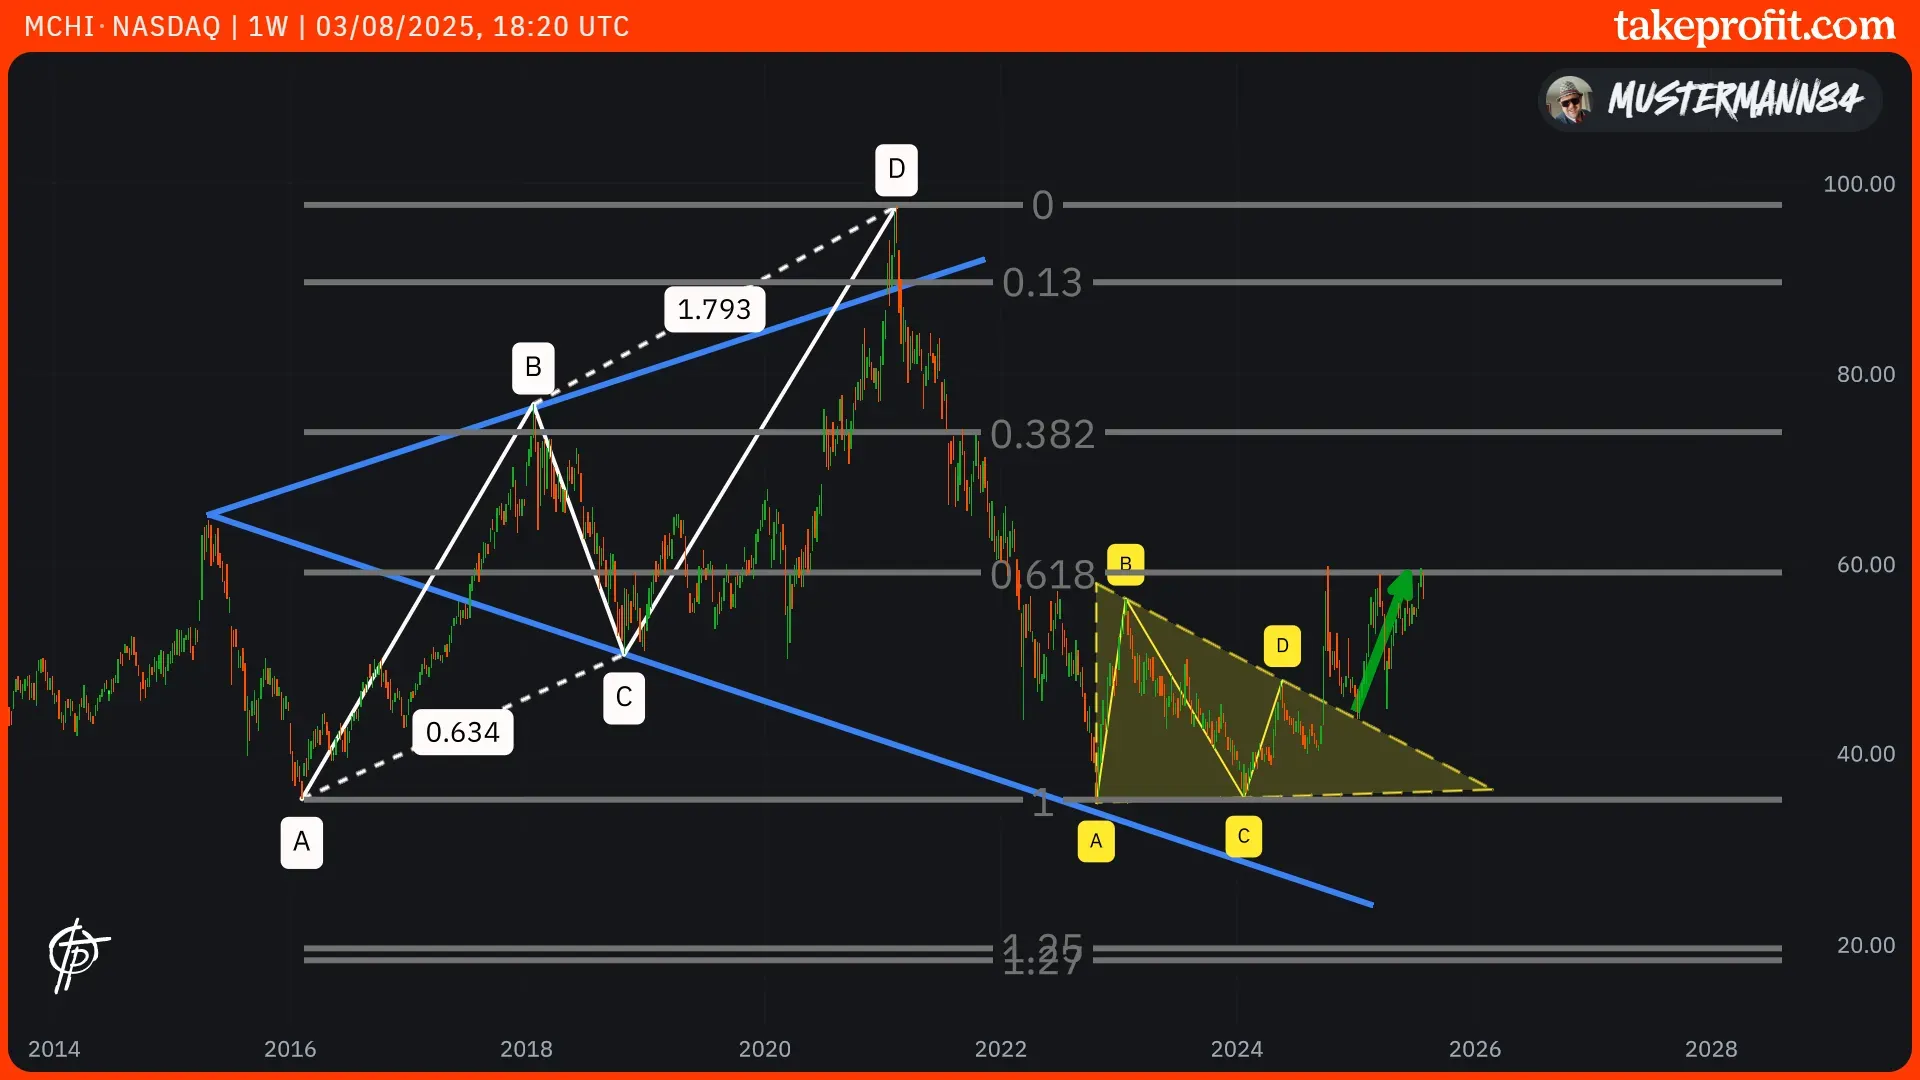
Technical Chart Analysis – Key Patterns and Potential Movements

As shown in the provided chart, the MSCI China ETF (MCHI) has formed several technical patterns that suggest possible future price movements. One key pattern identified is the harmonic ABCD pattern, with significant support and resistance levels aligned with Fibonacci retracements.
- Support and Resistance Levels: The ETF appears to be testing a significant long-term support level (marked in red), which could serve as a critical point for a potential reversal or breakdown.
- Fibonacci Levels: The chart highlights key Fibonacci retracement levels, such as the 0.382, 0.618, and 1 levels. A break above the 0.618 level could lead to a potential rally towards higher Fibonacci targets, suggesting price movement back to around the $60 or even $80 mark.
Possible Scenarios
- Bullish Scenario: If the ETF respects the current support level and bounces off, we could see a move upwards toward the 0.618 Fibonacci level, targeting $60 as a key resistance point. A further rally could push prices toward the $80 to $90 range, where the upper Fibonacci extensions lie.
- Bearish Scenario: Should the ETF break below the current support level, it could trigger a deeper correction, possibly pushing the price down towards the $20 range, as indicated by the next lower Fibonacci extensions.
- RSI Divergence: The RSI (Relative Strength Index) shows a divergence, which may indicate weakening momentum in the downtrend. If confirmed, this could support a potential bullish reversal.