Harmonic Pattern- ABCD Education [English]

Hello, Tradebuddies I would like to show you how to work with the classic ABCD in this article.
Basically, the ABCD pattern is the basis of the harmonic pattern and is referred to as a Fibonacci trading strategy. Such a pattern arises from price movements and corrections and places these in a Fibonacci relationship with each other. If certain ratios arise, different patterns can emerge. There are variants in the patterns, which are represented by bandwidths in the figures. In simple terms, these are dynamic patterns consisting of at least 4 or more pattern points.
Basically, there are the following harmonic patterns:
- ABCD Pattern
- X-ABCD Pattern
- Cypher Pattern
- 3- Drive Pattern
What do the numbers in the ABCD tool tell us?
An ABCD pattern has numerical bandwidths that state that the A-C leg may run or correct from 0.618 to 88.6. The B-D leg may range from 1.278 to 1.618. You will later realize that an ABCD in the 70 range is less successful than in the 60 or 80 range of bandwidth. Especially at the beginning, it often happens that you draw an “unclean ABCD,” which in reality was an X-ABCD. But more on this in a separate article.
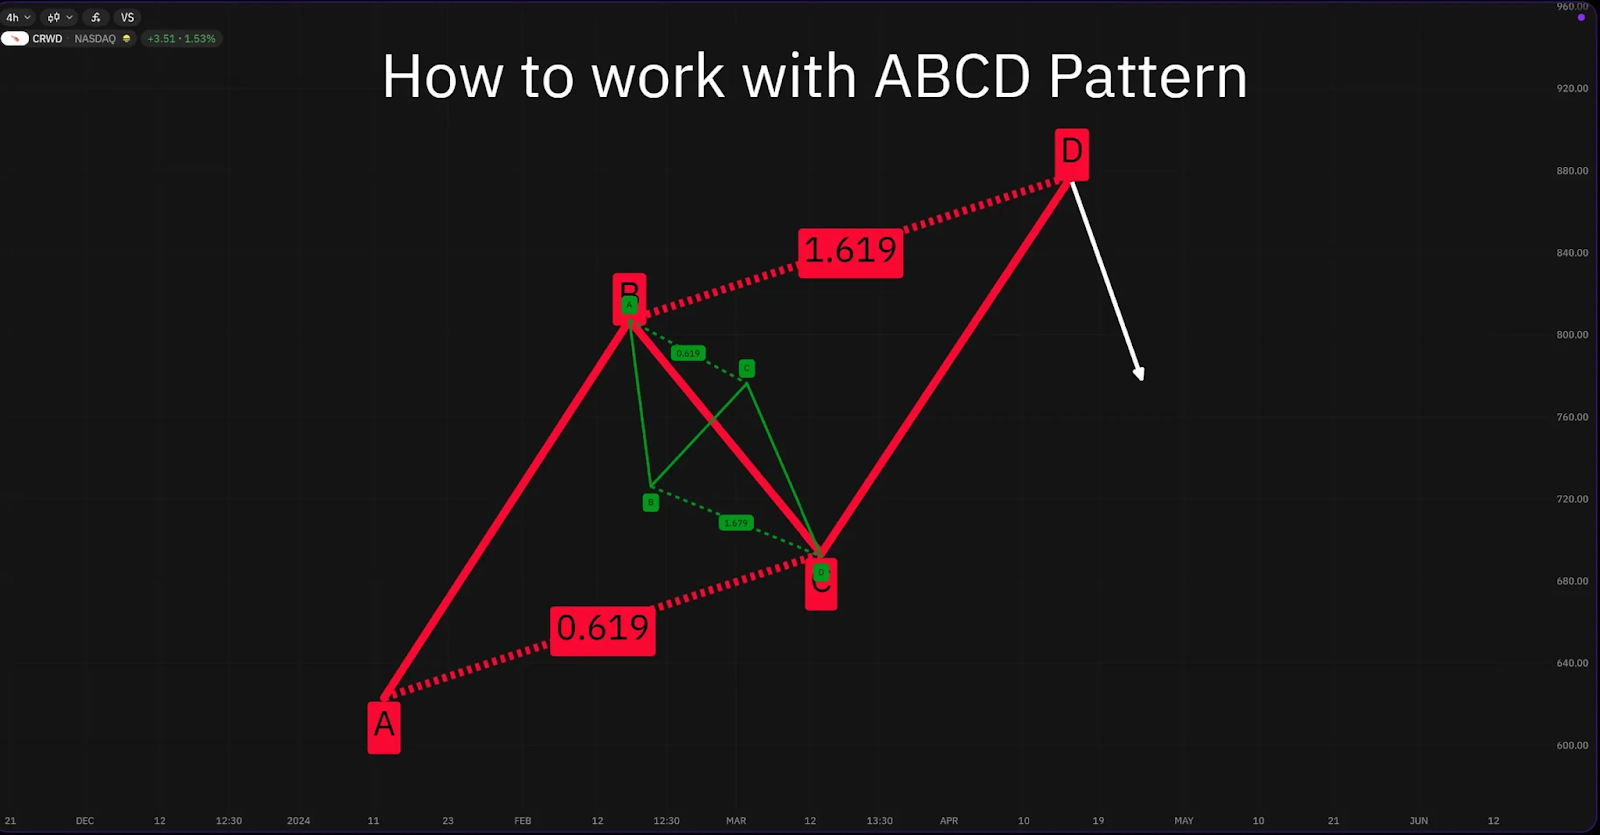
In the past, these patterns were worked out with the Fibonacci, but this was quite cumbersome and made the chart confusing due to the many Fibonaccis used. This tool only shows the Fibonacci ratio that corrected the A-axis.
The number between A & C shows the Fibonacci correction ratio to the first movement.
The upper number between B&D shows the ratio to the distance B-C. In our example, the pattern point B is exceeded by 27.9 %. 100 % + 27.9 % =1,279 in the Fibonacci tool. This is the number that can be read off.
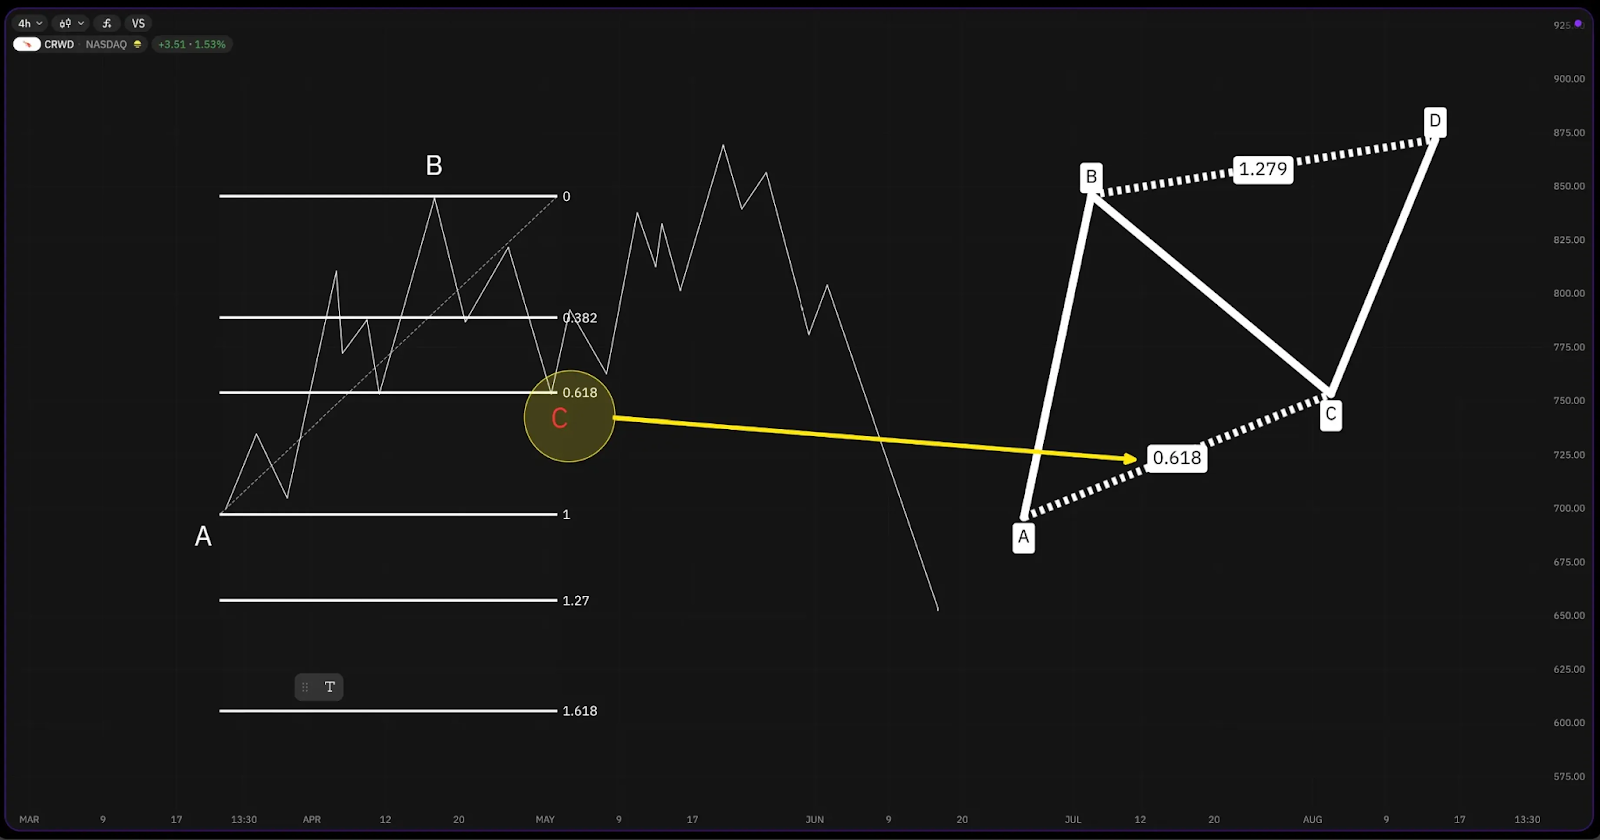
It is essential to understand where the numbers in the tool get the measured value from. The following graphic should clarify this once again.
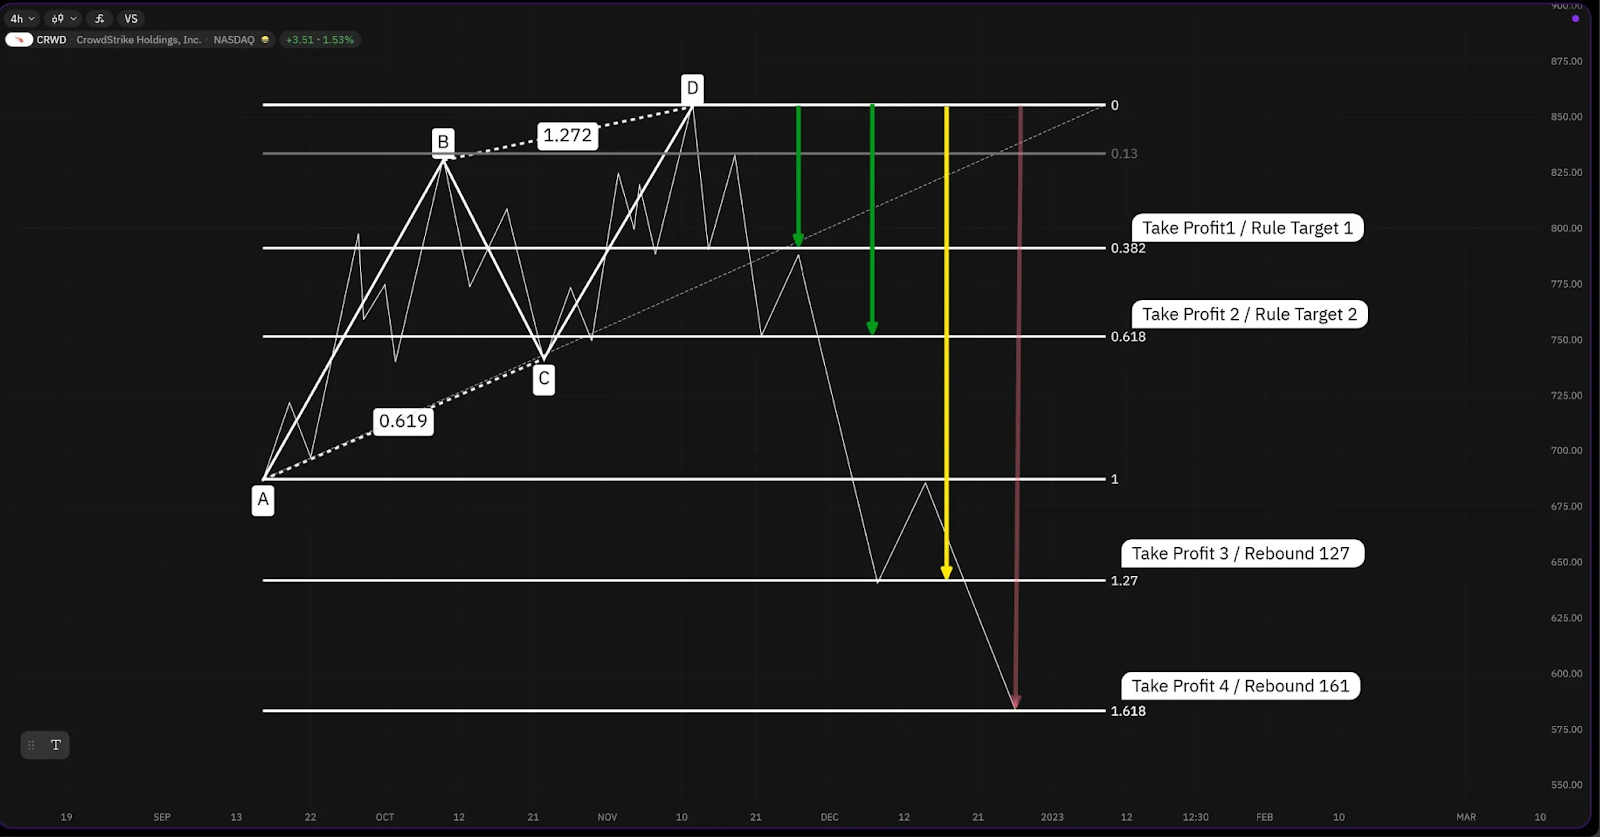
How to find price targets
To derive short targets from a complete ABCD pattern, use a Fibonacci again and draw it from A to D.
Generally speaking, these values are relevant.
- Target 1 at the 0.382 Fibonacci level
- Target 2 at the 0.618 Fibonacci level
- Rebound 13 at the 0.13 Fibonacci level
- Rebound 127 at the 1.272 Fibonacci level
- Rebound 161 at the 1.618 Fibonacci level
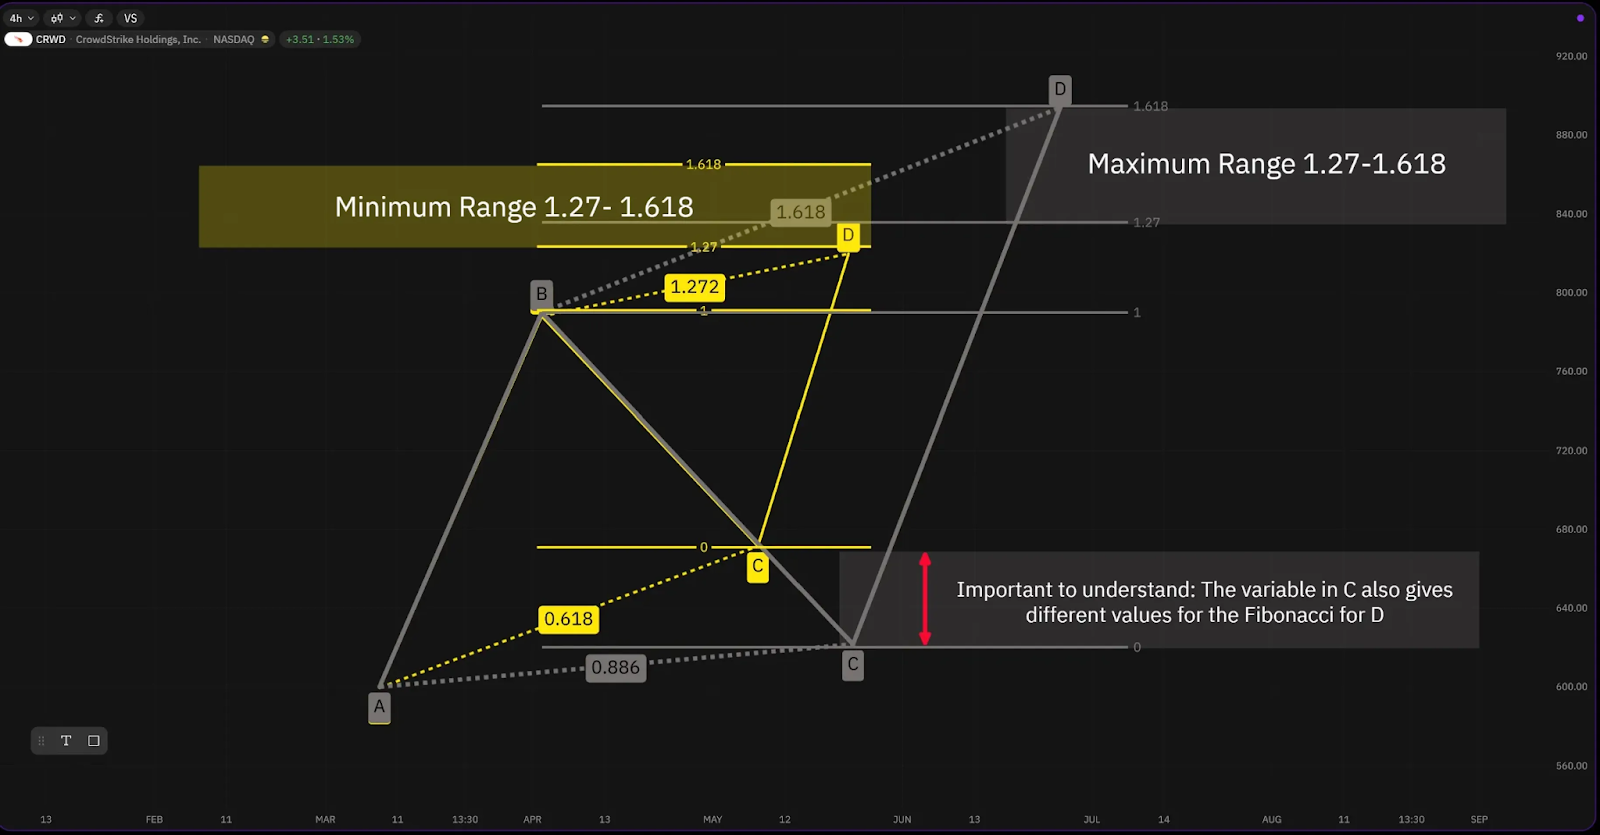
What you need to consider
Because the patterns can generally be compared with a dynamic template, it is important to know what is meant by “dynamic” and how this affects the analysis.
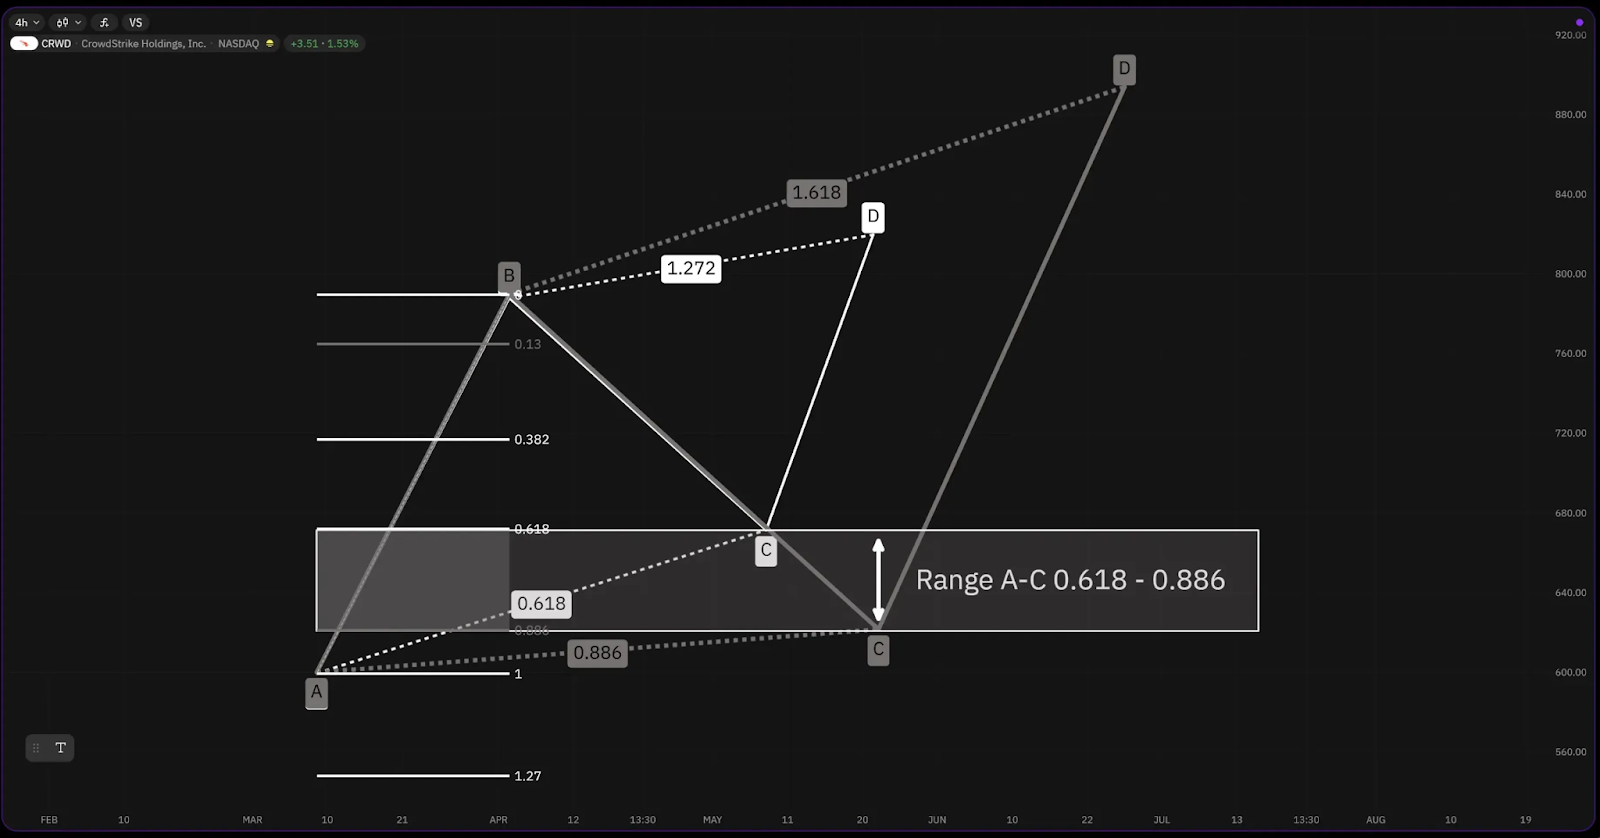
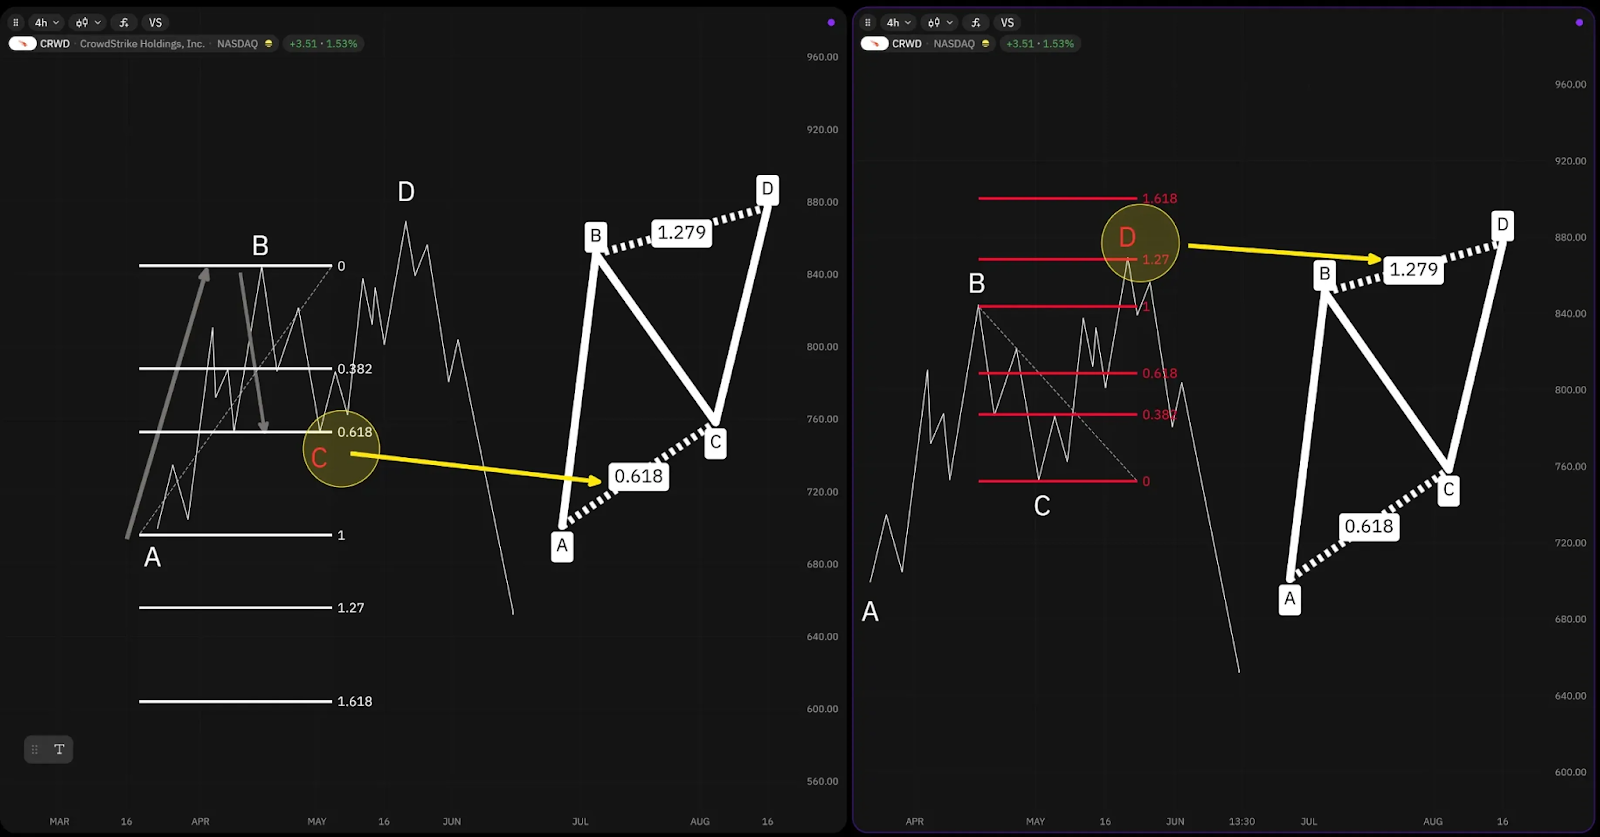
Pattern point C is subject to a bandwidth, and this naturally impacts the Fibonacci, which we have to take into account for pattern point D in the classic approach. However, the ABCD tool from Takeprofit.com automatically takes this into account.
How can a coherent strategy be developed from this? What evaluation criteria are there?
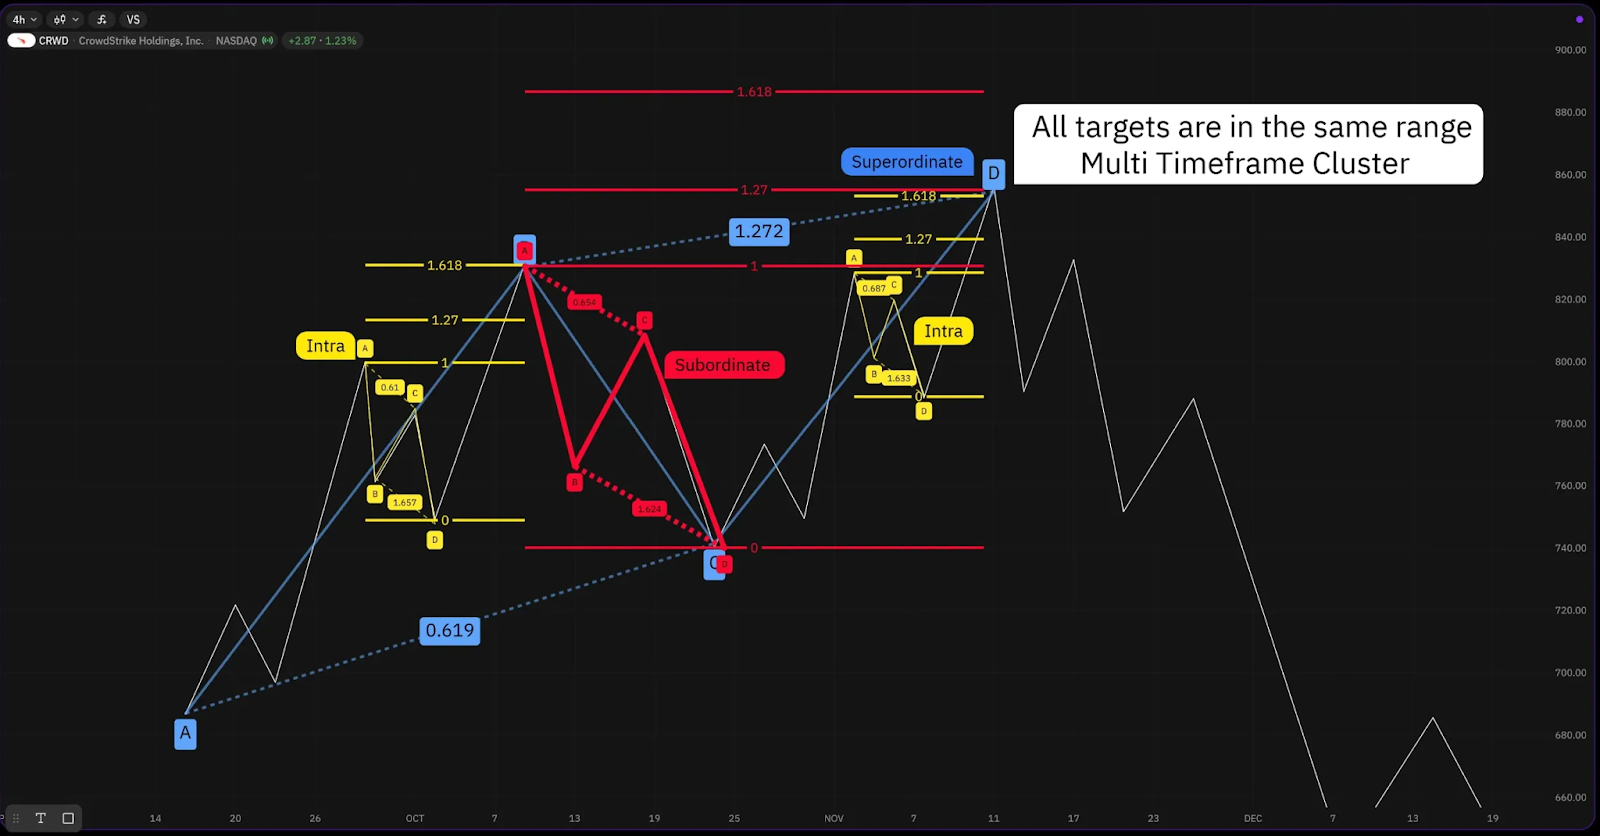
The MTC principle of harmonic patterns is a fractal trading strategy, which means that patterns in different timeframes can become a composite scenario. One strategy is to look for so-called cluster zones. To do this, you first have to assign meaning to the patterns and try to think in terms of “gears”. It is not uncommon for a target area of a small pattern to be the pattern point of a larger one.
We divide the patterns according to their meaning:
- Superordinate pattern (blue pattern in our example)
- Subordinate patterns (red pattern in our example)
- Intra pattern (yellow pattern in our example)
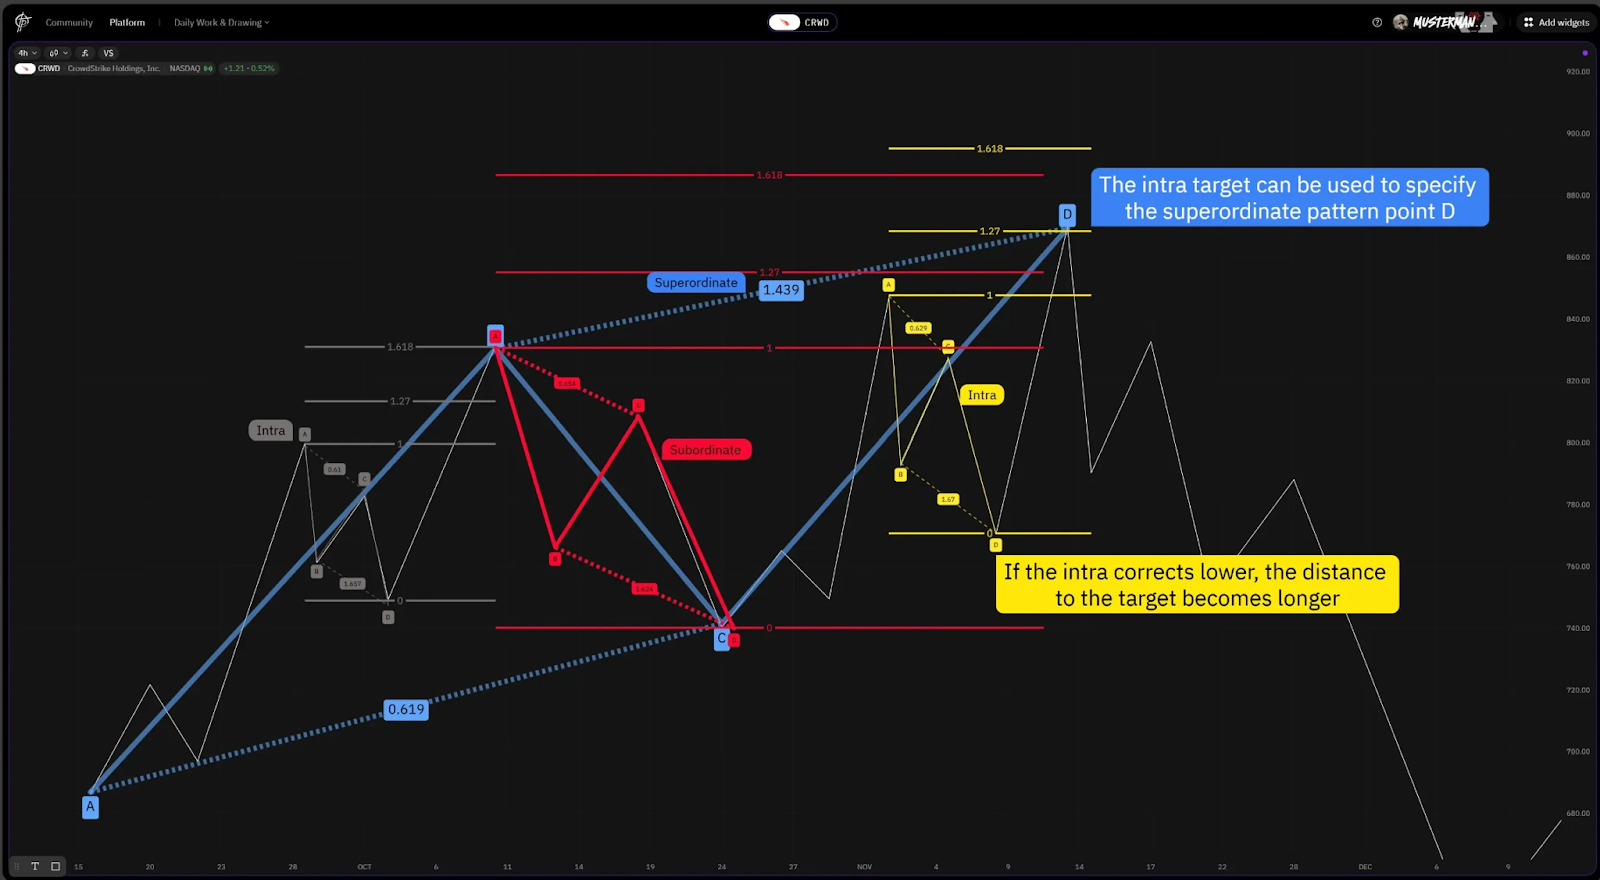
How do you define entries in the higher-level pattern?
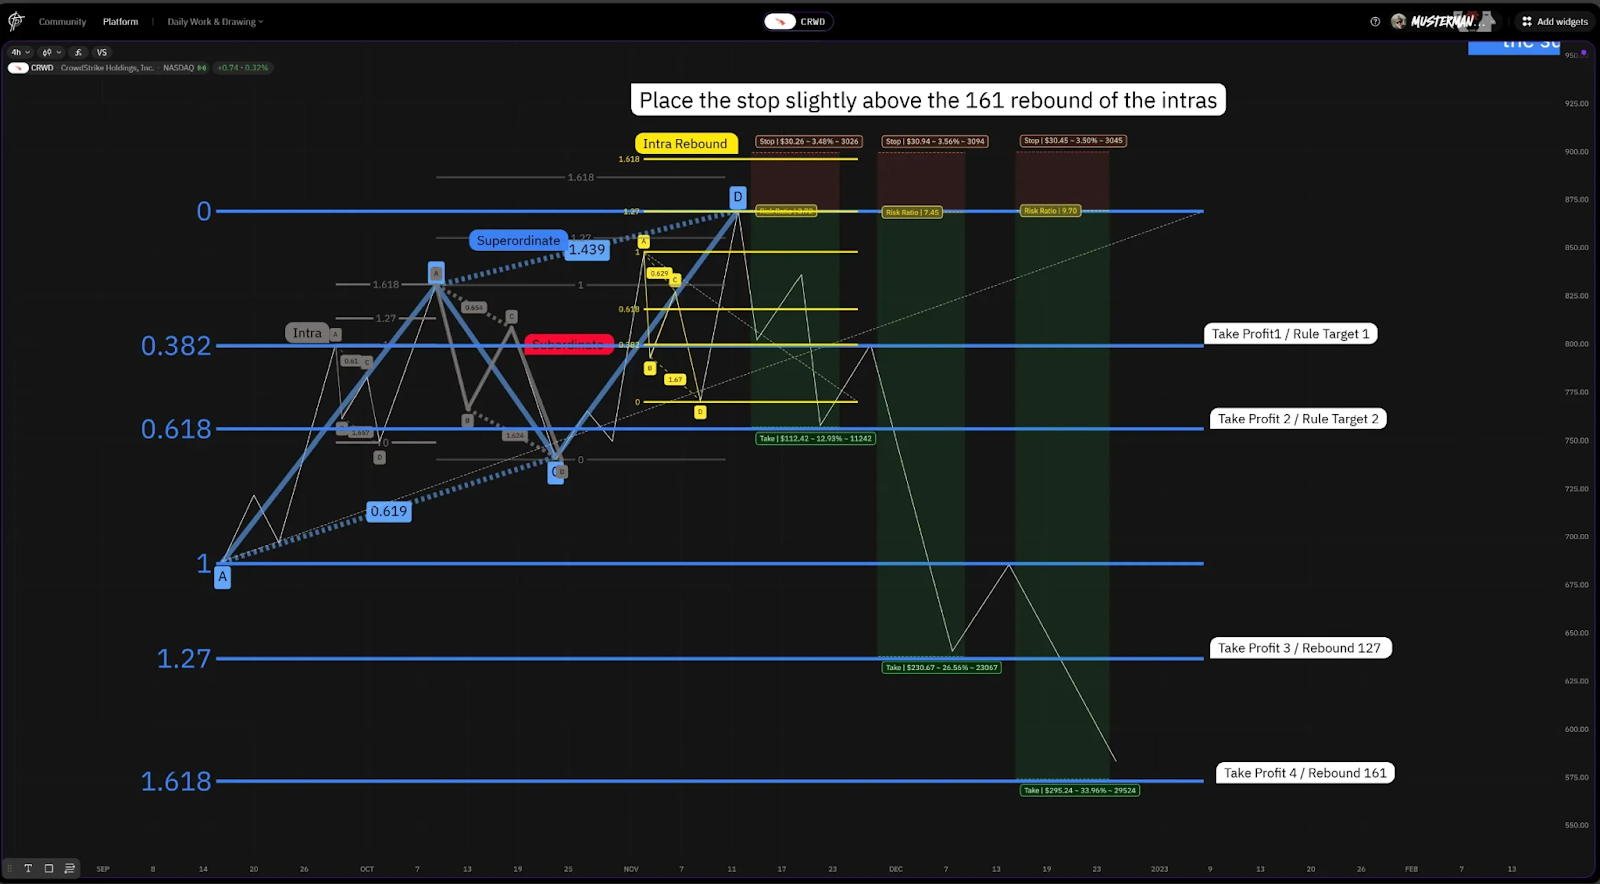
Now that we know how to categorize the patterns, we can react better to market situations. Let us now look at the last intra (yellow) in the next example. Here the corrective movement is larger, which not only leads to an intra pattern becoming larger overall, but also to its rebounds shifting further upwards. The blue pattern, which is looking for its pattern point D in the movement of the yellow intra-pattern, is now being extended. We can see an indication of a trend reversal and confirmation of the blue pattern if the intra rebound 1.272 (yellow) provides significant resistance. The subordinate red pattern also represents further indication. The entire final situation is in the target area of the rebounds 1.272 & 1.618. It is then rather unlikely that the yellow intra pattern will still reach its rebound 1.618.
How can you place appropriate stops and take profits?
Let's look at the yellow intra pattern in our example again. The red pattern has made it rather unlikely that the yellow intra pattern will reach its rebound 1.618. The stop is set with some room for possible price noise above the 1.618 or even 1.67 Fibonacci levels.
Professionals in the MTC pattern also refine their entries by breaking down the timeframes. For example, in the area of the blue pattern point D, there is usually no pattern in the 1-15 minute chart. If you choose to enter with the stop loss setup already presented in the very small timeframe and let the trades run out into the larger pattern, this results in far above-average risk/reward ratios. Appropriate money and position management are also important. The whole trading system aims to work out so-called Hedgeable entries, which means that the trader quickly moves his stop to the entry-level.
Here, you can find a practical example from Bitcoin_:
https://takeprofit.com/posts/bitcoin-abcd-ra1-15?via=mustermann84

Be the first to comment
Publish your first comment to unleash the wisdom of crowd.