> ## Documentation Index
> Fetch the complete documentation index at: https://takeprofit.com/docs/llms.txt
> Use this file to discover all available pages before exploring further.
> Step-by-step guide to Indie indicators. Write and customize technical indicators using @indicator, SMA algorithms, dynamic colors, and configurable input parameters.
# Quick start
To get you started quickly, let's write some indicators, starting with simple examples and gradually moving on to more
complex ones.
## Minimal indicator
Here is a minimal indicator for TakeProfit, which simply plots the 'close' price of the current chart instrument as a
solid line:
```py theme={null}
# indie:lang_version = 5
from indie import indicator
@indicator('Example 1')
def Main(self):
return self.close[0]
```
Let us take a closer look at what is happening in this example. First of all, the *entry point* of every indicator
is the `Main` function (it must be named `Main` to keep all things in a 'standardized' way).
The `Main` function is a function that is called for every candle of a chart instrument from left to right and after
that it is continued to be called on every real-time update of the last (rightmost) candle. To sum up, it returns an
*indicator value* for every candle of the main instrument.
There is a `self` parameter in the `Main` function and it is an object of type
[`MainContext`](/indie/Library-reference/package-indie#class_MainContext). It represents the main instrument of the chart, for example it
gives access to OHLCV values of the instrument (e.g. [`self.close`](/indie/Library-reference/package-indie#field_Context_close)). If you are
familiar with Python, then you probably know that `self` is a reference to the instance of the class that is currently
being used. It has the exact same meaning in Indie, though there are no classes in the code (yet). The `@indicator`
decorator is syntactic sugar that turns `def Main` function into a `class Main`. Read more about this in
[How Indie's syntactic sugar works](/indie/How-Indies-syntactic-sugar-works) section.
[*Context*](/indie/Library-reference/package-indie#class_Context), another new term (represented by a `self` parameter of `Main` function) is a representation of a current instrument displayed on a candle chart, with all its prices (open, high, low, close,
volume, etc.), some state and any other possible attributes it may have. In our example we take a series of close prices `self.close` and apply a square brackets operator to it to get the last (most recent) value of that price:
`self.close[0]`. Zero offset always corresponds to the last value (value on the last candle). Offset `1` corresponds to the value of the previous candle and so on.
Our `Main` function is decorated with a required [`@indicator`](/indie/Library-reference/package-indie#decor_indicator) decorator with a
required `title` param (`title` is the first param of this decorator, but you may write it in a kwarg form:
`@indicator(title='Example 1')`). In general, decorators (things whose names start with a `@` character) provide
*meta*-information about indicators to TakeProfit's runtime. Meta-information describes indicator in some way, we will
see a lot of this further.
Finally, please note that we have to `import` symbols like `indicator`, because they are not a part of Indie's
built-in symbols. For now, the list of things that are allowed to be imported in the indicator code is very limited.
But as the platform grows, the library will be expanded accordingly.
After you type (or better copy-paste) the above code into the *Code Editor* (which is a widget and it should be added
to your workspace first as **More Widgets** -> **Indicators Code Editor**) click on the button **Add to Chart**.
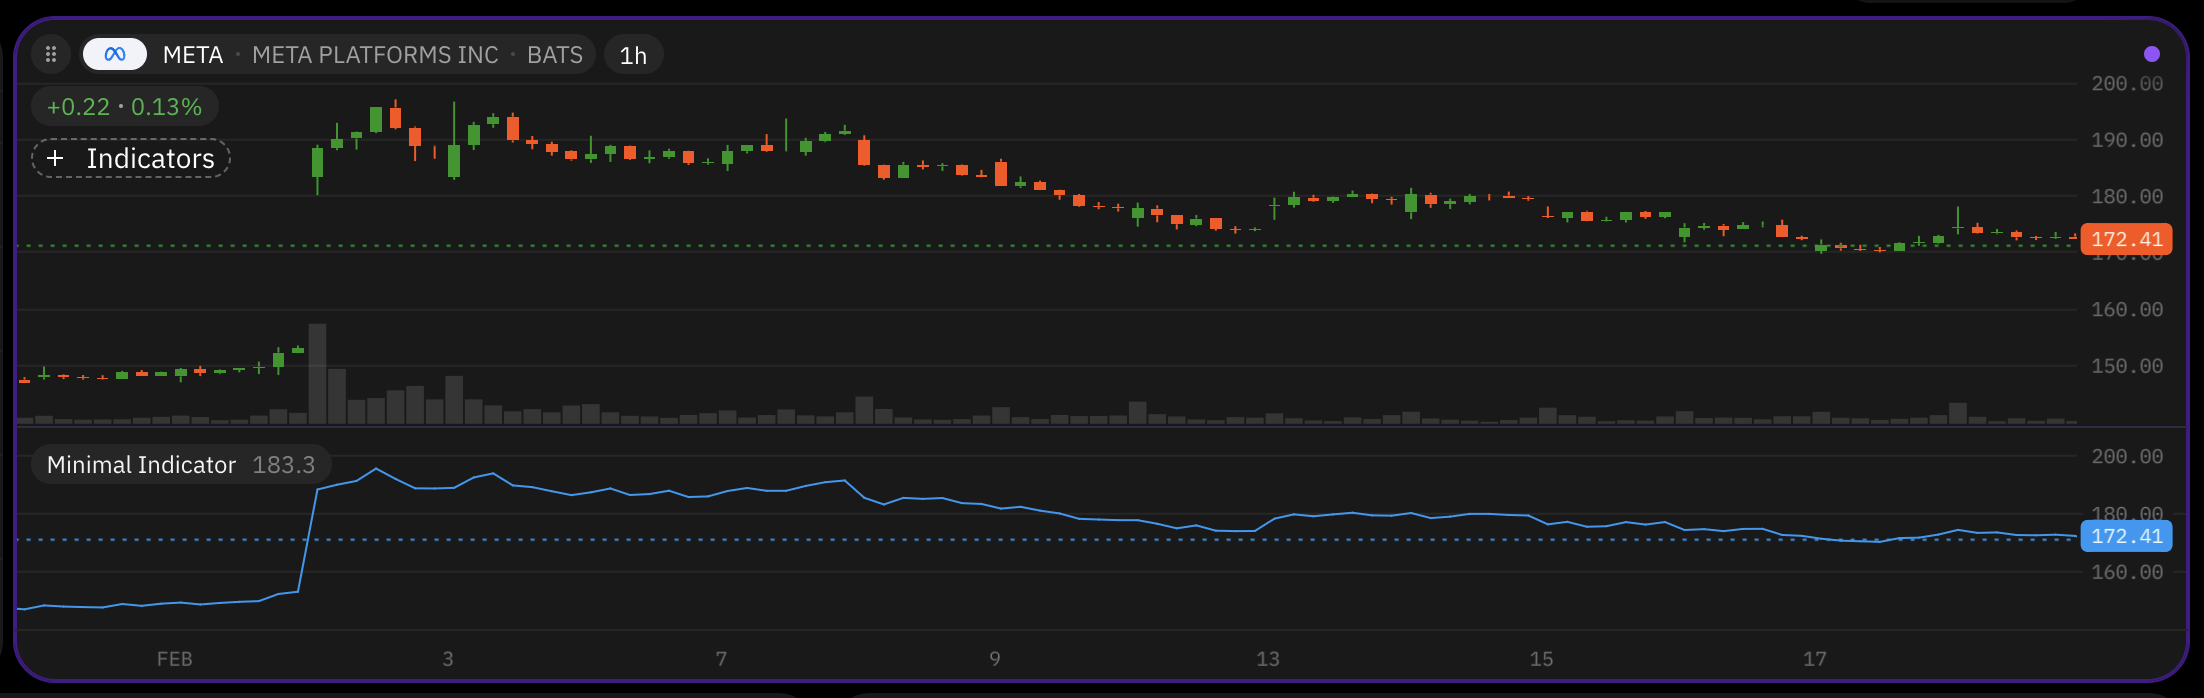
As you can see, the indicator was added on a separate pane, below the main pane with candle chart.
 ## Overlay main pane
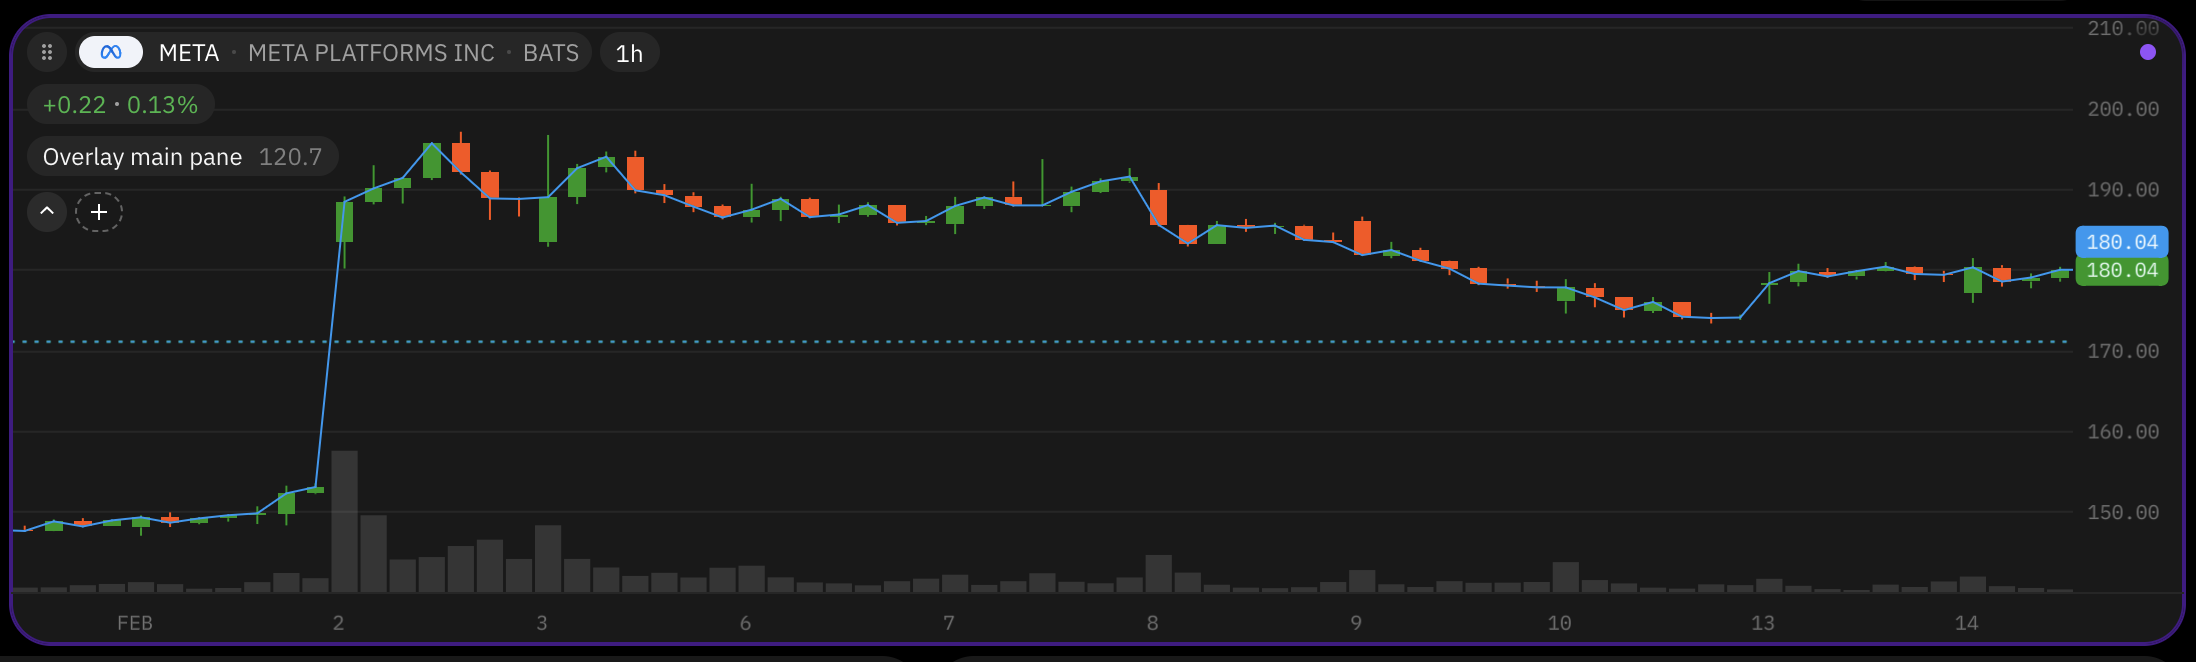
If we want to add our indicator as an overlay on candle chart, we may add `overlay_main_pane=True` param to the
`@indicator` decorator:
```py theme={null}
# indie:lang_version = 5
from indie import indicator
@indicator('Example 2', overlay_main_pane=True)
def Main(self):
return self.close[0]
```
## Overlay main pane
If we want to add our indicator as an overlay on candle chart, we may add `overlay_main_pane=True` param to the
`@indicator` decorator:
```py theme={null}
# indie:lang_version = 5
from indie import indicator
@indicator('Example 2', overlay_main_pane=True)
def Main(self):
return self.close[0]
```
 ## Apply the SMA algorithm
TakeProfit has a library of standard algorithms, such as *Simple Moving Average* ([SMA](/indie/Library-reference/package-indie-algorithms#class_Sma)), let us import and use it:
```py theme={null}
# indie:lang_version = 5
from indie import indicator
from indie.algorithms import Sma
@indicator('Example 3', overlay_main_pane=True)
def Main(self):
s = Sma.new(self.close, 12)
return s[0]
```
## Apply the SMA algorithm
TakeProfit has a library of standard algorithms, such as *Simple Moving Average* ([SMA](/indie/Library-reference/package-indie-algorithms#class_Sma)), let us import and use it:
```py theme={null}
# indie:lang_version = 5
from indie import indicator
from indie.algorithms import Sma
@indicator('Example 3', overlay_main_pane=True)
def Main(self):
s = Sma.new(self.close, 12)
return s[0]
```
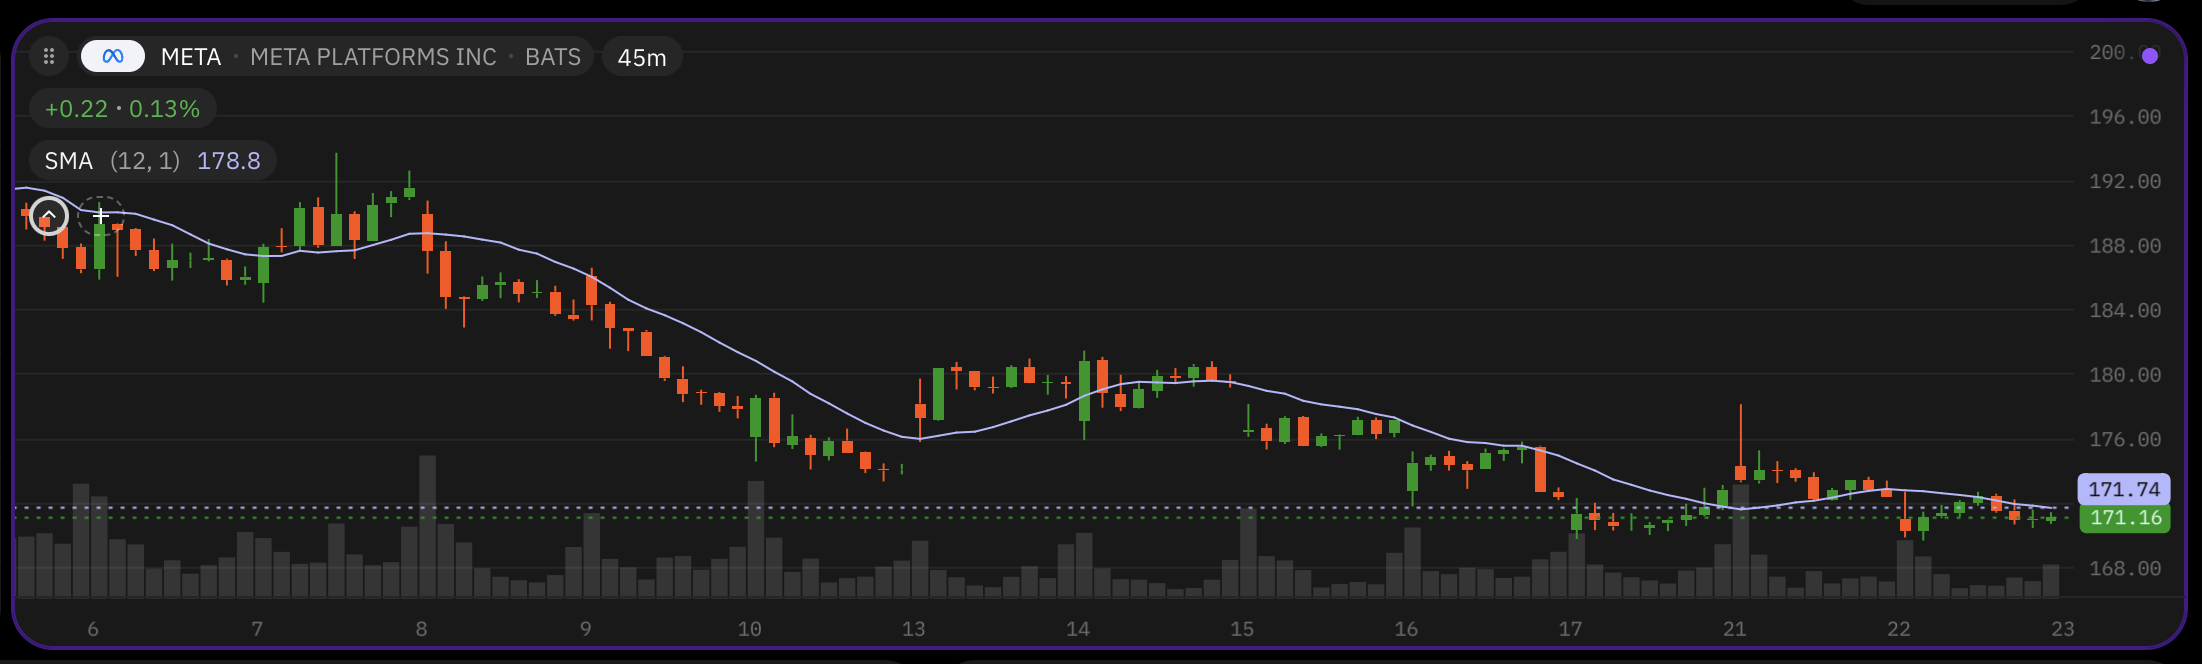 There are two essential parts that make it work: 1) import of the `Sma` algorithm from package `indie.algorithms` and 2) invocation of `Sma.new` in the indicator's code: `Sma.new(self.close, 12)`. Algorithms that process series of prices
(like `self.close`) usually return series of numeric values (variable `s`). More about algorithms in [this chapter](/indie/Algorithms-for-series-processing).
Let us make our indicator more interesting and calculate two SMAs with different lengths:
```py theme={null}
# indie:lang_version = 5
from indie import indicator
from indie.algorithms import Sma
@indicator('Example 4', overlay_main_pane=True)
def Main(self):
l = Sma.new(self.close, 42)
s = Sma.new(self.close, 12)
return l[0], s[0]
```
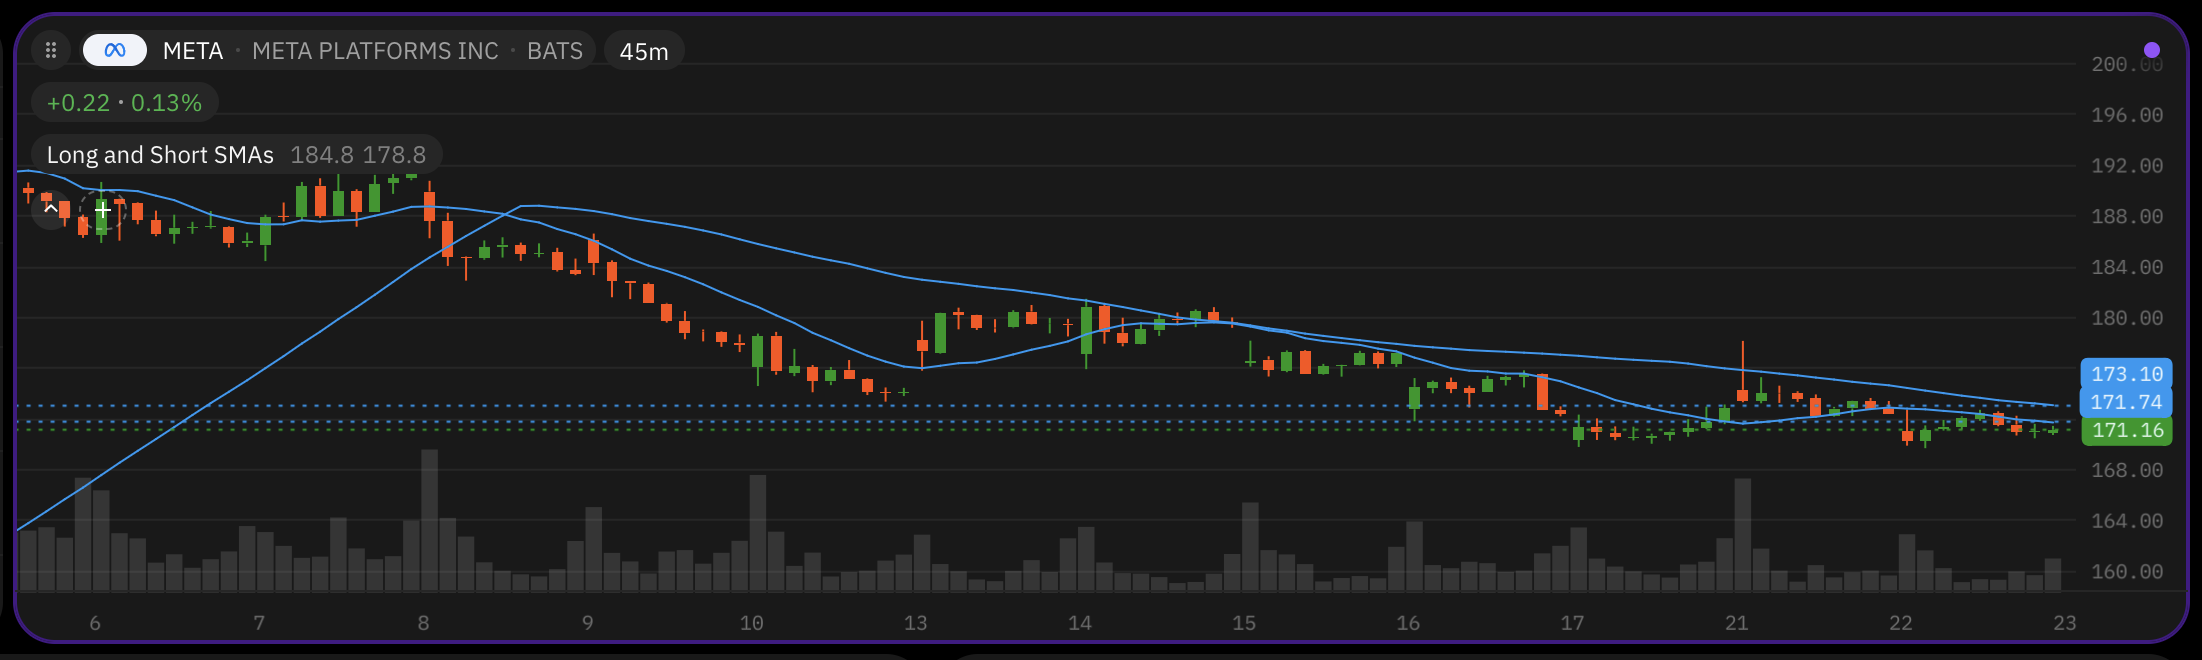
This indicator returns a *tuple* consisting of two values: `l[0]` and `s[0]`, that is why it plots two lines.
There are two essential parts that make it work: 1) import of the `Sma` algorithm from package `indie.algorithms` and 2) invocation of `Sma.new` in the indicator's code: `Sma.new(self.close, 12)`. Algorithms that process series of prices
(like `self.close`) usually return series of numeric values (variable `s`). More about algorithms in [this chapter](/indie/Algorithms-for-series-processing).
Let us make our indicator more interesting and calculate two SMAs with different lengths:
```py theme={null}
# indie:lang_version = 5
from indie import indicator
from indie.algorithms import Sma
@indicator('Example 4', overlay_main_pane=True)
def Main(self):
l = Sma.new(self.close, 42)
s = Sma.new(self.close, 12)
return l[0], s[0]
```
This indicator returns a *tuple* consisting of two values: `l[0]` and `s[0]`, that is why it plots two lines.
 ## Plot with different colors
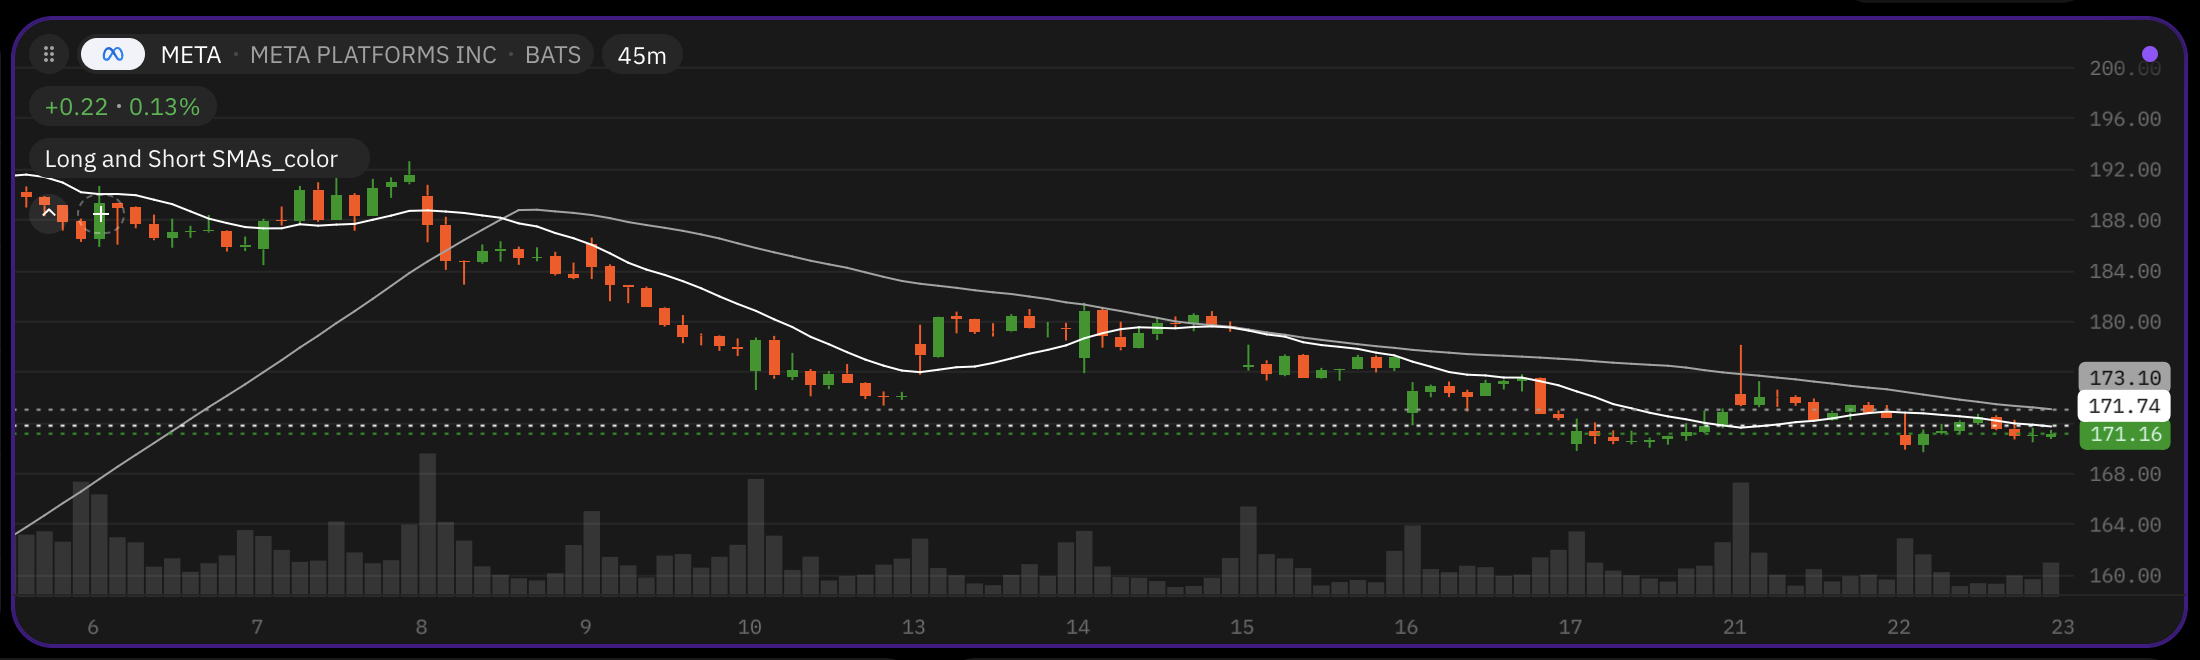
There are two different ways to colorize indicator's plot lines. First one is to use one single color for the whole
plot. In such a way, colors are actually not involved in calculation over the candle price, they are part of
indicator's meta-information. We use `@plot.line` decorator for such way of coloring:
```py theme={null}
# indie:lang_version = 5
from indie import indicator, color, plot
from indie.algorithms import Sma
@indicator('Example 5', overlay_main_pane=True)
@plot.line(color=color.GRAY)
@plot.line(color=color.WHITE)
def Main(self):
l = Sma.new(self.close, 42)
s = Sma.new(self.close, 12)
return l[0], s[0]
```
## Plot with different colors
There are two different ways to colorize indicator's plot lines. First one is to use one single color for the whole
plot. In such a way, colors are actually not involved in calculation over the candle price, they are part of
indicator's meta-information. We use `@plot.line` decorator for such way of coloring:
```py theme={null}
# indie:lang_version = 5
from indie import indicator, color, plot
from indie.algorithms import Sma
@indicator('Example 5', overlay_main_pane=True)
@plot.line(color=color.GRAY)
@plot.line(color=color.WHITE)
def Main(self):
l = Sma.new(self.close, 42)
s = Sma.new(self.close, 12)
return l[0], s[0]
```
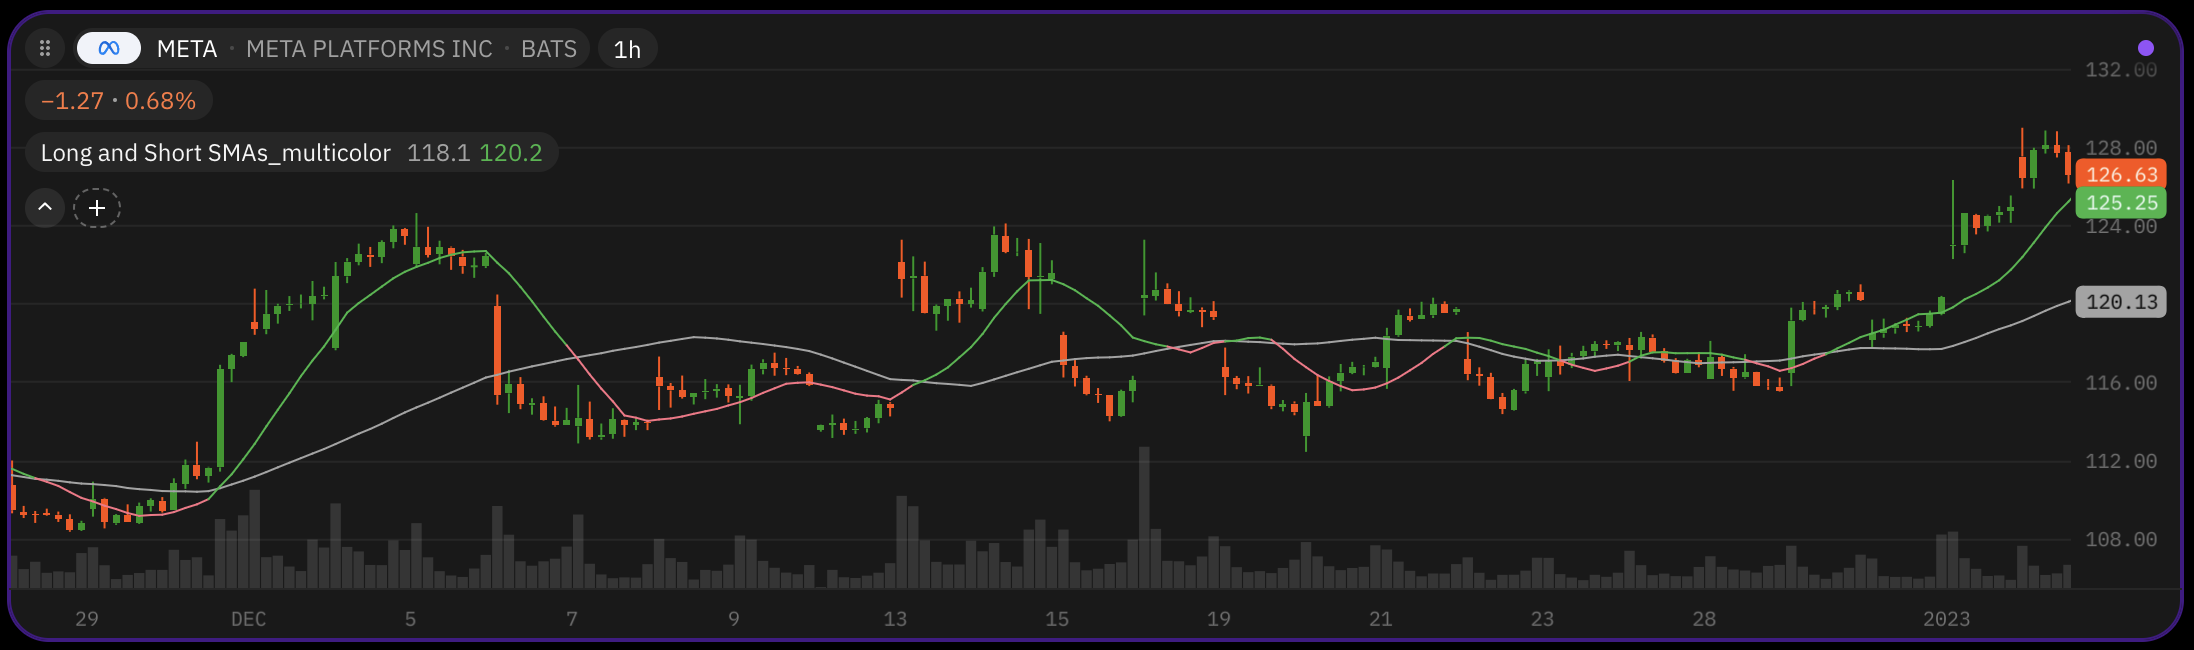
 What if we would like to make a multicolored plot line? We may want to calculate the color depending on
the candle price data. If so, we would return from `Main` function not plain numbers, but `plot.Line` objects:
```py theme={null}
# indie:lang_version = 5
from indie import indicator, color, plot
from indie.algorithms import Sma
@indicator('Example 6', overlay_main_pane=True)
@plot.line(color=color.GRAY)
def Main(self):
l = Sma.new(self.close, 42)
s = Sma.new(self.close, 12)
s_color = color.GREEN if s[0] > l[0] else color.RED
return l[0], plot.Line(s[0], color=s_color)
```
What if we would like to make a multicolored plot line? We may want to calculate the color depending on
the candle price data. If so, we would return from `Main` function not plain numbers, but `plot.Line` objects:
```py theme={null}
# indie:lang_version = 5
from indie import indicator, color, plot
from indie.algorithms import Sma
@indicator('Example 6', overlay_main_pane=True)
@plot.line(color=color.GRAY)
def Main(self):
l = Sma.new(self.close, 42)
s = Sma.new(self.close, 12)
s_color = color.GREEN if s[0] > l[0] else color.RED
return l[0], plot.Line(s[0], color=s_color)
```
 ## Input parameters
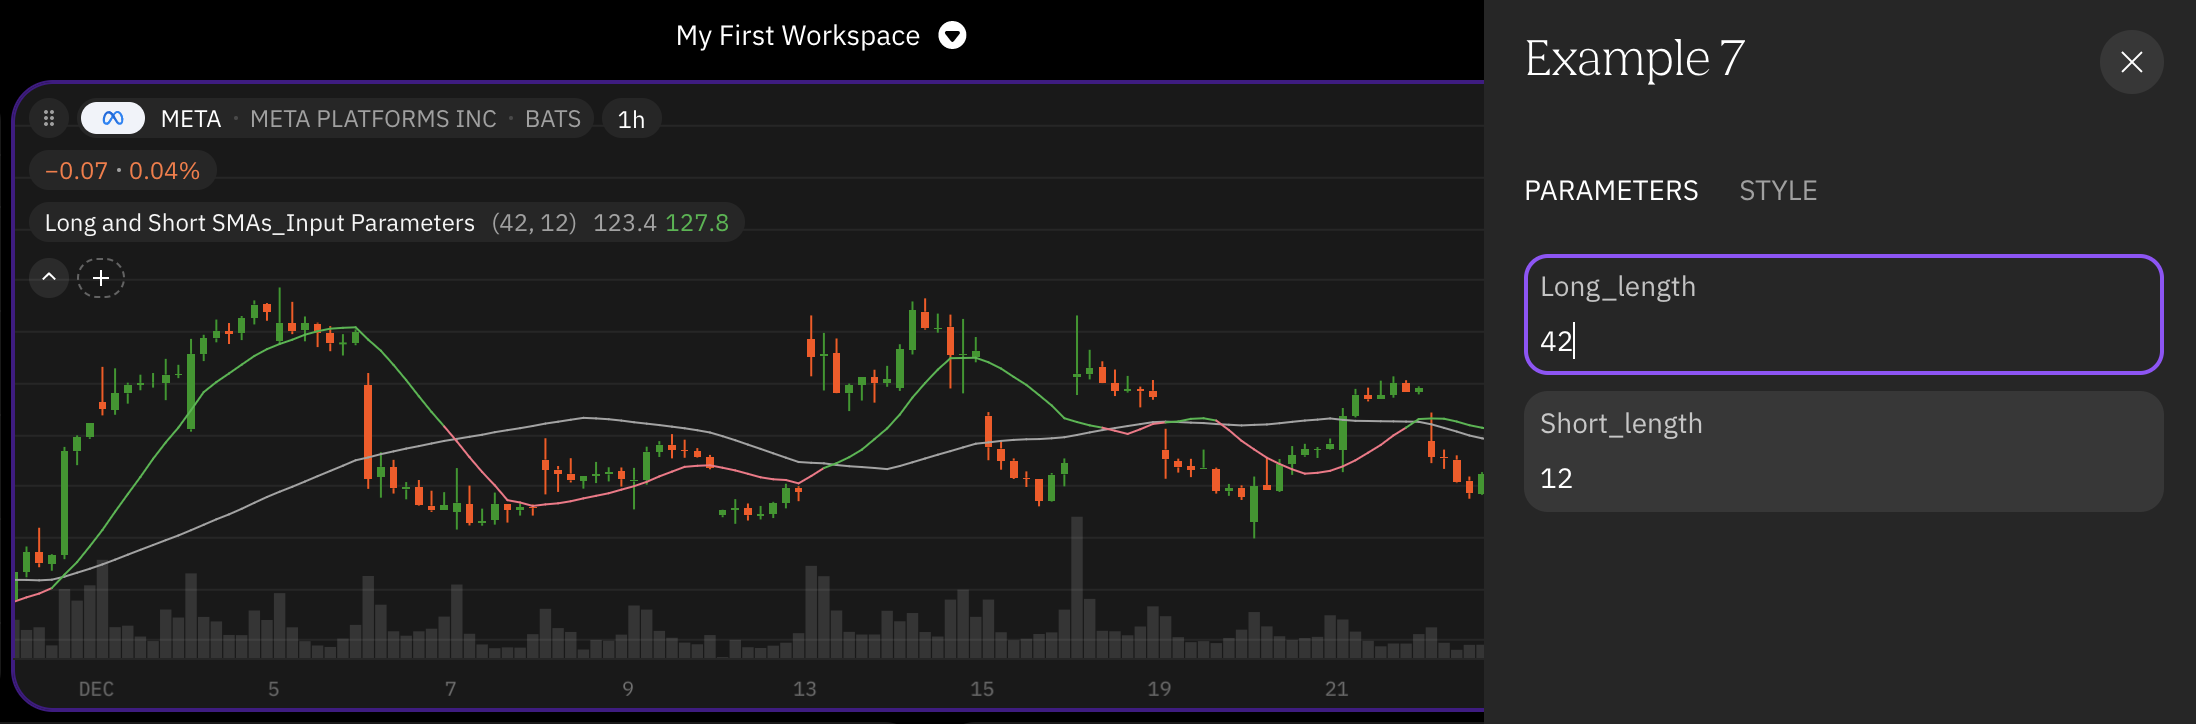
It would be better not to hardcode the lengths of our two SMAs (literal constants `42` and `12`) but instead use named
parameters. Named parameters are very convenient because they can be modified in the indicator's **Settings** panel
without modifying the indicator's source code. For this purpose there is a whole set of decorators, starting with the
`@param.` prefix, for example: `@param.int`, `@param.bool`, `@param.string` and so on. Let us incorporate them in our
example indicator:
```py theme={null}
# indie:lang_version = 5
from indie import indicator, color, plot, param
from indie.algorithms import Sma
@indicator('Example 7', overlay_main_pane=True)
@param.int('long_length', default=42)
@param.int('short_length', default=12)
@plot.line(color=color.GRAY)
def Main(self, long_length, short_length):
l = Sma.new(self.close, long_length)
s = Sma.new(self.close, short_length)
s_color = color.GREEN if s[0] > l[0] else color.RED
return l[0], plot.Line(s[0], color=s_color)
```
## Input parameters
It would be better not to hardcode the lengths of our two SMAs (literal constants `42` and `12`) but instead use named
parameters. Named parameters are very convenient because they can be modified in the indicator's **Settings** panel
without modifying the indicator's source code. For this purpose there is a whole set of decorators, starting with the
`@param.` prefix, for example: `@param.int`, `@param.bool`, `@param.string` and so on. Let us incorporate them in our
example indicator:
```py theme={null}
# indie:lang_version = 5
from indie import indicator, color, plot, param
from indie.algorithms import Sma
@indicator('Example 7', overlay_main_pane=True)
@param.int('long_length', default=42)
@param.int('short_length', default=12)
@plot.line(color=color.GRAY)
def Main(self, long_length, short_length):
l = Sma.new(self.close, long_length)
s = Sma.new(self.close, short_length)
s_color = color.GREEN if s[0] > l[0] else color.RED
return l[0], plot.Line(s[0], color=s_color)
```
 More info about input parameters in [this](/indie/Input-parameters) chapter.