> ## Documentation Index
> Fetch the complete documentation index at: https://takeprofit.com/docs/llms.txt
> Use this file to discover all available pages before exploring further.
# Fills, levels, and bands
## Fills
The area between any two plots can be filled with a color (often semi-transparent). To use this feature there is a
[`@plot.fill`](/indie/Library-reference/package-indie-plot#decor_fill) decorator and a [`plot.Fill`](/indie/Library-reference/package-indie-plot#class_Fill) class.
In the first place the `@plot.fill` decorator declares which two plots should be used for filling. Optionally
it may have a color argument, which should be used if a single-colored fill is desired.
### Single-colored fill
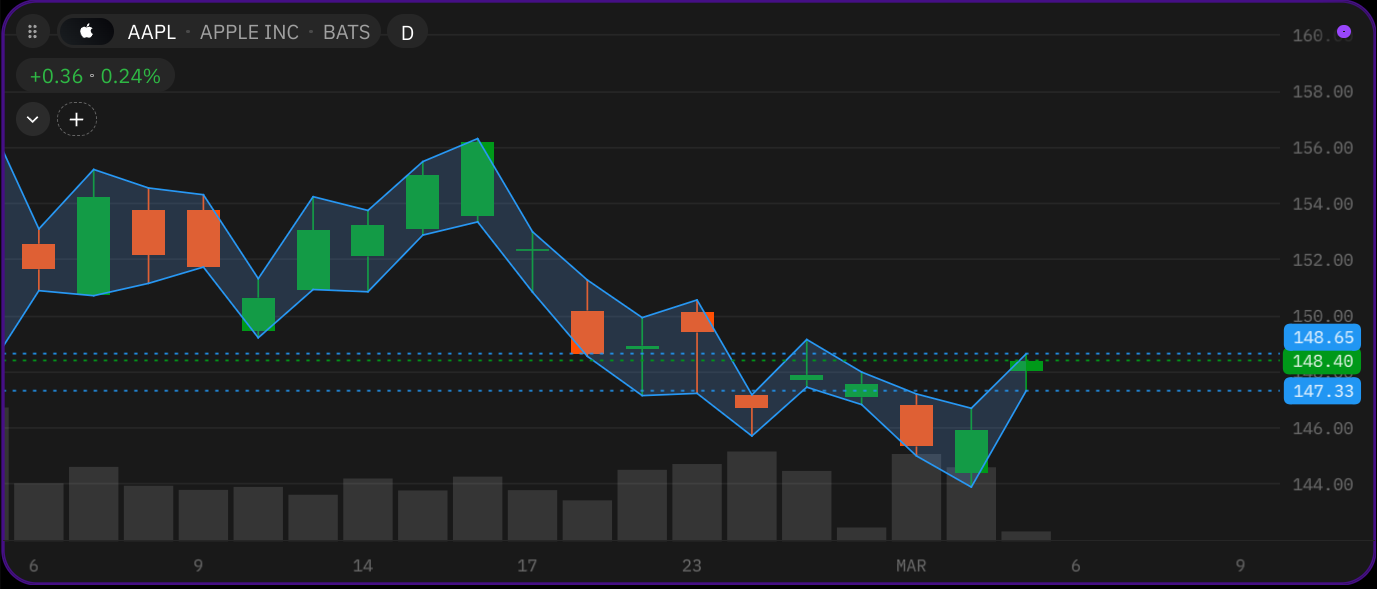
The simplest possible use case fills the space between two plot lines:
```py theme={null}
# indie:lang_version = 5
from indie import indicator, color, plot
@indicator('Example 1', overlay_main_pane=True)
@plot.line('p1')
@plot.line('p2')
@plot.fill('p1', 'p2', color=color.BLUE(0.2))
def Main(self):
a = self.high
b = self.low
return a[0], b[0], plot.Fill()
```
 Please note that both `@plot.fill` decorator and `plot.Fill` object always must be used together. Even in simple cases of a
single-colored fill where the `plot.Fill` object is constructed with all default values (i.e. with no arguments `plot.Fill()`).
This is because `@plot.fill` occupies one output slot in the return tuple, the same way `@plot.line` or `@plot.marker` do.
Unlike `@level` and `@band`, which are purely static decorators and require no return value, each `@plot.fill` must have
a corresponding `plot.Fill()` in the return. This also means that `plot.Fill(color=c)` can override the static color
from the decorator per bar, as shown in the "Multicolored fill" section below.
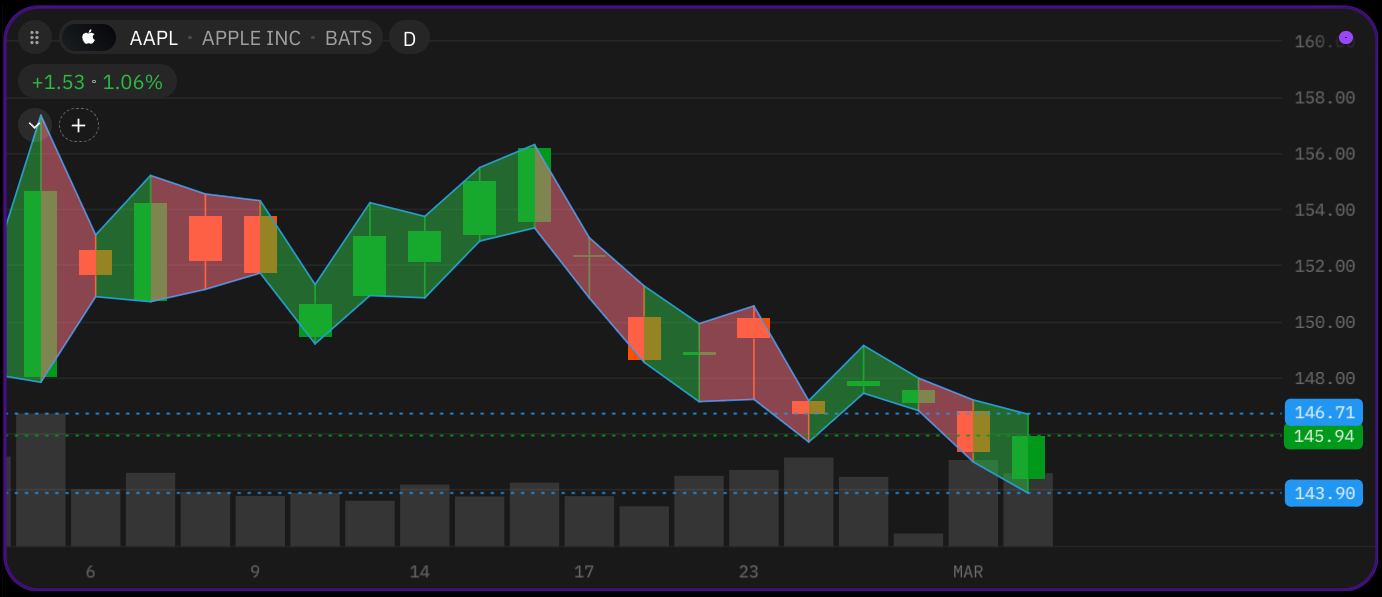
### Multicolored fill
If a multicolored fill is needed, then the color value should be calculated in the `Main` function code and passed as
argument to a `plot.Fill` object returned by the `Main` function.
```py theme={null}
# indie:lang_version = 5
from indie import indicator, color, plot
@indicator('Example 2', overlay_main_pane=True)
@plot.line('p1')
@plot.line('p2')
@plot.fill('p1', 'p2')
def Main(self):
c = color.GREEN(0.5) if self.close[0] > self.open[0] else color.RED(0.5)
return self.high[0], self.low[0], plot.Fill(color=c) # NOTE: This color will override color in @plot.fill decorator if any
```
Please note that both `@plot.fill` decorator and `plot.Fill` object always must be used together. Even in simple cases of a
single-colored fill where the `plot.Fill` object is constructed with all default values (i.e. with no arguments `plot.Fill()`).
This is because `@plot.fill` occupies one output slot in the return tuple, the same way `@plot.line` or `@plot.marker` do.
Unlike `@level` and `@band`, which are purely static decorators and require no return value, each `@plot.fill` must have
a corresponding `plot.Fill()` in the return. This also means that `plot.Fill(color=c)` can override the static color
from the decorator per bar, as shown in the "Multicolored fill" section below.
### Multicolored fill
If a multicolored fill is needed, then the color value should be calculated in the `Main` function code and passed as
argument to a `plot.Fill` object returned by the `Main` function.
```py theme={null}
# indie:lang_version = 5
from indie import indicator, color, plot
@indicator('Example 2', overlay_main_pane=True)
@plot.line('p1')
@plot.line('p2')
@plot.fill('p1', 'p2')
def Main(self):
c = color.GREEN(0.5) if self.close[0] > self.open[0] else color.RED(0.5)
return self.high[0], self.low[0], plot.Fill(color=c) # NOTE: This color will override color in @plot.fill decorator if any
```
 ### Multicolored fill with an offset
`plot.Fill()` has an optional parameter `offset: int`. It may be used to shift the coloring to the left (if `offset` is
negative) or to the right (if `offset` is positive):
```py theme={null}
# indie:lang_version = 5
from indie import indicator, color, plot, param
@indicator('Example 3', overlay_main_pane=True)
@plot.line('p1')
@plot.line('p2')
@plot.fill('p1', 'p2')
@param.int('fill_offset', default=2)
def Main(self, fill_offset):
c = color.GREEN(0.5) if self.close[0] > self.open[0] else color.RED(0.5)
return self.high[0], self.low[0], plot.Fill(color=c, offset=fill_offset)
```
Please note that a non-zero fill `offset` only affects multi-color fills and has no effect on single-color ones.
### Fill combined with markers
When using `@plot.fill` alongside `@plot.marker`, each decorator needs its own return value.
Count all `@plot.*` decorators — the return tuple must have the same number of items.
```py theme={null}
# indie:lang_version = 5
from indie import indicator, color, plot
from indie.algorithms import Rsi
@indicator('RSI with Fill and Signal')
@plot.line(id='rsi', color=color.AQUA, title='RSI')
@plot.line(id='ob', color=color.rgba(255,80,80,0.6), title='Overbought')
@plot.line(id='os', color=color.rgba(80,200,80,0.6), title='Oversold')
@plot.fill('ob', 'os', color=color.rgba(100,100,200,0.1), title='Neutral Zone')
@plot.marker(style=plot.marker_style.CIRCLE, position=plot.marker_position.BELOW, size=5, title='Buy Signal')
def Main(self):
rsi_val = Rsi.new(self.close, 14)[0]
fill_color = color.rgba(255,100,100,0.2) if rsi_val >= 70 else (
color.rgba(100,255,100,0.2) if rsi_val <= 30 else color.rgba(100,100,200,0.1)
)
buy_color = color.GREEN if rsi_val <= 30 else color.rgba(0,0,0,0)
# 5 decorators → 5 return values: rsi, ob, os, fill, marker
return rsi_val, 70.0, 30.0, plot.Fill(color=fill_color), plot.Marker(value=rsi_val, color=buy_color)
```
## Levels
[`@level()`](/indie/Library-reference/package-indie#decor_level) decorator creates a level (horizontal line).
```txt theme={null}
@level(
value: float,
title: indie.Optional[str] = None,
line_color: indie.Color = indie.color.GRAY(0.5),
line_style: int = indie.line_style.DASHED,
line_width: int = 1
) -> NoneType
```
Parameters:
* `value` — Value of the level on the indicator's vertical scale
* `title` — Human-readable title which is visible in the indicator's Settings panel.
* `line_color` — Color of the line.
* `line_style` — Style of the line. It is represented as enum value of type `line_style`.
* `line_width` — Width of the line.
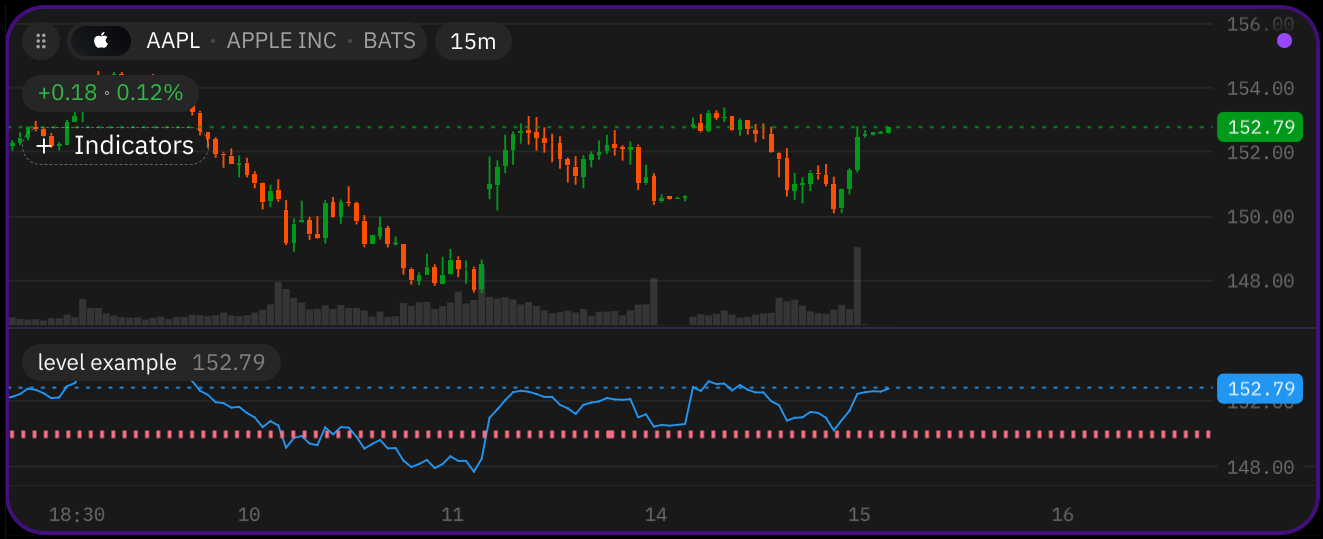
Example:
```py theme={null}
# indie:lang_version = 5
from indie import indicator, level, color
@indicator('Level example')
@level(150, line_color=color.RED, line_width=4)
def Main(self):
return self.close[0]
```
### Multicolored fill with an offset
`plot.Fill()` has an optional parameter `offset: int`. It may be used to shift the coloring to the left (if `offset` is
negative) or to the right (if `offset` is positive):
```py theme={null}
# indie:lang_version = 5
from indie import indicator, color, plot, param
@indicator('Example 3', overlay_main_pane=True)
@plot.line('p1')
@plot.line('p2')
@plot.fill('p1', 'p2')
@param.int('fill_offset', default=2)
def Main(self, fill_offset):
c = color.GREEN(0.5) if self.close[0] > self.open[0] else color.RED(0.5)
return self.high[0], self.low[0], plot.Fill(color=c, offset=fill_offset)
```
Please note that a non-zero fill `offset` only affects multi-color fills and has no effect on single-color ones.
### Fill combined with markers
When using `@plot.fill` alongside `@plot.marker`, each decorator needs its own return value.
Count all `@plot.*` decorators — the return tuple must have the same number of items.
```py theme={null}
# indie:lang_version = 5
from indie import indicator, color, plot
from indie.algorithms import Rsi
@indicator('RSI with Fill and Signal')
@plot.line(id='rsi', color=color.AQUA, title='RSI')
@plot.line(id='ob', color=color.rgba(255,80,80,0.6), title='Overbought')
@plot.line(id='os', color=color.rgba(80,200,80,0.6), title='Oversold')
@plot.fill('ob', 'os', color=color.rgba(100,100,200,0.1), title='Neutral Zone')
@plot.marker(style=plot.marker_style.CIRCLE, position=plot.marker_position.BELOW, size=5, title='Buy Signal')
def Main(self):
rsi_val = Rsi.new(self.close, 14)[0]
fill_color = color.rgba(255,100,100,0.2) if rsi_val >= 70 else (
color.rgba(100,255,100,0.2) if rsi_val <= 30 else color.rgba(100,100,200,0.1)
)
buy_color = color.GREEN if rsi_val <= 30 else color.rgba(0,0,0,0)
# 5 decorators → 5 return values: rsi, ob, os, fill, marker
return rsi_val, 70.0, 30.0, plot.Fill(color=fill_color), plot.Marker(value=rsi_val, color=buy_color)
```
## Levels
[`@level()`](/indie/Library-reference/package-indie#decor_level) decorator creates a level (horizontal line).
```txt theme={null}
@level(
value: float,
title: indie.Optional[str] = None,
line_color: indie.Color = indie.color.GRAY(0.5),
line_style: int = indie.line_style.DASHED,
line_width: int = 1
) -> NoneType
```
Parameters:
* `value` — Value of the level on the indicator's vertical scale
* `title` — Human-readable title which is visible in the indicator's Settings panel.
* `line_color` — Color of the line.
* `line_style` — Style of the line. It is represented as enum value of type `line_style`.
* `line_width` — Width of the line.
Example:
```py theme={null}
# indie:lang_version = 5
from indie import indicator, level, color
@indicator('Level example')
@level(150, line_color=color.RED, line_width=4)
def Main(self):
return self.close[0]
```
 ## Bands
[`@band()`](/indie/Library-reference/package-indie#decor_band) decorator creates a band (two horizontal lines usually with a semi-transparent fill in between them).
```txt theme={null}
@band(
value1: float,
value2: float,
title: indie.Optional[str] = None,
fill_color: indie.Color = indie.color.GREEN(0.05),
line_color: indie.Color = indie.color.GRAY(0.5),
line_style: int = indie.line_style.DASHED,
line_width: int = 1
) -> NoneType
```
Parameters:
* `value1` — Value of the first horizontal line of a band on a vertical scale of an indicator.
* `value2` — Value of the second horizontal line of a band on a vertical scale of an indicator.
* `title` — Human-readable title which is visible in the indicator's Settings panel.
* `fill_color` — Color of the background.
* `line_color` — Color of the line.
* `line_style` — Style of the line. It is represented as enum value of type `line_style`.
* `line_width` — Width of the line.
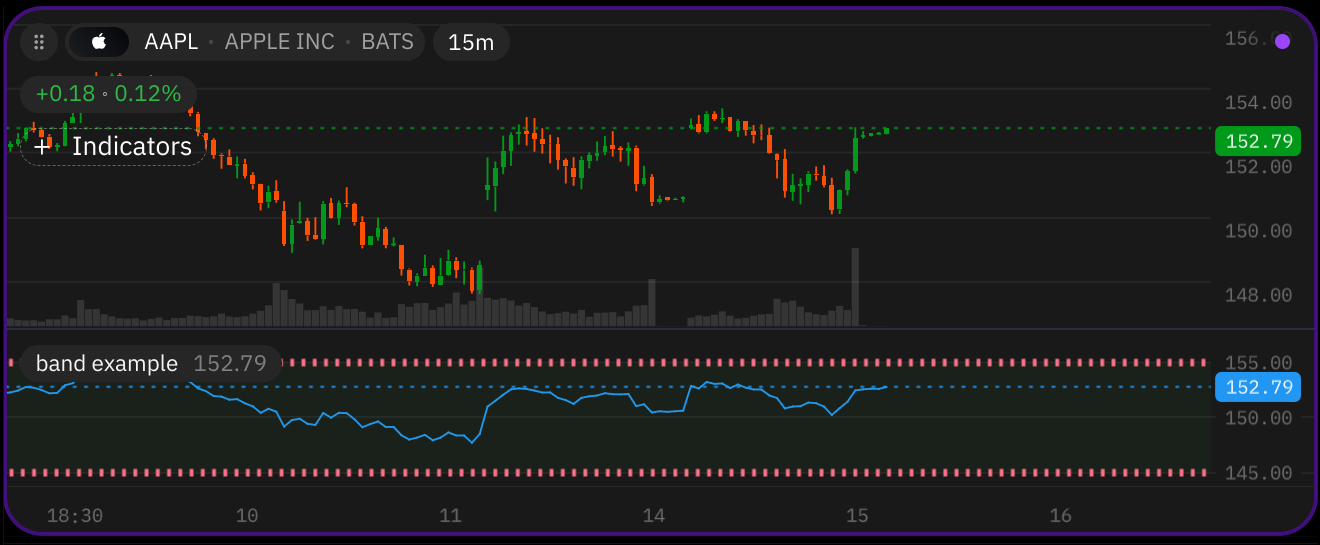
Example:
```py theme={null}
# indie:lang_version = 5
from indie import indicator, band, color
@indicator('Band example')
@band(145, 155, line_color=color.RED, line_width=4)
def Main(self):
return self.close[0]
```
## Bands
[`@band()`](/indie/Library-reference/package-indie#decor_band) decorator creates a band (two horizontal lines usually with a semi-transparent fill in between them).
```txt theme={null}
@band(
value1: float,
value2: float,
title: indie.Optional[str] = None,
fill_color: indie.Color = indie.color.GREEN(0.05),
line_color: indie.Color = indie.color.GRAY(0.5),
line_style: int = indie.line_style.DASHED,
line_width: int = 1
) -> NoneType
```
Parameters:
* `value1` — Value of the first horizontal line of a band on a vertical scale of an indicator.
* `value2` — Value of the second horizontal line of a band on a vertical scale of an indicator.
* `title` — Human-readable title which is visible in the indicator's Settings panel.
* `fill_color` — Color of the background.
* `line_color` — Color of the line.
* `line_style` — Style of the line. It is represented as enum value of type `line_style`.
* `line_width` — Width of the line.
Example:
```py theme={null}
# indie:lang_version = 5
from indie import indicator, band, color
@indicator('Band example')
@band(145, 155, line_color=color.RED, line_width=4)
def Main(self):
return self.close[0]
```