> ## Documentation Index
> Fetch the complete documentation index at: https://takeprofit.com/docs/llms.txt
> Use this file to discover all available pages before exploring further.
# Indicator Code Editor (IDE) Widget
The IDE Widget enables you to create new technical indicators or modify existing ones. It provides a complete development environment for working with indicators on the TakeProfit platform. You can also add the indicators you have developed to the Indicators Marketplace and earn commission from sales and/or purchases of referrals.
## Adding IDE Widget
Two ways to access the IDE:
* Drag from Widget Hub to your workspace
* Click the Source Code icon of any open-source indicator (automatically creates a fork).
## Creating New Indicators
### Initial Setup
1. Start with an "Unsaved Script" widget
2. Access available indicators through the dropdown menu:
* Built-in indicators
* Marketplace purchases
* Your custom indicators
3. Selecting any indicator creates a fork, indicated by a "Fork" label
4. Click the Fork label to rename your indicator.
## Key Features
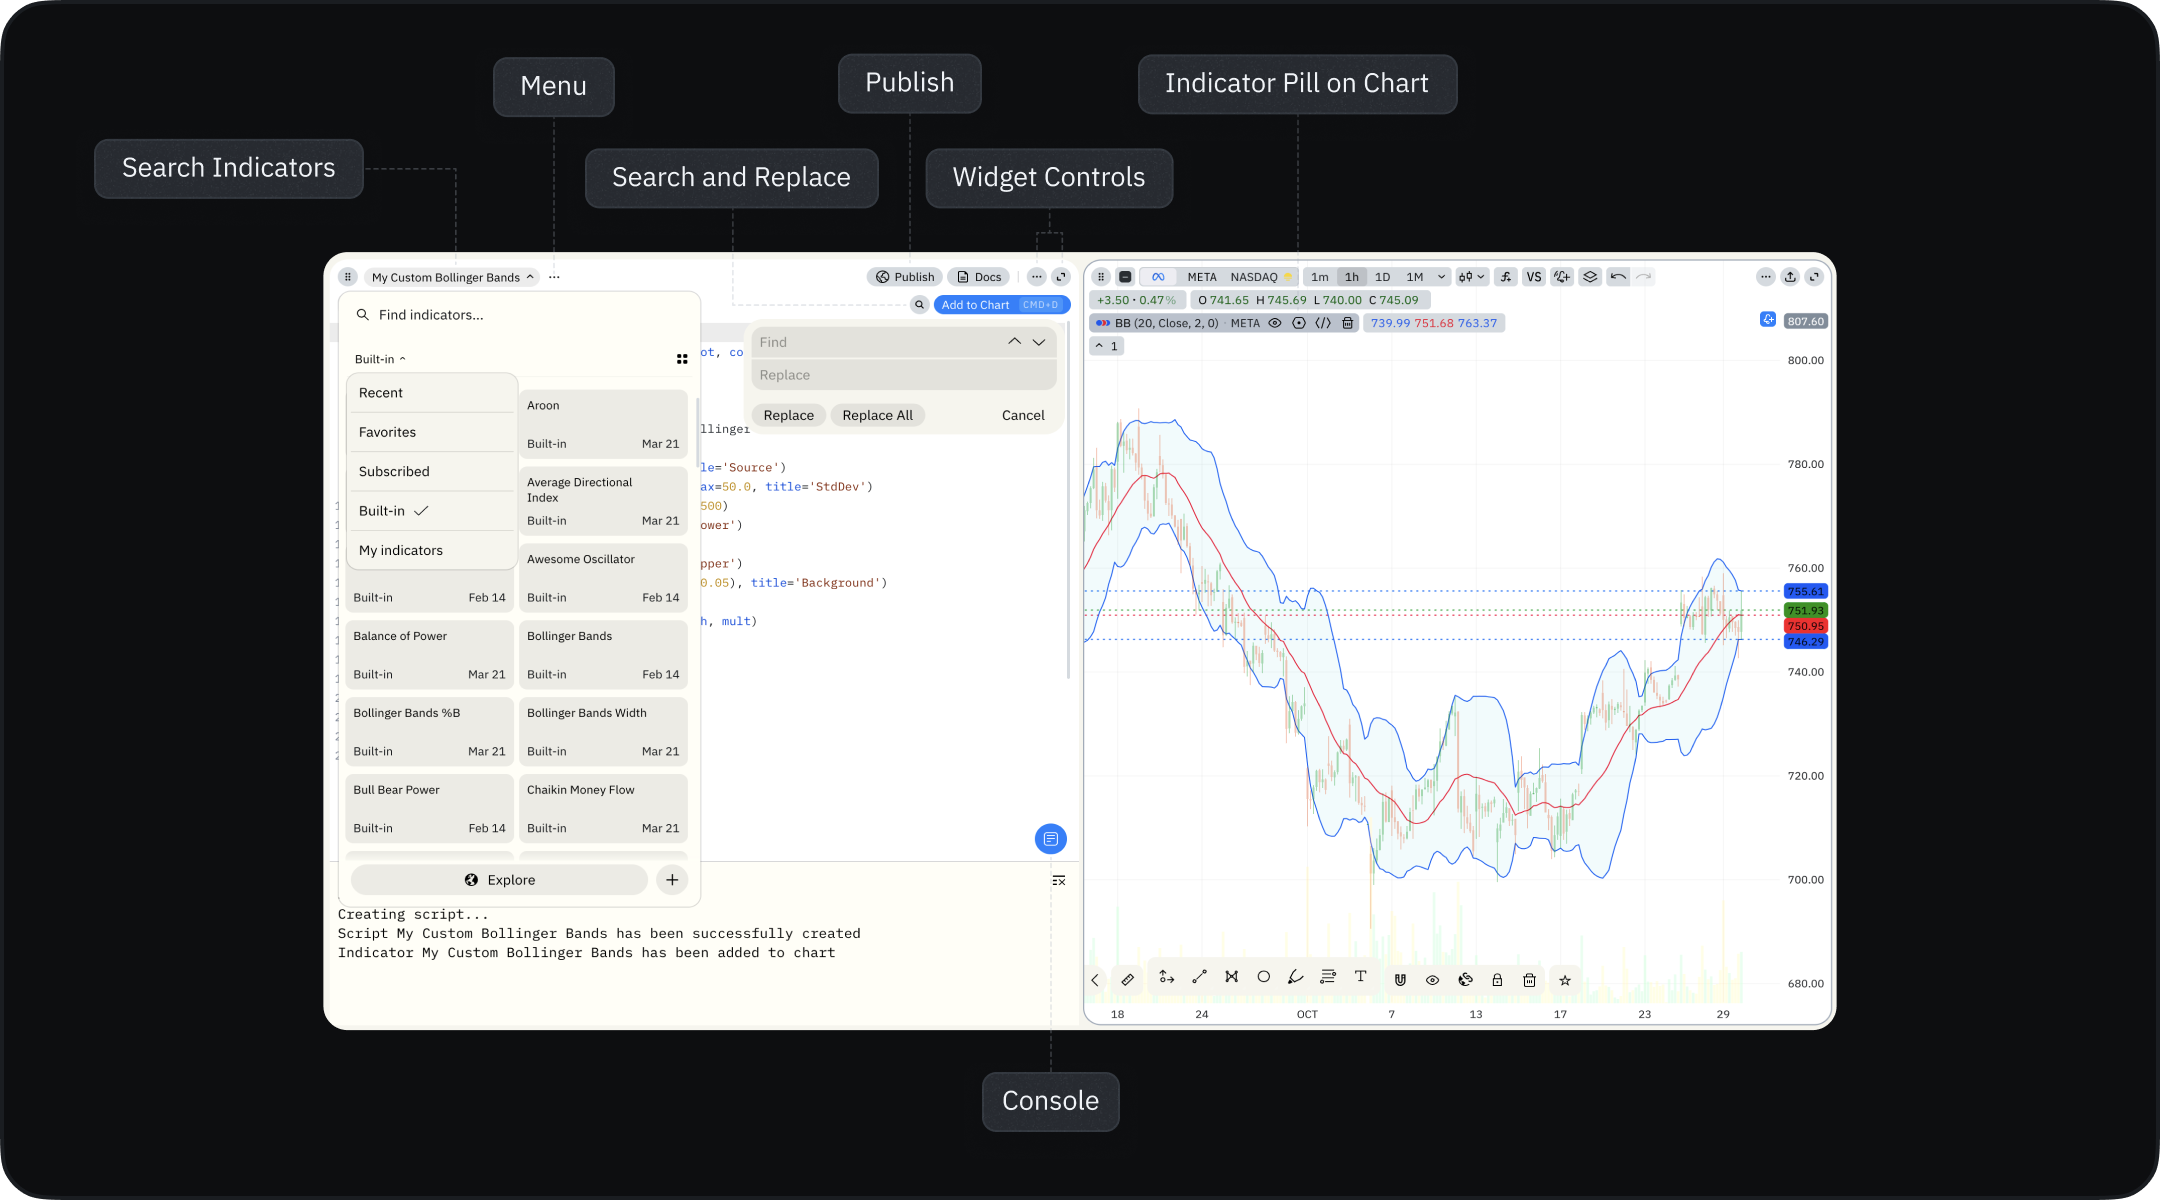 ### Top Controls
* Left side:
* Indicator name (editable)
* Three-dot menu (Fork creation, Delete indicator)
* Publish button for marketplace submission.
* Right side:
* Version history (auto-saves after each code change)
* Indie® language documentation
* Find and Replace functionality.
### Standard Widget Controls
* Delete widget
* Duplicate widget (creates renamed copy)
* Share functionality (coming soon).
### Bottom Panel
* Add to Chart button:
* Adds indicator to selected chart
* Prompts to add chart if none exists
* Console button:
* View indicator logs
* Debug error messages.
## Working with Multiple IDEs
You can work with several indicators simultaneously by opening multiple IDE widgets. This is particularly useful when:
* Developing related indicators
* Comparing different versions
* Testing multiple approaches.
### Multiple Charts Workflow
* Before adding any indicator, click on your target chart to select it
* Make sure the chart is highlighted (active)
* Use Add to Chart to apply the indicator
* Repeat for other charts as needed.
### Working with Linked Charts
Linked charts have independent indicators. Although charts can sync for symbols and timeframes, you must select each chart individually to add indicators, as each chart has its own set.
Keep your workspace organized by arranging IDE widgets near their corresponding charts for easier management.
### Top Controls
* Left side:
* Indicator name (editable)
* Three-dot menu (Fork creation, Delete indicator)
* Publish button for marketplace submission.
* Right side:
* Version history (auto-saves after each code change)
* Indie® language documentation
* Find and Replace functionality.
### Standard Widget Controls
* Delete widget
* Duplicate widget (creates renamed copy)
* Share functionality (coming soon).
### Bottom Panel
* Add to Chart button:
* Adds indicator to selected chart
* Prompts to add chart if none exists
* Console button:
* View indicator logs
* Debug error messages.
## Working with Multiple IDEs
You can work with several indicators simultaneously by opening multiple IDE widgets. This is particularly useful when:
* Developing related indicators
* Comparing different versions
* Testing multiple approaches.
### Multiple Charts Workflow
* Before adding any indicator, click on your target chart to select it
* Make sure the chart is highlighted (active)
* Use Add to Chart to apply the indicator
* Repeat for other charts as needed.
### Working with Linked Charts
Linked charts have independent indicators. Although charts can sync for symbols and timeframes, you must select each chart individually to add indicators, as each chart has its own set.
Keep your workspace organized by arranging IDE widgets near their corresponding charts for easier management.