> ## Documentation Index
> Fetch the complete documentation index at: https://takeprofit.com/docs/llms.txt
> Use this file to discover all available pages before exploring further.
# Liquidity Heatmap
> The Liquidity Heatmap chart type: resting order-book liquidity drawn behind the candles, its settings, and the instruments it is available on.
A **Liquidity Heatmap** chart draws the **order book over time** behind your candles. Price runs up the vertical axis and time along the horizontal one, and the brightness of each cell shows how much limit liquidity was resting at that price. It answers a different question from the other chart types: [Volume Footprint](/docs/guide/platform/chart-widget/chart-types/Volume-Footprint) shows what actually *traded*, [TPO](/docs/guide/platform/chart-widget/chart-types/TPO-charts) shows where the market spent its *time*, and the Liquidity Heatmap shows what was *sitting in the book* waiting to be filled. On the chart toolbar it is listed as **Heatmap** in the **Change Chart Types** menu.
## How to read it
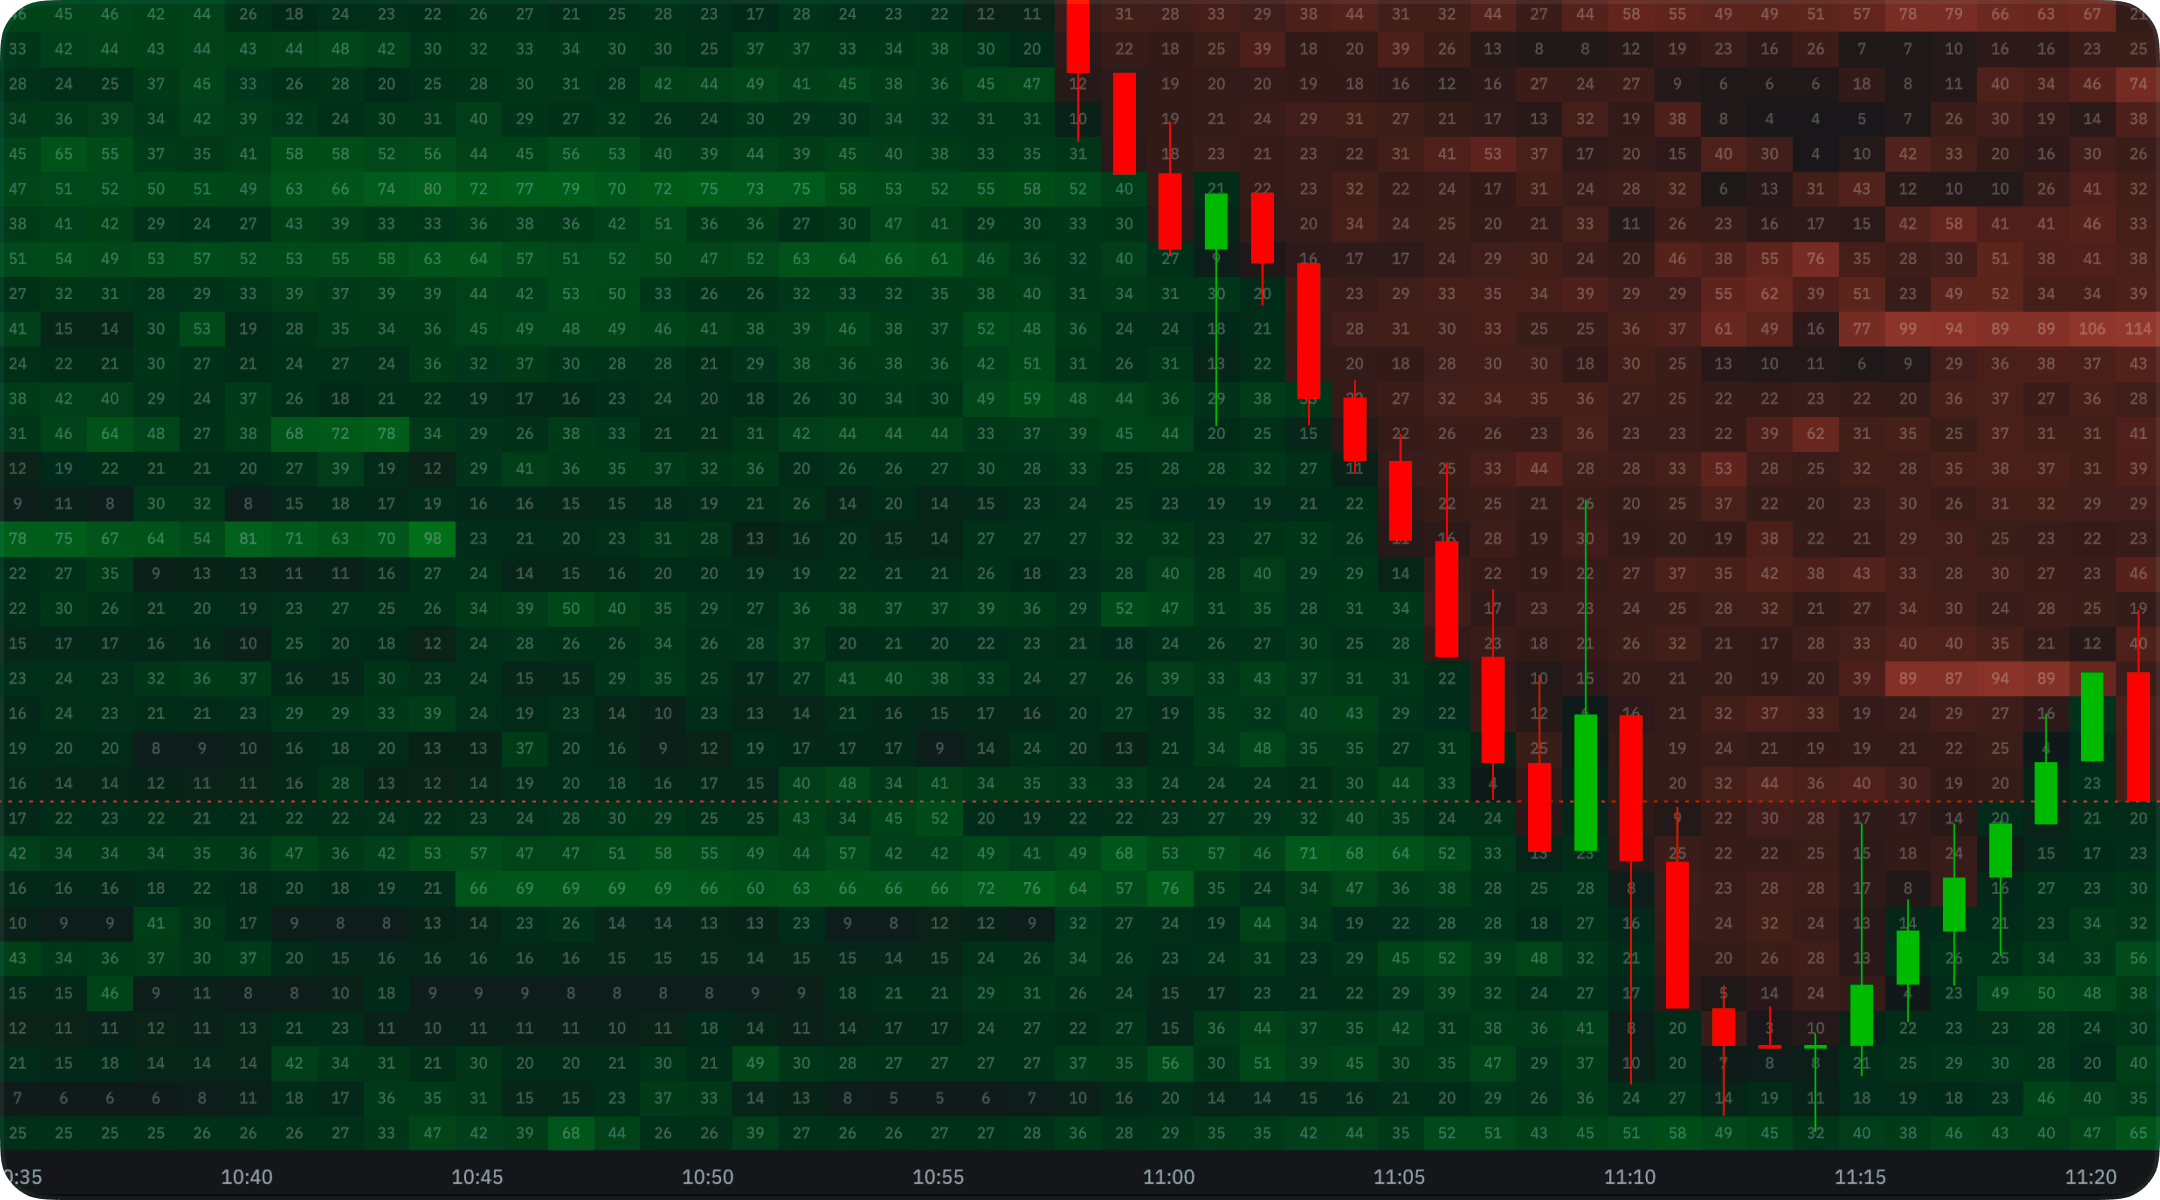 For every bar the chart takes a cross-section of the book across price. Each price row becomes a cell, and the cell's color intensity is the size resting there:
* **Bright, saturated bands** are large resting orders — liquidity walls.
* **Dark areas** are thin book, where price can move quickly.
* **Bids and asks have their own gradients**, so on the default scheme the green zones below price are buyers' limit orders and the red zones above it are sellers'. The exact colors follow your settings.
The value of the picture is in what happens when price reaches a bright level: the orders either hold, get pulled, or get filled — and each of those tells you something different about the level.
## Heatmap and footprint together
The heatmap cells are drawn *under* the candles, and the footprint overlay can be stacked on top of them — it is **on by default**. One view then carries three things at once: resting liquidity in the background, volume traded at each price, and the candle itself.
## Settings
Open **Chart Settings** (the three dots in the top-right corner of the chart → **Settings**) and use the **Appearance** group:
| Setting | What it does |
| ------------------- | --------------------------------------------------------------------------------------------------------------------------------------------------------------------------------------------------------------------------------------------------------------------------------- |
| **Liquidity Value** | Which size a cell is drawn from. **Time-Weighted** (default) makes brightness track how long a level actually held; **Maximum** uses the peak size, which is the one to pick when you are looking for spoofing; **Closing Size** uses what was still there at the end of the bar. |
| **Row Size** | The price height of one cell. `0` lets the server pick a grid suited to the instrument. |
| **Opacity** | How strongly the whole heatmap layer is drawn behind the price. |
| **Values** | Per-cell volume labels. They size themselves to the cells and disappear when the cells get too small to hold them. |
| **Heatmap Colors** | A two-stop gradient per side — low and high for bids, low and high for asks. Resettable to the defaults. |
| **Volume Range** | A dual log-scale slider setting the volumes the gradient runs between. It defaults to auto, where the top of the range is the 95th percentile of per-bar maxima, so one giant wall does not wash out everything else on the chart. |
| **Footprint** | Turns the footprint overlay on top of the cells on or off. |
## Data and timeframes
Heatmap data is streamed from the order-book history service: history loads for the range you are looking at, pages in as you scroll back, and updates live as new buckets close. The bucket period follows the chart's timeframe.
Because a bucket has to cover a meaningful slice of the book, **second and tick timeframes are not available** on a heatmap chart. Switching a chart that is on one of them to Heatmap moves it to the lowest supported timeframe automatically.
## Supported instruments
A heatmap needs recorded order-book data, so it is offered only on the instruments that data is collected for — **21 instruments across Bybit and Binance, 42 markets in total**: BTC, ETH, SOL and XRP perpetuals alongside gold, silver, oil and single-stock perps. On every other instrument the chart type is hidden; if you arrive on one with a heatmap already applied, the chart falls back to Candles and tells you that **heatmaps aren't supported for this ticker**.
### Perpetual futures
| Instrument | Bybit | Binance Futures |
| ---------------- | ----- | --------------- |
| `BTC/USDT.P` | Yes | Yes |
| `ETH/USDT.P` | Yes | Yes |
| `SNDK/USDT.P` | Yes | Yes |
| `SKHYNIX/USDT.P` | Yes | Yes |
| `SOL/USDT.P` | Yes | Yes |
| `BANK/USDT.P` | Yes | Yes |
| `HYPE/USDT.P` | Yes | Yes |
| `BZ/USDT.P` | Yes | Yes |
| `EWY/USDT.P` | Yes | Yes |
| `ZEC/USDT.P` | Yes | Yes |
| `COTI/USDT.P` | Yes | Yes |
| `SAMSUNG/USDT.P` | Yes | Yes |
| `BTC/USDC.P` | Yes | Yes |
| `MU/USDT.P` | Yes | Yes |
| `ETH/USDC.P` | Yes | Yes |
| `XAU/USDT.P` | Yes | Yes |
| `CL/USDT.P` | Yes | Yes |
| `XAG/USDT.P` | Yes | Yes |
| `XRP/USDT.P` | Yes | Yes |
### Spot
| Instrument | Bybit Spot | Binance |
| ---------- | ---------- | ------- |
| `ETH/USDT` | Yes | Yes |
| `BTC/USDC` | Yes | Yes |
Need an instrument that is not on the list? Ask in [Discord](https://discord.gg/WVk8TjwU7p) or at [support@takeprofit.com](mailto:support@takeprofit.com) — coverage grows with demand.
See also: [Chart Types](/docs/guide/platform/chart-widget/Chart-types) for the full list of chart types and how to switch between them.
For every bar the chart takes a cross-section of the book across price. Each price row becomes a cell, and the cell's color intensity is the size resting there:
* **Bright, saturated bands** are large resting orders — liquidity walls.
* **Dark areas** are thin book, where price can move quickly.
* **Bids and asks have their own gradients**, so on the default scheme the green zones below price are buyers' limit orders and the red zones above it are sellers'. The exact colors follow your settings.
The value of the picture is in what happens when price reaches a bright level: the orders either hold, get pulled, or get filled — and each of those tells you something different about the level.
## Heatmap and footprint together
The heatmap cells are drawn *under* the candles, and the footprint overlay can be stacked on top of them — it is **on by default**. One view then carries three things at once: resting liquidity in the background, volume traded at each price, and the candle itself.
## Settings
Open **Chart Settings** (the three dots in the top-right corner of the chart → **Settings**) and use the **Appearance** group:
| Setting | What it does |
| ------------------- | --------------------------------------------------------------------------------------------------------------------------------------------------------------------------------------------------------------------------------------------------------------------------------- |
| **Liquidity Value** | Which size a cell is drawn from. **Time-Weighted** (default) makes brightness track how long a level actually held; **Maximum** uses the peak size, which is the one to pick when you are looking for spoofing; **Closing Size** uses what was still there at the end of the bar. |
| **Row Size** | The price height of one cell. `0` lets the server pick a grid suited to the instrument. |
| **Opacity** | How strongly the whole heatmap layer is drawn behind the price. |
| **Values** | Per-cell volume labels. They size themselves to the cells and disappear when the cells get too small to hold them. |
| **Heatmap Colors** | A two-stop gradient per side — low and high for bids, low and high for asks. Resettable to the defaults. |
| **Volume Range** | A dual log-scale slider setting the volumes the gradient runs between. It defaults to auto, where the top of the range is the 95th percentile of per-bar maxima, so one giant wall does not wash out everything else on the chart. |
| **Footprint** | Turns the footprint overlay on top of the cells on or off. |
## Data and timeframes
Heatmap data is streamed from the order-book history service: history loads for the range you are looking at, pages in as you scroll back, and updates live as new buckets close. The bucket period follows the chart's timeframe.
Because a bucket has to cover a meaningful slice of the book, **second and tick timeframes are not available** on a heatmap chart. Switching a chart that is on one of them to Heatmap moves it to the lowest supported timeframe automatically.
## Supported instruments
A heatmap needs recorded order-book data, so it is offered only on the instruments that data is collected for — **21 instruments across Bybit and Binance, 42 markets in total**: BTC, ETH, SOL and XRP perpetuals alongside gold, silver, oil and single-stock perps. On every other instrument the chart type is hidden; if you arrive on one with a heatmap already applied, the chart falls back to Candles and tells you that **heatmaps aren't supported for this ticker**.
### Perpetual futures
| Instrument | Bybit | Binance Futures |
| ---------------- | ----- | --------------- |
| `BTC/USDT.P` | Yes | Yes |
| `ETH/USDT.P` | Yes | Yes |
| `SNDK/USDT.P` | Yes | Yes |
| `SKHYNIX/USDT.P` | Yes | Yes |
| `SOL/USDT.P` | Yes | Yes |
| `BANK/USDT.P` | Yes | Yes |
| `HYPE/USDT.P` | Yes | Yes |
| `BZ/USDT.P` | Yes | Yes |
| `EWY/USDT.P` | Yes | Yes |
| `ZEC/USDT.P` | Yes | Yes |
| `COTI/USDT.P` | Yes | Yes |
| `SAMSUNG/USDT.P` | Yes | Yes |
| `BTC/USDC.P` | Yes | Yes |
| `MU/USDT.P` | Yes | Yes |
| `ETH/USDC.P` | Yes | Yes |
| `XAU/USDT.P` | Yes | Yes |
| `CL/USDT.P` | Yes | Yes |
| `XAG/USDT.P` | Yes | Yes |
| `XRP/USDT.P` | Yes | Yes |
### Spot
| Instrument | Bybit Spot | Binance |
| ---------- | ---------- | ------- |
| `ETH/USDT` | Yes | Yes |
| `BTC/USDC` | Yes | Yes |
Need an instrument that is not on the list? Ask in [Discord](https://discord.gg/WVk8TjwU7p) or at [support@takeprofit.com](mailto:support@takeprofit.com) — coverage grows with demand.
See also: [Chart Types](/docs/guide/platform/chart-widget/Chart-types) for the full list of chart types and how to switch between them.