> ## Documentation Index
> Fetch the complete documentation index at: https://takeprofit.com/docs/llms.txt
> Use this file to discover all available pages before exploring further.
# Pattern Tools
## XABCD Pattern
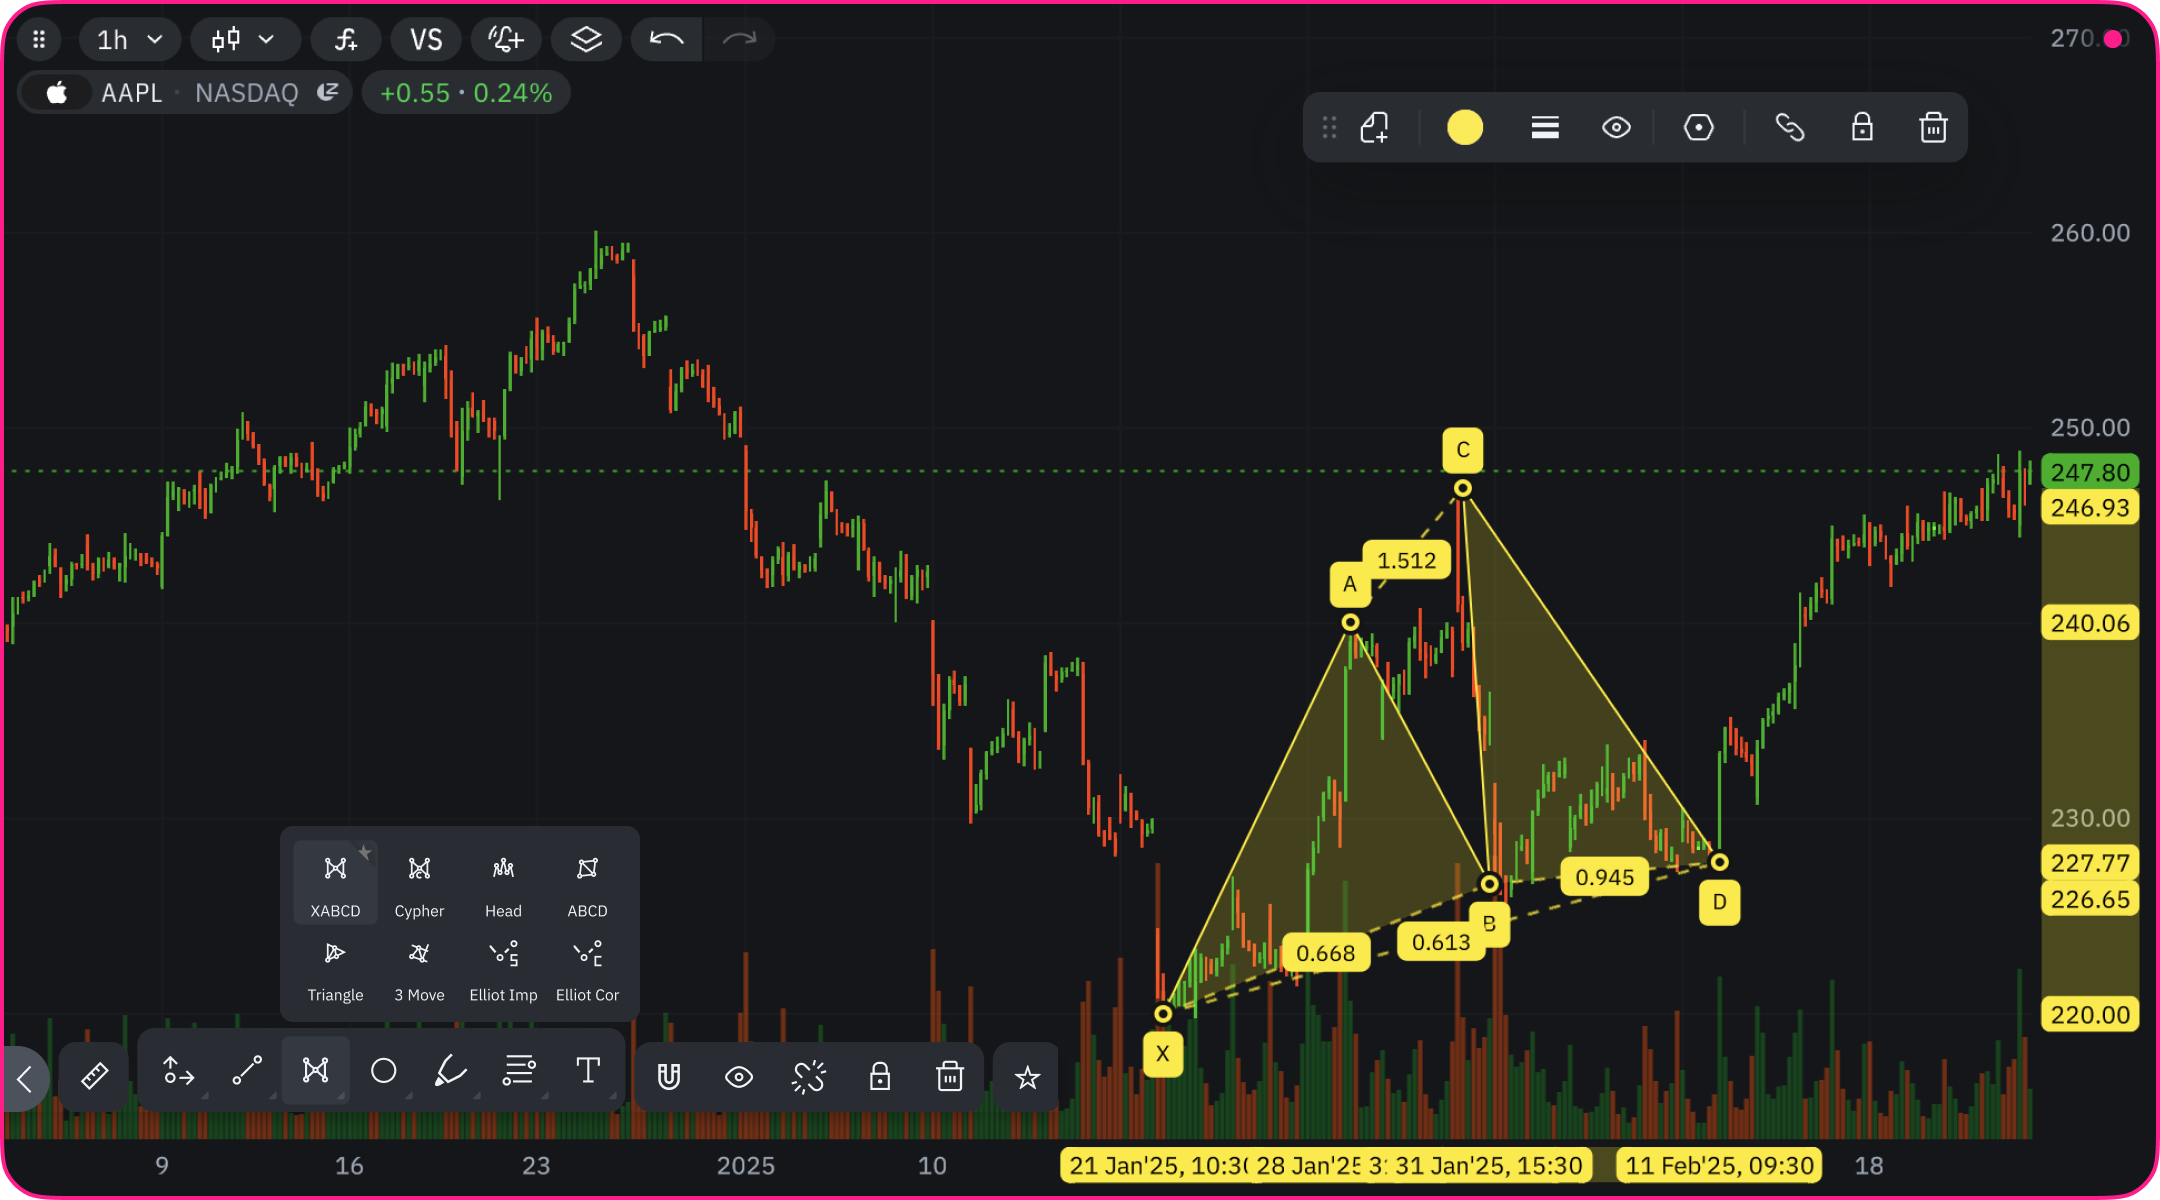 A powerful tool for harmonic pattern analysis:
* **Basic Structure:**
* Five control points (X, A, B, C, D)
* Four connecting legs (XA, AB, BC, CD)
* Each point represents significant price high or low
* Adjacent legs move in opposite directions
* **Identified Patterns:**
Four major harmonic patterns with bullish or bearish variations:
* Gartley
* Butterfly
* Crab
* Bat
* **Usage:**
* Manually position five points at key swing highs/lows
* Adjust points to match specific pattern requirements
* Analyze potential reversal zones
* Identify potential price targets
* **Customization:**
* Adjust point positions
* Change line properties
* Modify pattern colors
## Cypher Pattern
A powerful tool for harmonic pattern analysis:
* **Basic Structure:**
* Five control points (X, A, B, C, D)
* Four connecting legs (XA, AB, BC, CD)
* Each point represents significant price high or low
* Adjacent legs move in opposite directions
* **Identified Patterns:**
Four major harmonic patterns with bullish or bearish variations:
* Gartley
* Butterfly
* Crab
* Bat
* **Usage:**
* Manually position five points at key swing highs/lows
* Adjust points to match specific pattern requirements
* Analyze potential reversal zones
* Identify potential price targets
* **Customization:**
* Adjust point positions
* Change line properties
* Modify pattern colors
## Cypher Pattern
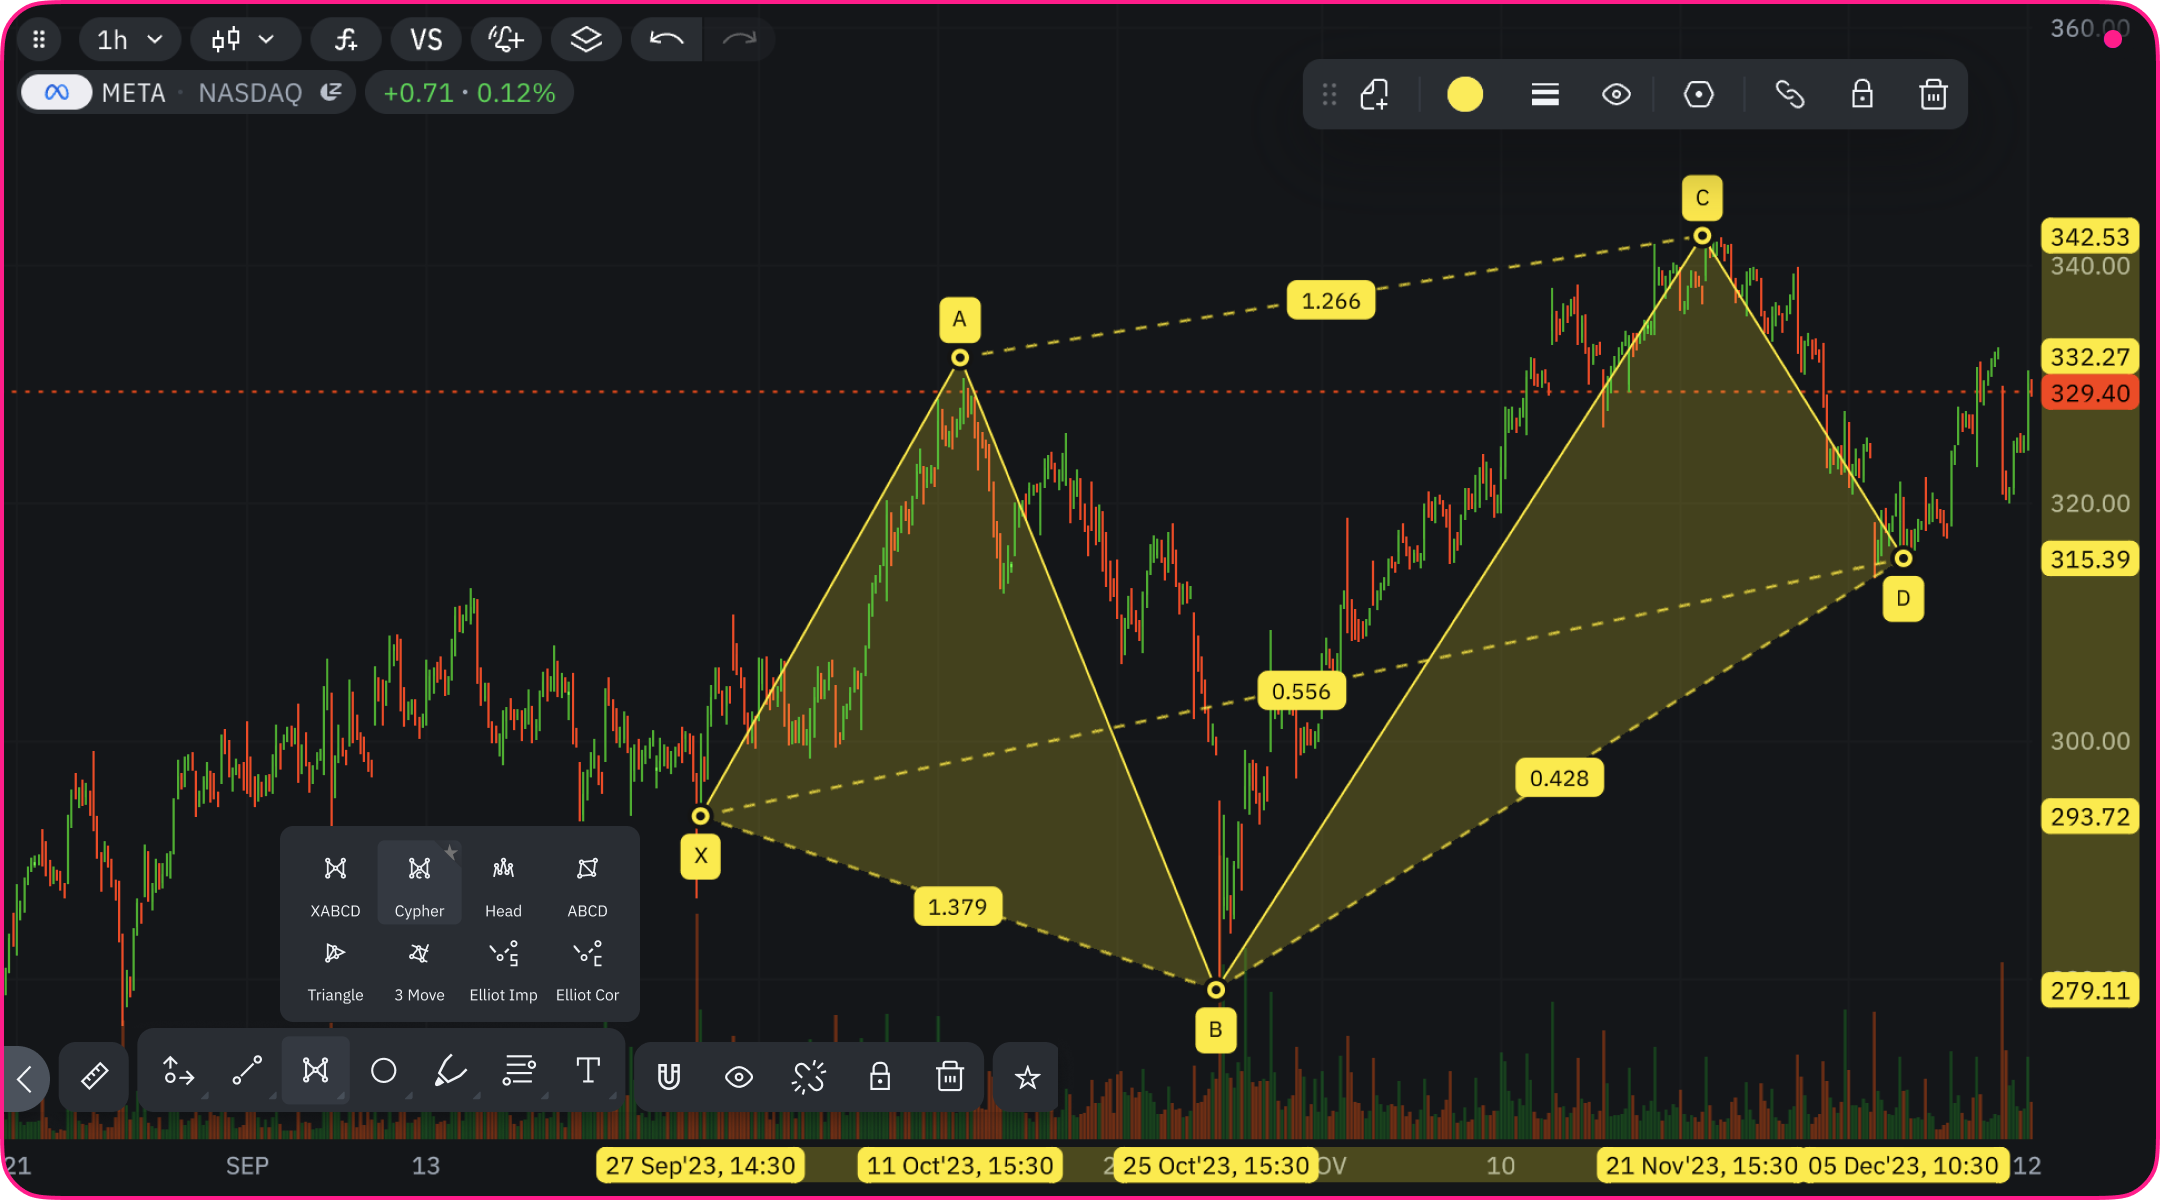 A precise harmonic pattern for identifying high-probability reversal points:
* **Origin:** Developed by Darren Oglesbee
* **Structure:** Five key points (X, A, B, C, D) forming four legs
* **Key Feature:** Highly accurate Potential Reversal Zone (PRZ)
### Pattern Structure
* **XA leg:** Initial price movement
* **AB leg:** First correction after XA move
* **BC leg:** Price movement following the correction
* **CD leg:** Final move to the reversal point D
* **PRZ (Potential Reversal Zone):** Located in XD region with Fibonacci ratio 0.786-0.886
### Pattern Variations
* **Bullish Cypher:**
* Forms an M-shaped pattern
* Indicates upcoming uptrend after correction
* Entry point at D for long positions
* **Bearish Cypher:**
* Forms a W-shaped pattern
* Signals beginning of downtrend after temporary rise
* Entry point at D for short positions
### Identification Tips
* Use Fibonacci tools to confirm ratio relationships
* Look for precise geometric formations
* Confirm with additional indicators at point D
* Watch for reversal candlestick patterns at PRZ
## Head and Shoulders Pattern
A precise harmonic pattern for identifying high-probability reversal points:
* **Origin:** Developed by Darren Oglesbee
* **Structure:** Five key points (X, A, B, C, D) forming four legs
* **Key Feature:** Highly accurate Potential Reversal Zone (PRZ)
### Pattern Structure
* **XA leg:** Initial price movement
* **AB leg:** First correction after XA move
* **BC leg:** Price movement following the correction
* **CD leg:** Final move to the reversal point D
* **PRZ (Potential Reversal Zone):** Located in XD region with Fibonacci ratio 0.786-0.886
### Pattern Variations
* **Bullish Cypher:**
* Forms an M-shaped pattern
* Indicates upcoming uptrend after correction
* Entry point at D for long positions
* **Bearish Cypher:**
* Forms a W-shaped pattern
* Signals beginning of downtrend after temporary rise
* Entry point at D for short positions
### Identification Tips
* Use Fibonacci tools to confirm ratio relationships
* Look for precise geometric formations
* Confirm with additional indicators at point D
* Watch for reversal candlestick patterns at PRZ
## Head and Shoulders Pattern
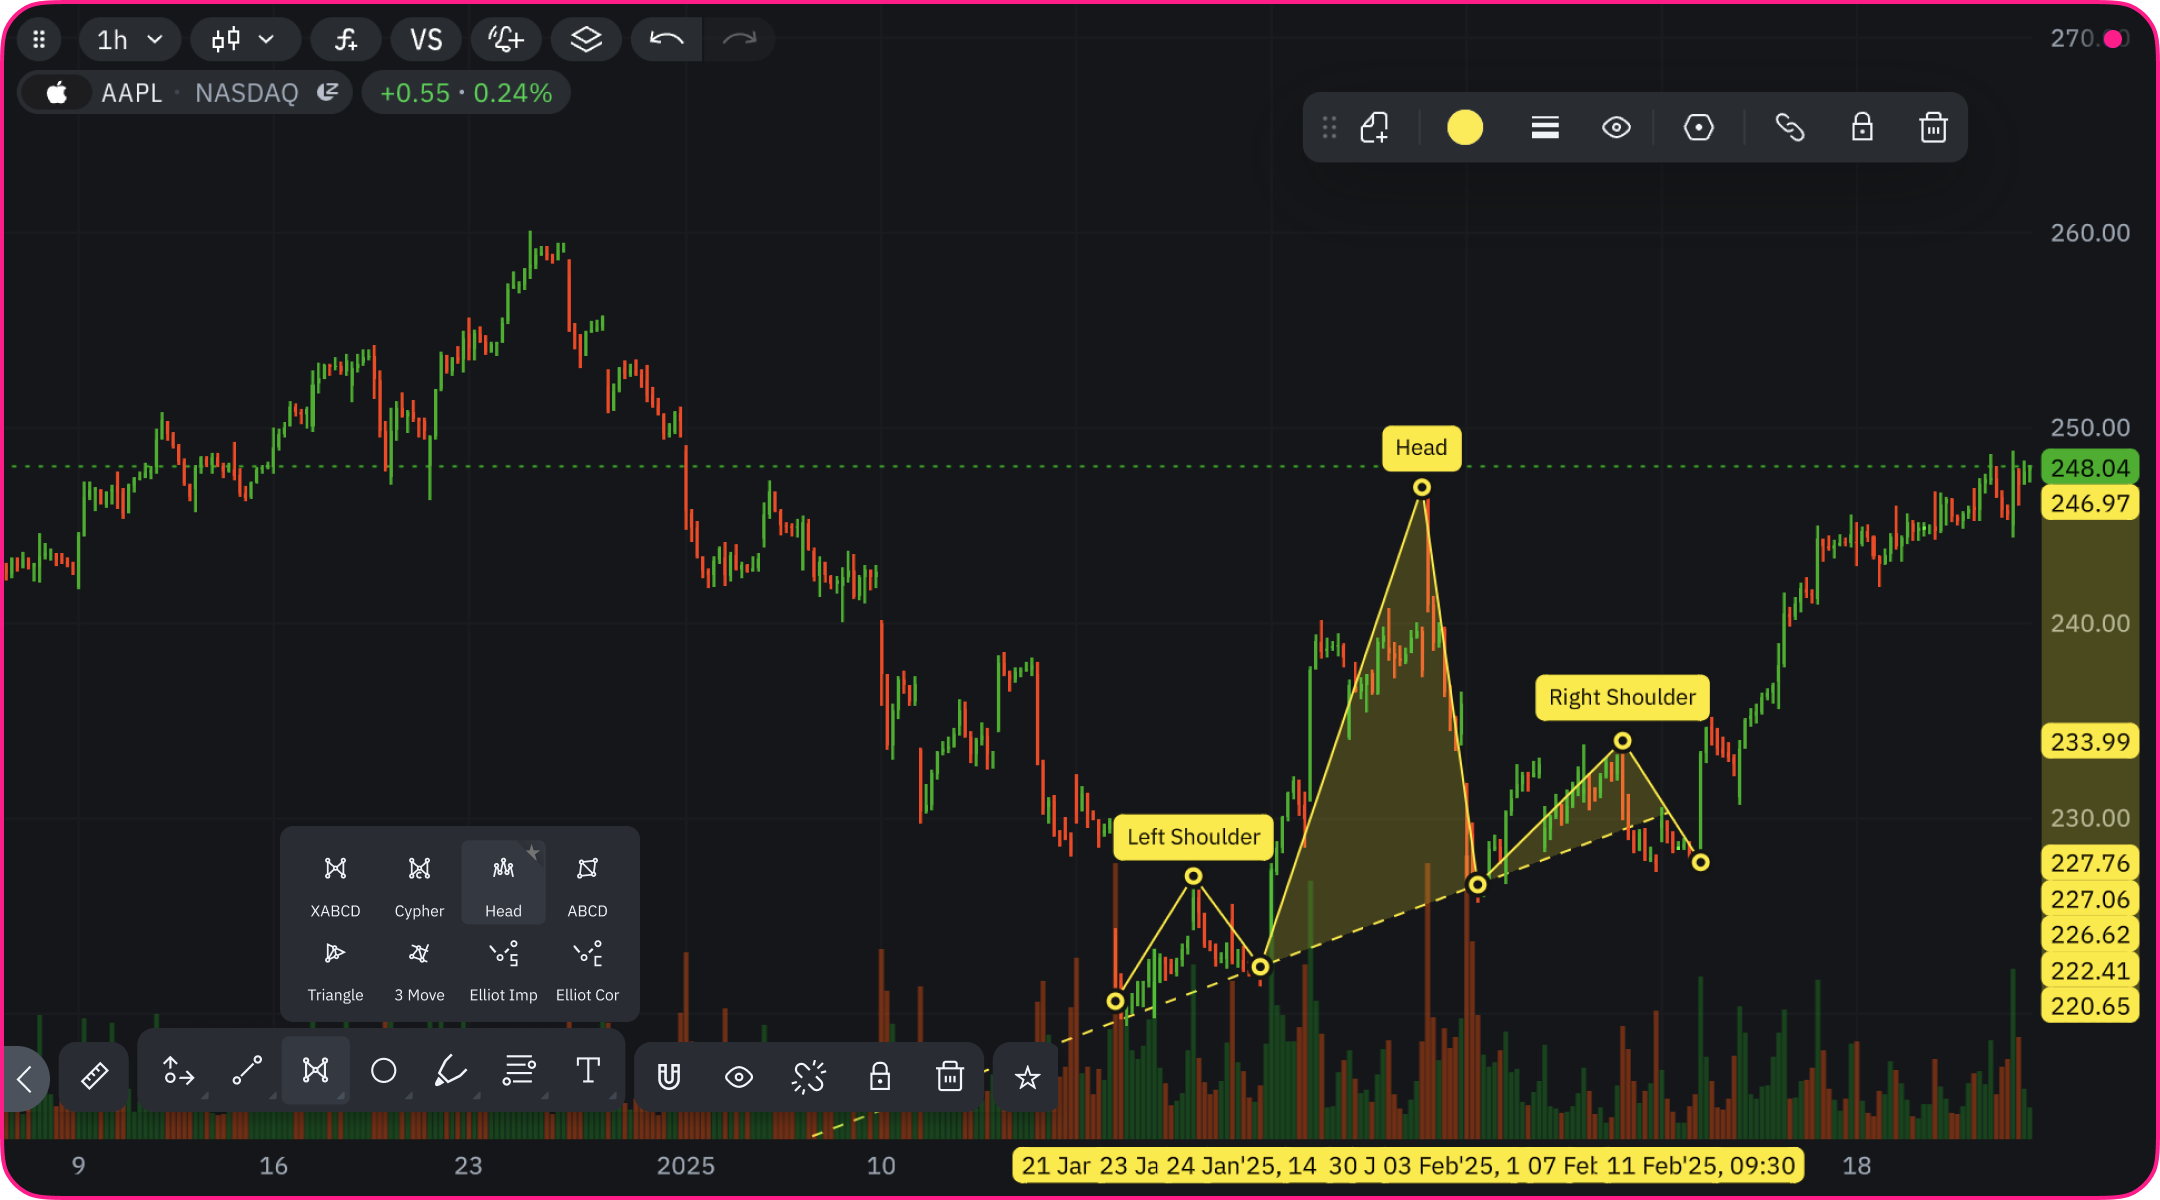 A classic reversal pattern signaling trend change:
**Structure:** Three distinct components with connecting neckline
* Left shoulder
* Head (central peak/trough)
* Right shoulder
* Neckline (horizontal support/resistance)
**Pattern Variations:**
* **Bearish Head and Shoulders:**
* Forms at market tops
* Signals upcoming downtrend
* Head higher than both shoulders
* **Bullish Head and Shoulders (Inverse):**
* Forms at market bottoms
* Signals upcoming uptrend
* Head lower than both shoulders
**Key Formation Elements:**
1. **Previous Trend:** Must form after established trend
2. **Left Shoulder:** Initial peak/trough with high volume
3. **Head:** Higher peak (or lower trough) than shoulders
4. **Right Shoulder:** Similar height to left shoulder
5. **Neckline:** Connecting line of support/resistance
6. **Volume:** Typically decreases throughout formation
**Confirmation:**
* Price breaks neckline after right shoulder
* Bearish: Break below neckline
* Bullish: Break above neckline
* Often accompanied by volume increase
## ABCD Pattern
A classic reversal pattern signaling trend change:
**Structure:** Three distinct components with connecting neckline
* Left shoulder
* Head (central peak/trough)
* Right shoulder
* Neckline (horizontal support/resistance)
**Pattern Variations:**
* **Bearish Head and Shoulders:**
* Forms at market tops
* Signals upcoming downtrend
* Head higher than both shoulders
* **Bullish Head and Shoulders (Inverse):**
* Forms at market bottoms
* Signals upcoming uptrend
* Head lower than both shoulders
**Key Formation Elements:**
1. **Previous Trend:** Must form after established trend
2. **Left Shoulder:** Initial peak/trough with high volume
3. **Head:** Higher peak (or lower trough) than shoulders
4. **Right Shoulder:** Similar height to left shoulder
5. **Neckline:** Connecting line of support/resistance
6. **Volume:** Typically decreases throughout formation
**Confirmation:**
* Price breaks neckline after right shoulder
* Bearish: Break below neckline
* Bullish: Break above neckline
* Often accompanied by volume increase
## ABCD Pattern
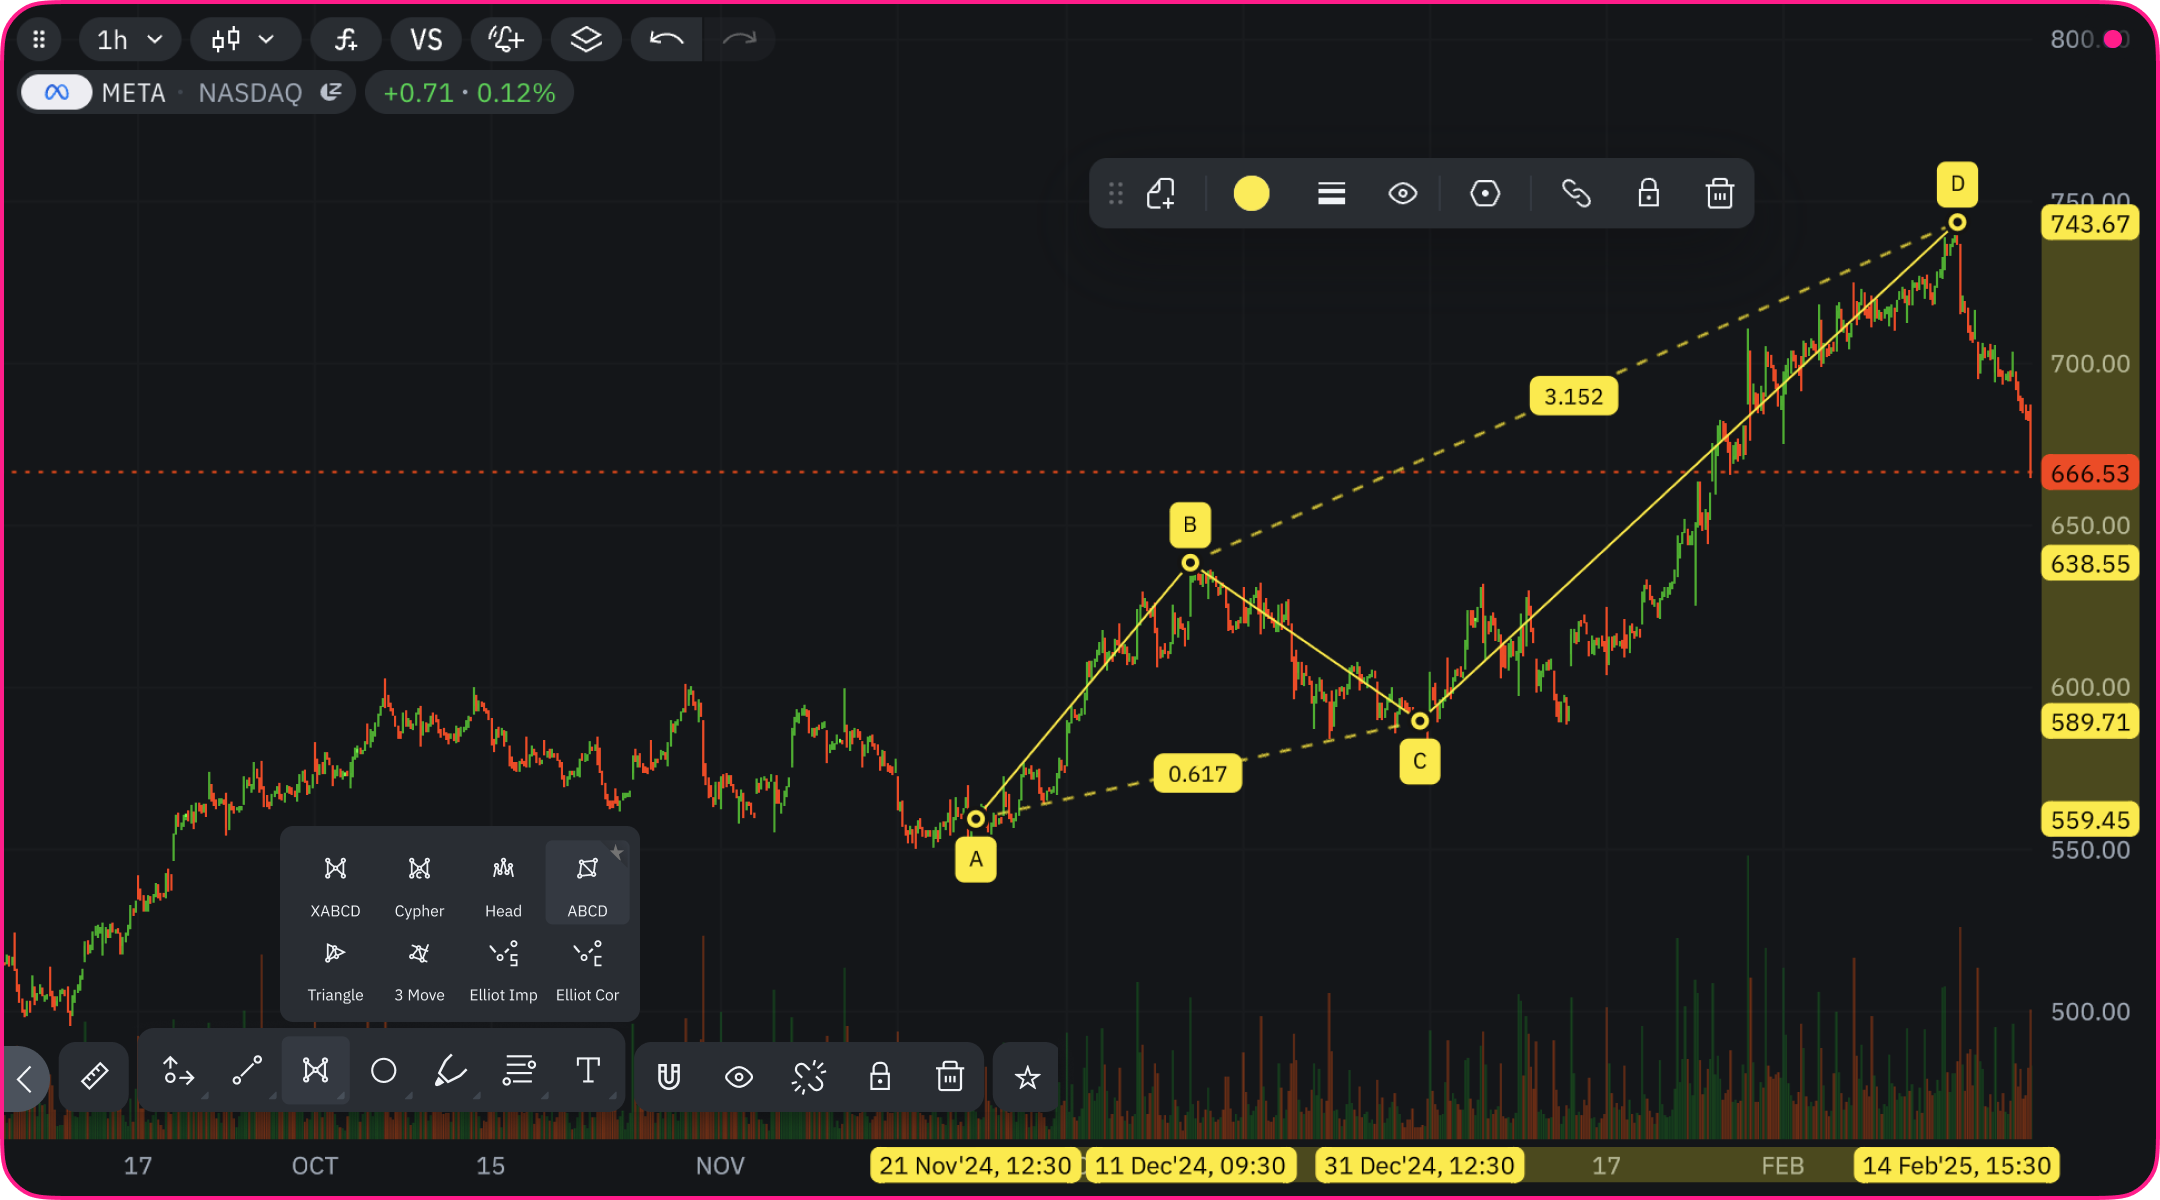 A versatile four-point pattern for identifying potential reversal zones:
**Basic Structure:**
* Four control points (A, B, C, D)
* Three connecting legs (AB, BC, CD)
* Adjacent legs move in opposite directions
* Points mark significant highs and lows
**Pattern Formation:**
* First leg (AB): Initial price movement
* Second leg (BC): Retracement of first move
* Third leg (CD): Final move to completion point
* These three legs combine to create recognizable price structures that signal potential reversals
**Major Pattern Variations:**
1. **AB=CD Pattern:**
* Distance of AB approximately equals CD
* Time duration of AB similar to CD
* Creates symmetrical price movements
* Signals potential reversal at point D
2. **Classic ABCD:**
* CD leg extends 127.2% or 161.8% of BC leg
* Uses key Fibonacci extension levels
* Often forms in trending markets
3. **ABCD Extension:**
* CD leg extends 127.2% or 161.8% of AB leg
* Focuses on relationship between first and last legs
* Potentially stronger reversal signals
**Understanding Ratio Display:**
The number shown between B\&D represents the ratio of the CD leg relative to the BC distance. For example, when you see "127.9%" on the pattern, it means point D extends beyond point B by 27.9% of the BC distance. This corresponds to the 1.279 Fibonacci extension level (100% + 27.9%).
**Fibonacci Percentages:**
The values 127.2% and 161.8% are Fibonacci extension levels derived from mathematical relationships found throughout nature and markets. These specific ratios help determine the likely extension of the CD leg based on previous price movements.
**Learn More:** For detailed trading strategies and practical examples of the ABCD pattern, check out our comprehensive guide at [Harmonic Pattern ABCD Education](https://takeprofit.com/posts/harmonic-pattern-abcd-education-english-52?via=mustermann84).
## Triangle Pattern
A versatile four-point pattern for identifying potential reversal zones:
**Basic Structure:**
* Four control points (A, B, C, D)
* Three connecting legs (AB, BC, CD)
* Adjacent legs move in opposite directions
* Points mark significant highs and lows
**Pattern Formation:**
* First leg (AB): Initial price movement
* Second leg (BC): Retracement of first move
* Third leg (CD): Final move to completion point
* These three legs combine to create recognizable price structures that signal potential reversals
**Major Pattern Variations:**
1. **AB=CD Pattern:**
* Distance of AB approximately equals CD
* Time duration of AB similar to CD
* Creates symmetrical price movements
* Signals potential reversal at point D
2. **Classic ABCD:**
* CD leg extends 127.2% or 161.8% of BC leg
* Uses key Fibonacci extension levels
* Often forms in trending markets
3. **ABCD Extension:**
* CD leg extends 127.2% or 161.8% of AB leg
* Focuses on relationship between first and last legs
* Potentially stronger reversal signals
**Understanding Ratio Display:**
The number shown between B\&D represents the ratio of the CD leg relative to the BC distance. For example, when you see "127.9%" on the pattern, it means point D extends beyond point B by 27.9% of the BC distance. This corresponds to the 1.279 Fibonacci extension level (100% + 27.9%).
**Fibonacci Percentages:**
The values 127.2% and 161.8% are Fibonacci extension levels derived from mathematical relationships found throughout nature and markets. These specific ratios help determine the likely extension of the CD leg based on previous price movements.
**Learn More:** For detailed trading strategies and practical examples of the ABCD pattern, check out our comprehensive guide at [Harmonic Pattern ABCD Education](https://takeprofit.com/posts/harmonic-pattern-abcd-education-english-52?via=mustermann84).
## Triangle Pattern
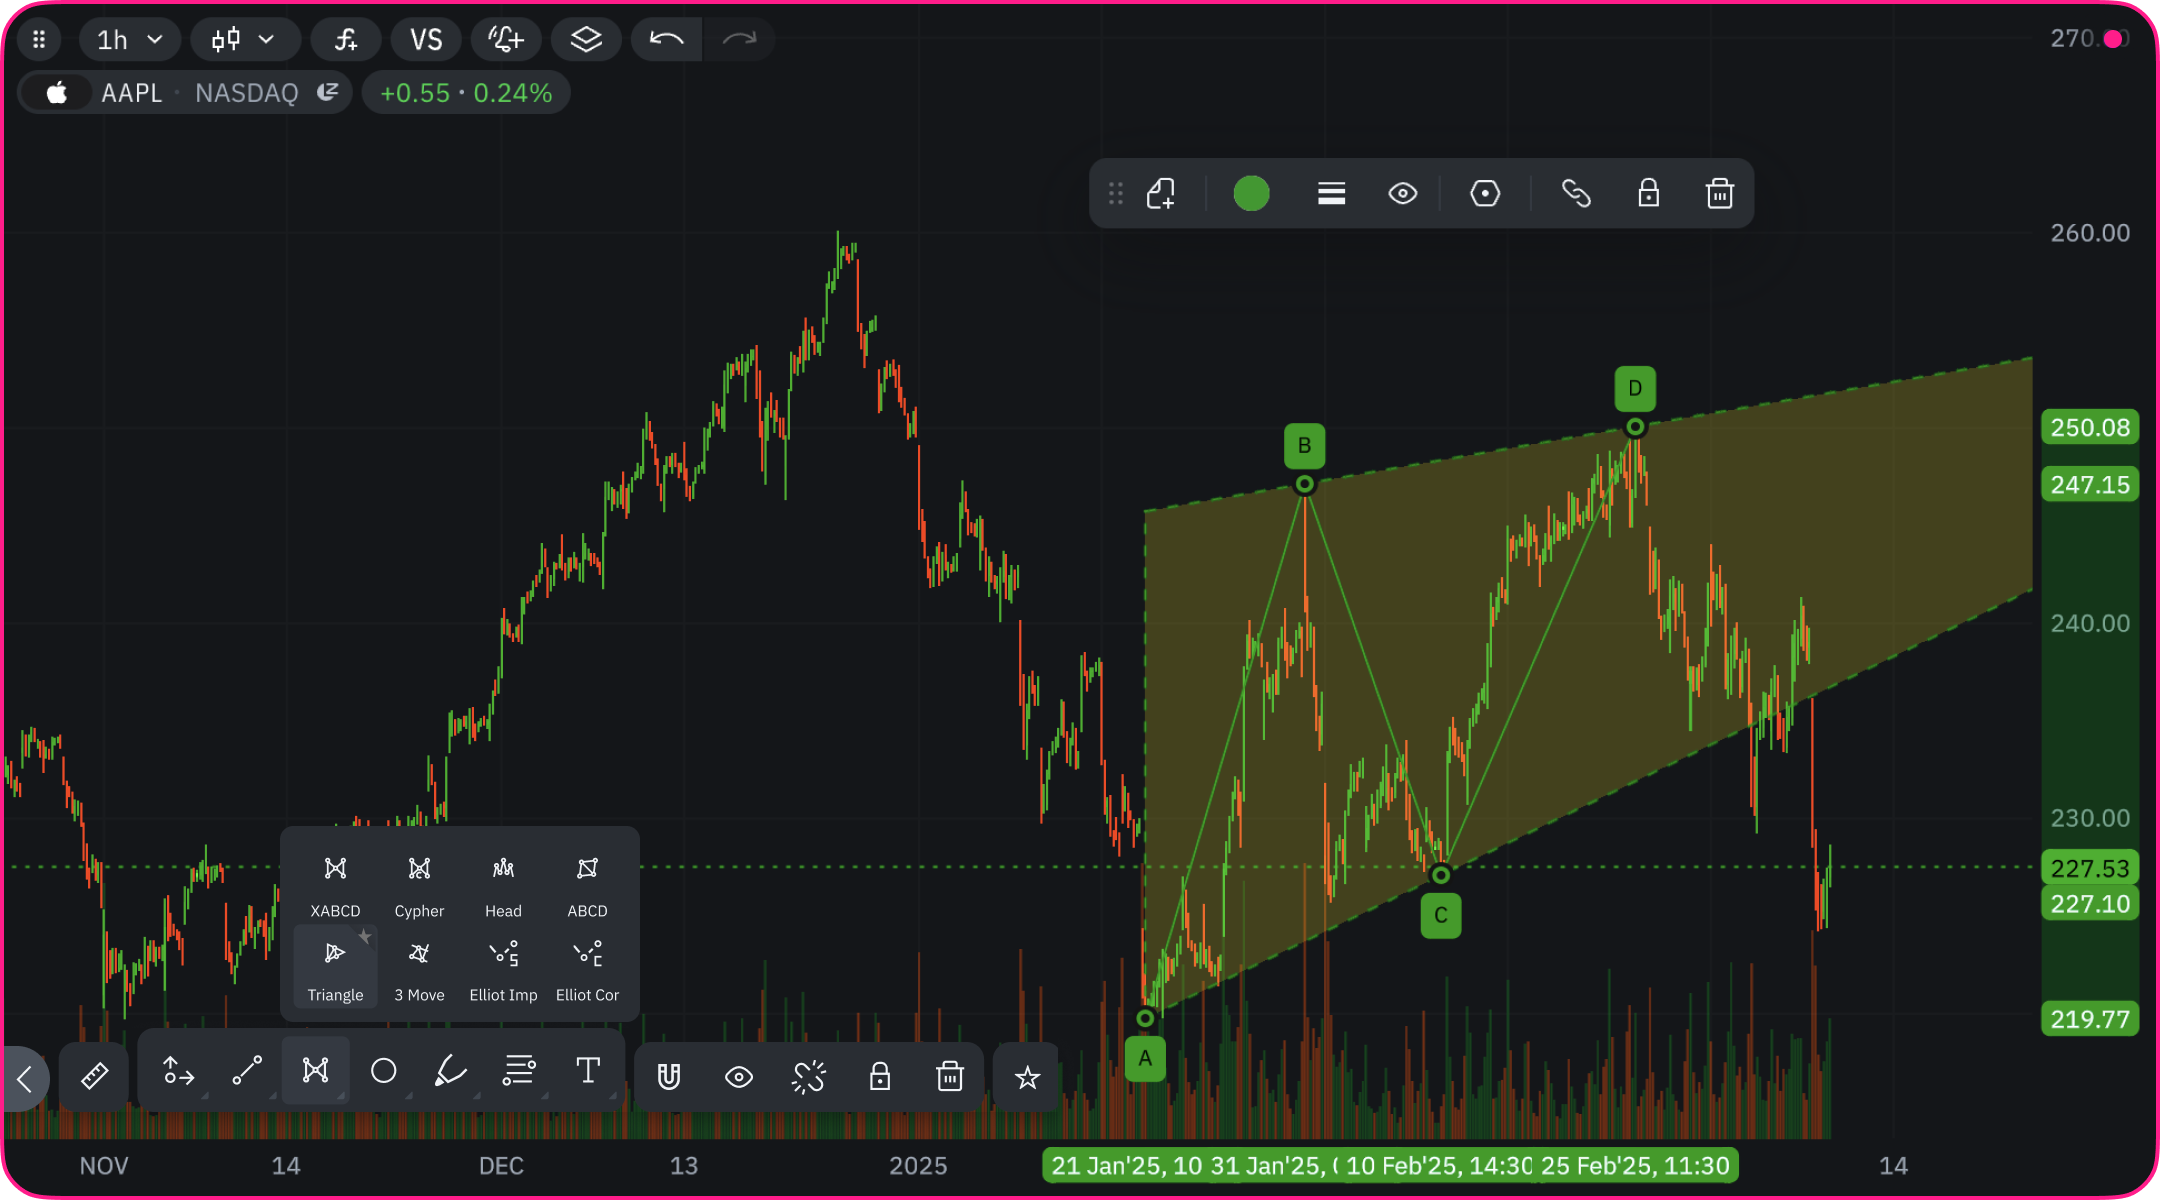 A powerful consolidation pattern indicating potential breakout opportunities:
* **Basic Structure:**
* Four control points (A, B, C, D)
* Points placed on alternating highs and lows
* A and C on consecutive highs (or lows)
* B and D on consecutive lows (or highs)
* Creates converging trendlines
* **Triangle Variations:**
1. **Symmetrical Triangle:**
* Support and resistance lines converge with similar slopes
* Both lines move toward a central apex
* Generally considered a continuation pattern
* Expected breakout in direction of previous trend
* Unexpected breakout direction signals potential trend reversal
2. **Ascending Triangle:**
* AC line forms flat resistance
* BD line forms ascending support
* Bullish pattern suggesting upward pressure
* Expected breakout above resistance line
* False breakouts possible below support line
3. **Descending Triangle:**
* BD line forms flat support
* AC line forms descending resistance
* Bearish pattern suggesting downward pressure
* Expected breakout below support line
* False breakouts possible above resistance line
## Three Drive Pattern
A powerful consolidation pattern indicating potential breakout opportunities:
* **Basic Structure:**
* Four control points (A, B, C, D)
* Points placed on alternating highs and lows
* A and C on consecutive highs (or lows)
* B and D on consecutive lows (or highs)
* Creates converging trendlines
* **Triangle Variations:**
1. **Symmetrical Triangle:**
* Support and resistance lines converge with similar slopes
* Both lines move toward a central apex
* Generally considered a continuation pattern
* Expected breakout in direction of previous trend
* Unexpected breakout direction signals potential trend reversal
2. **Ascending Triangle:**
* AC line forms flat resistance
* BD line forms ascending support
* Bullish pattern suggesting upward pressure
* Expected breakout above resistance line
* False breakouts possible below support line
3. **Descending Triangle:**
* BD line forms flat support
* AC line forms descending resistance
* Bearish pattern suggesting downward pressure
* Expected breakout below support line
* False breakouts possible above resistance line
## Three Drive Pattern
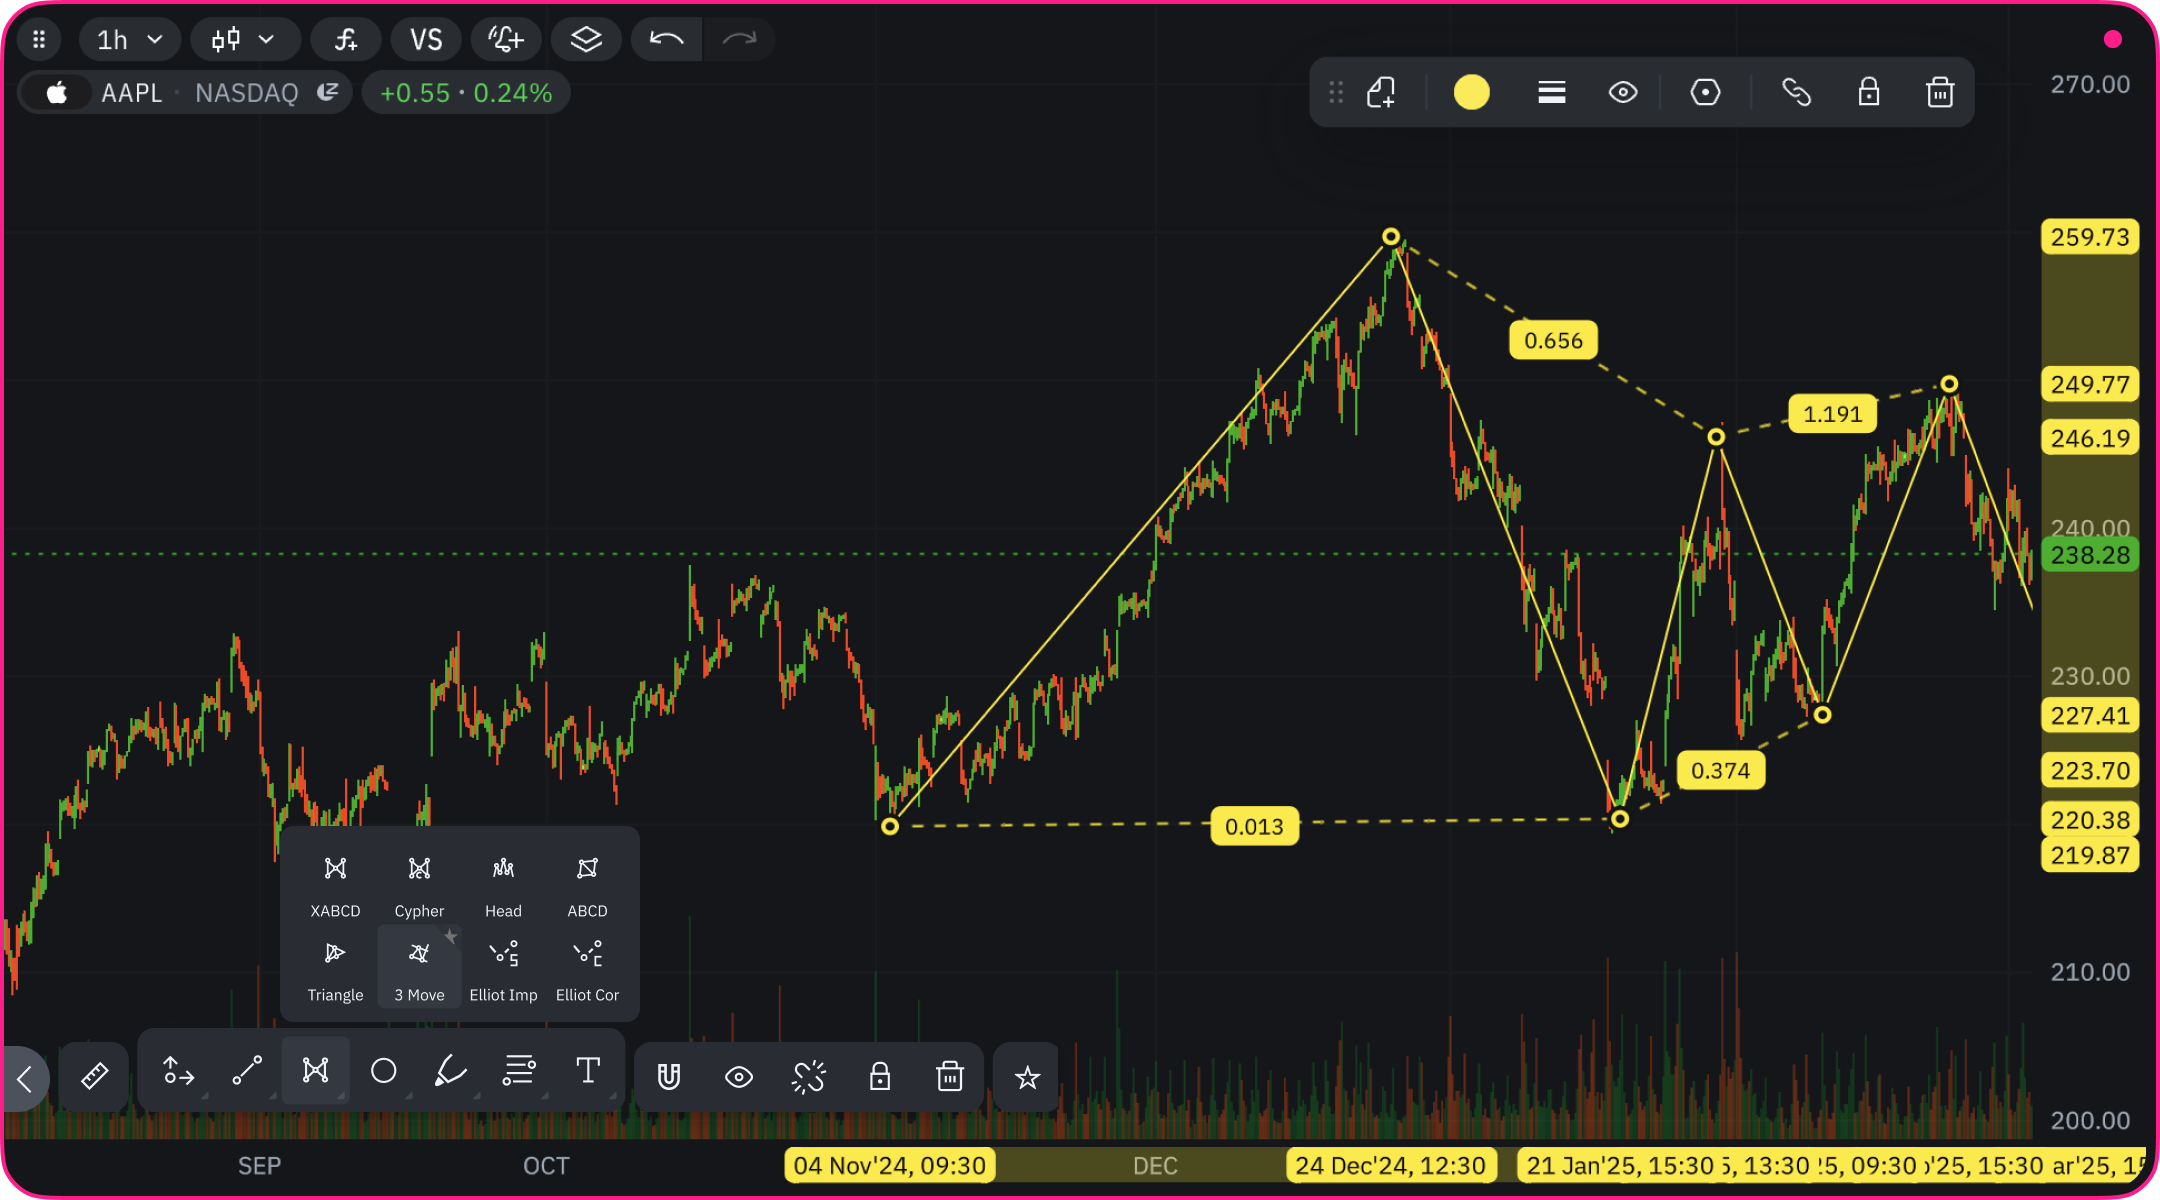 A precise reversal pattern requiring symmetry in both price and time:
* **Basic Structure:**
* Five key points creating three drives and two retracements
* Three drive points (1, 2, 3) following the trend direction
* Two retracement points (A, C) moving counter to the trend
* Complete pattern signals potential trend reversal
* **Pattern Requirements:**
* **Symmetry:** Both price movements and time duration must be proportional
* **Extensions:** Drives 2 and 3 should extend 127.2% or 161.8% of retracements A and C
* **Retracements:** Points A and C typically retrace 61.8% or 78.6% of previous drives
* In strong trends, may only retrace 38.2% or 50%
* **Time Symmetry:** Horizontal distance between points should be approximately equal
* **Pattern Variations:**
* **Bullish Three Drives:**
* Drives move downward with trend
* Final drive signals potential upward reversal
* **Bearish Three Drives:**
* Drives move upward with trend
* Final drive signals potential downward reversal
## Elliott Impulse and Elliott Correction
A systematic approach to market cycles based on Ralph Nelson Elliott's wave theory:
* **Basic Concept:**
* Markets move in predictable, repeating wave patterns driven by human psychology
* The fundamental pattern consists of 8 waves (5 impulse waves followed by 3 corrective waves)
* These patterns appear at all scales, from minute-by-minute charts to multi-year trends
* Elliott discovered that larger waves contain smaller waves with the same structure (fractal nature)
* **Wave Classifications:**
* **Elliott Impulse (Motive Waves):**
A precise reversal pattern requiring symmetry in both price and time:
* **Basic Structure:**
* Five key points creating three drives and two retracements
* Three drive points (1, 2, 3) following the trend direction
* Two retracement points (A, C) moving counter to the trend
* Complete pattern signals potential trend reversal
* **Pattern Requirements:**
* **Symmetry:** Both price movements and time duration must be proportional
* **Extensions:** Drives 2 and 3 should extend 127.2% or 161.8% of retracements A and C
* **Retracements:** Points A and C typically retrace 61.8% or 78.6% of previous drives
* In strong trends, may only retrace 38.2% or 50%
* **Time Symmetry:** Horizontal distance between points should be approximately equal
* **Pattern Variations:**
* **Bullish Three Drives:**
* Drives move downward with trend
* Final drive signals potential upward reversal
* **Bearish Three Drives:**
* Drives move upward with trend
* Final drive signals potential downward reversal
## Elliott Impulse and Elliott Correction
A systematic approach to market cycles based on Ralph Nelson Elliott's wave theory:
* **Basic Concept:**
* Markets move in predictable, repeating wave patterns driven by human psychology
* The fundamental pattern consists of 8 waves (5 impulse waves followed by 3 corrective waves)
* These patterns appear at all scales, from minute-by-minute charts to multi-year trends
* Elliott discovered that larger waves contain smaller waves with the same structure (fractal nature)
* **Wave Classifications:**
* **Elliott Impulse (Motive Waves):**
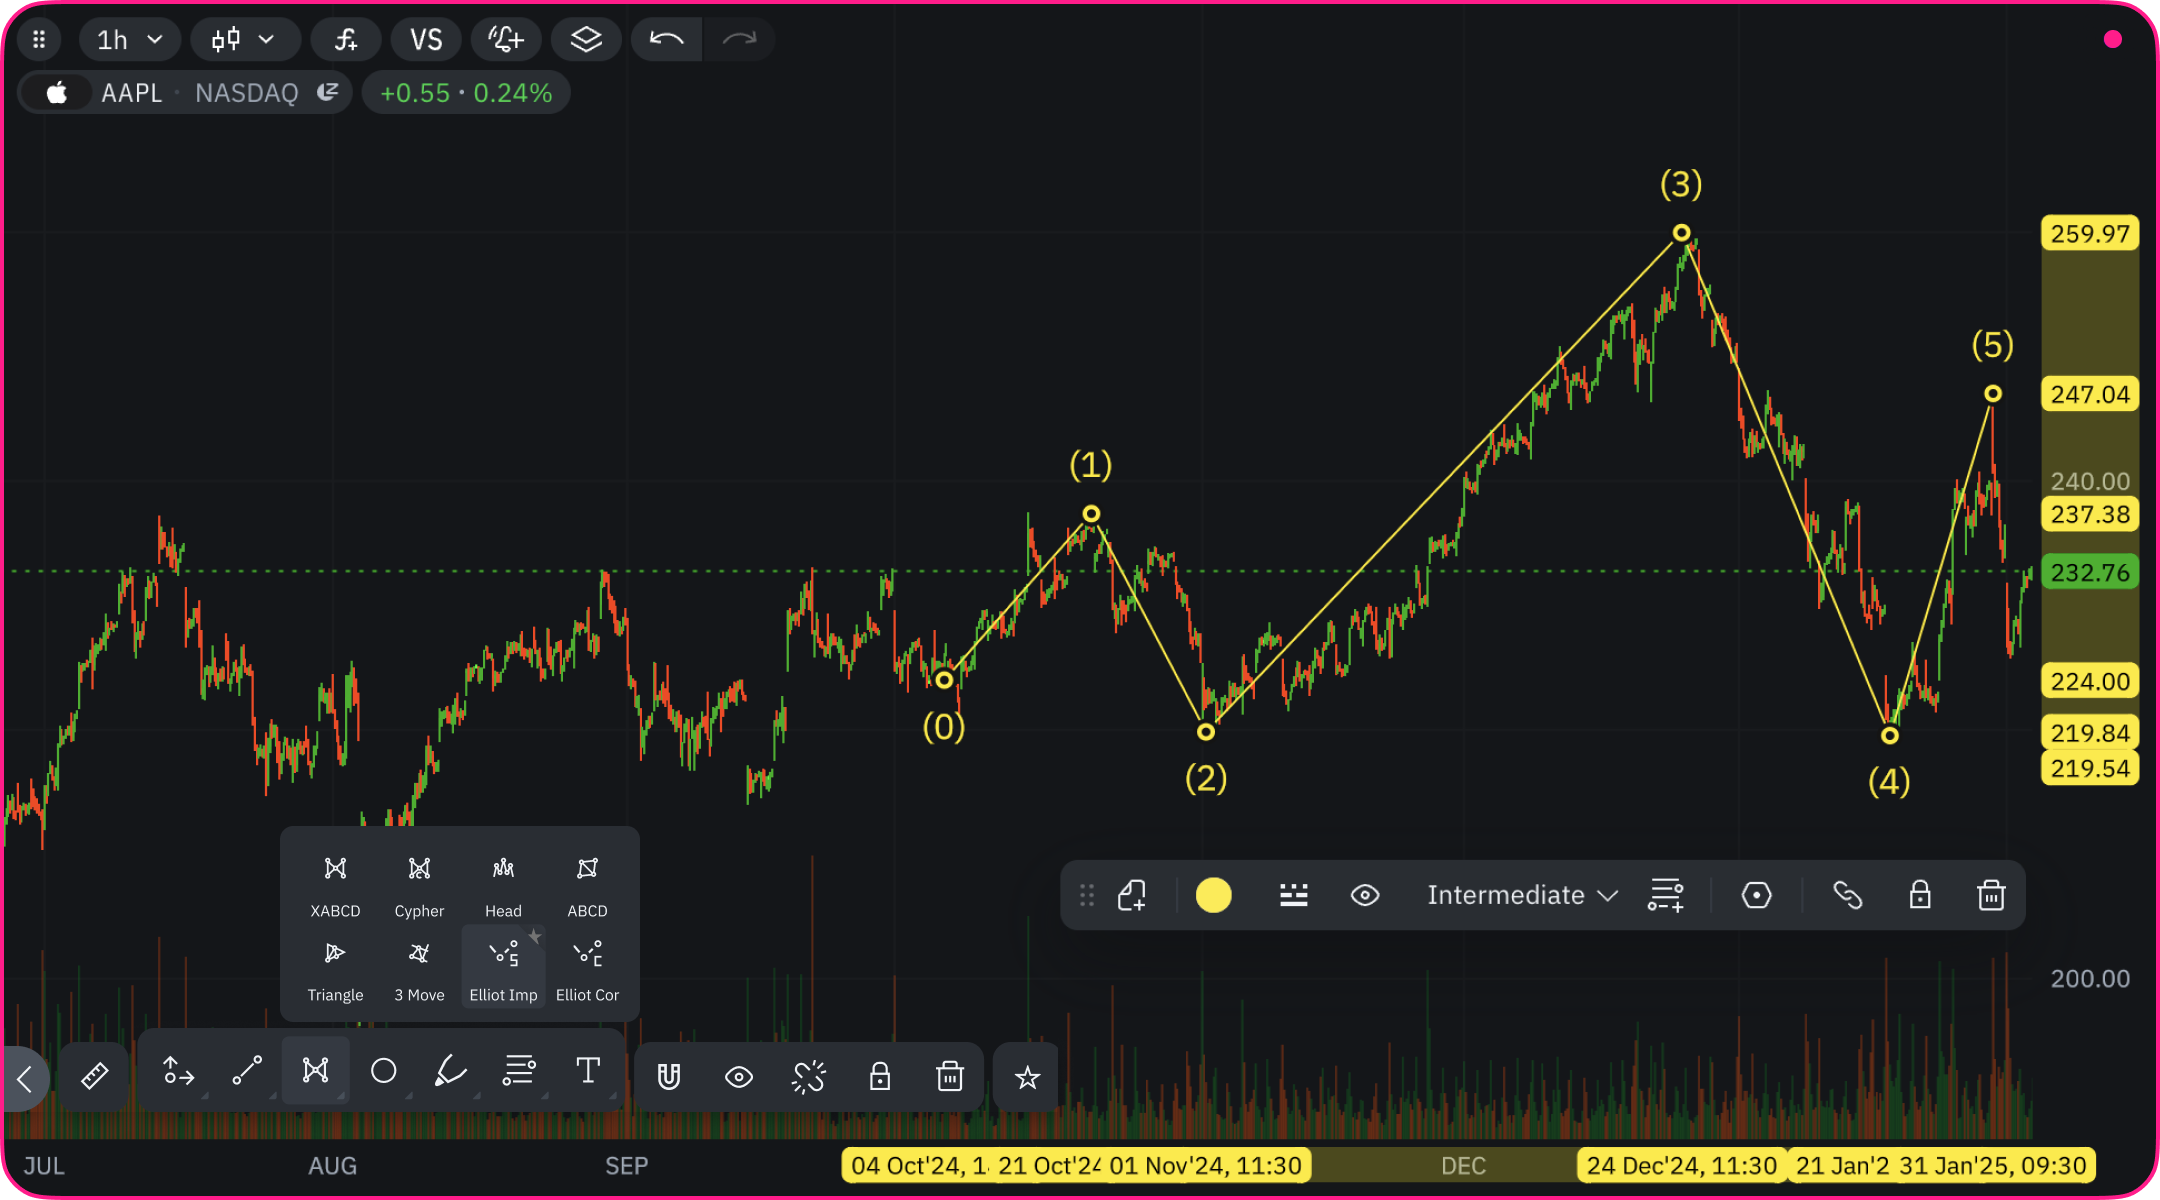 * Move in the direction of the main trend
* Consist of five distinct waves labeled 1-2-3-4-5
* Generally stronger and longer than corrective waves
* Create the primary movement in the market
* **Elliott Correction (Corrective Waves):**
* Move in the direction of the main trend
* Consist of five distinct waves labeled 1-2-3-4-5
* Generally stronger and longer than corrective waves
* Create the primary movement in the market
* **Elliott Correction (Corrective Waves):**
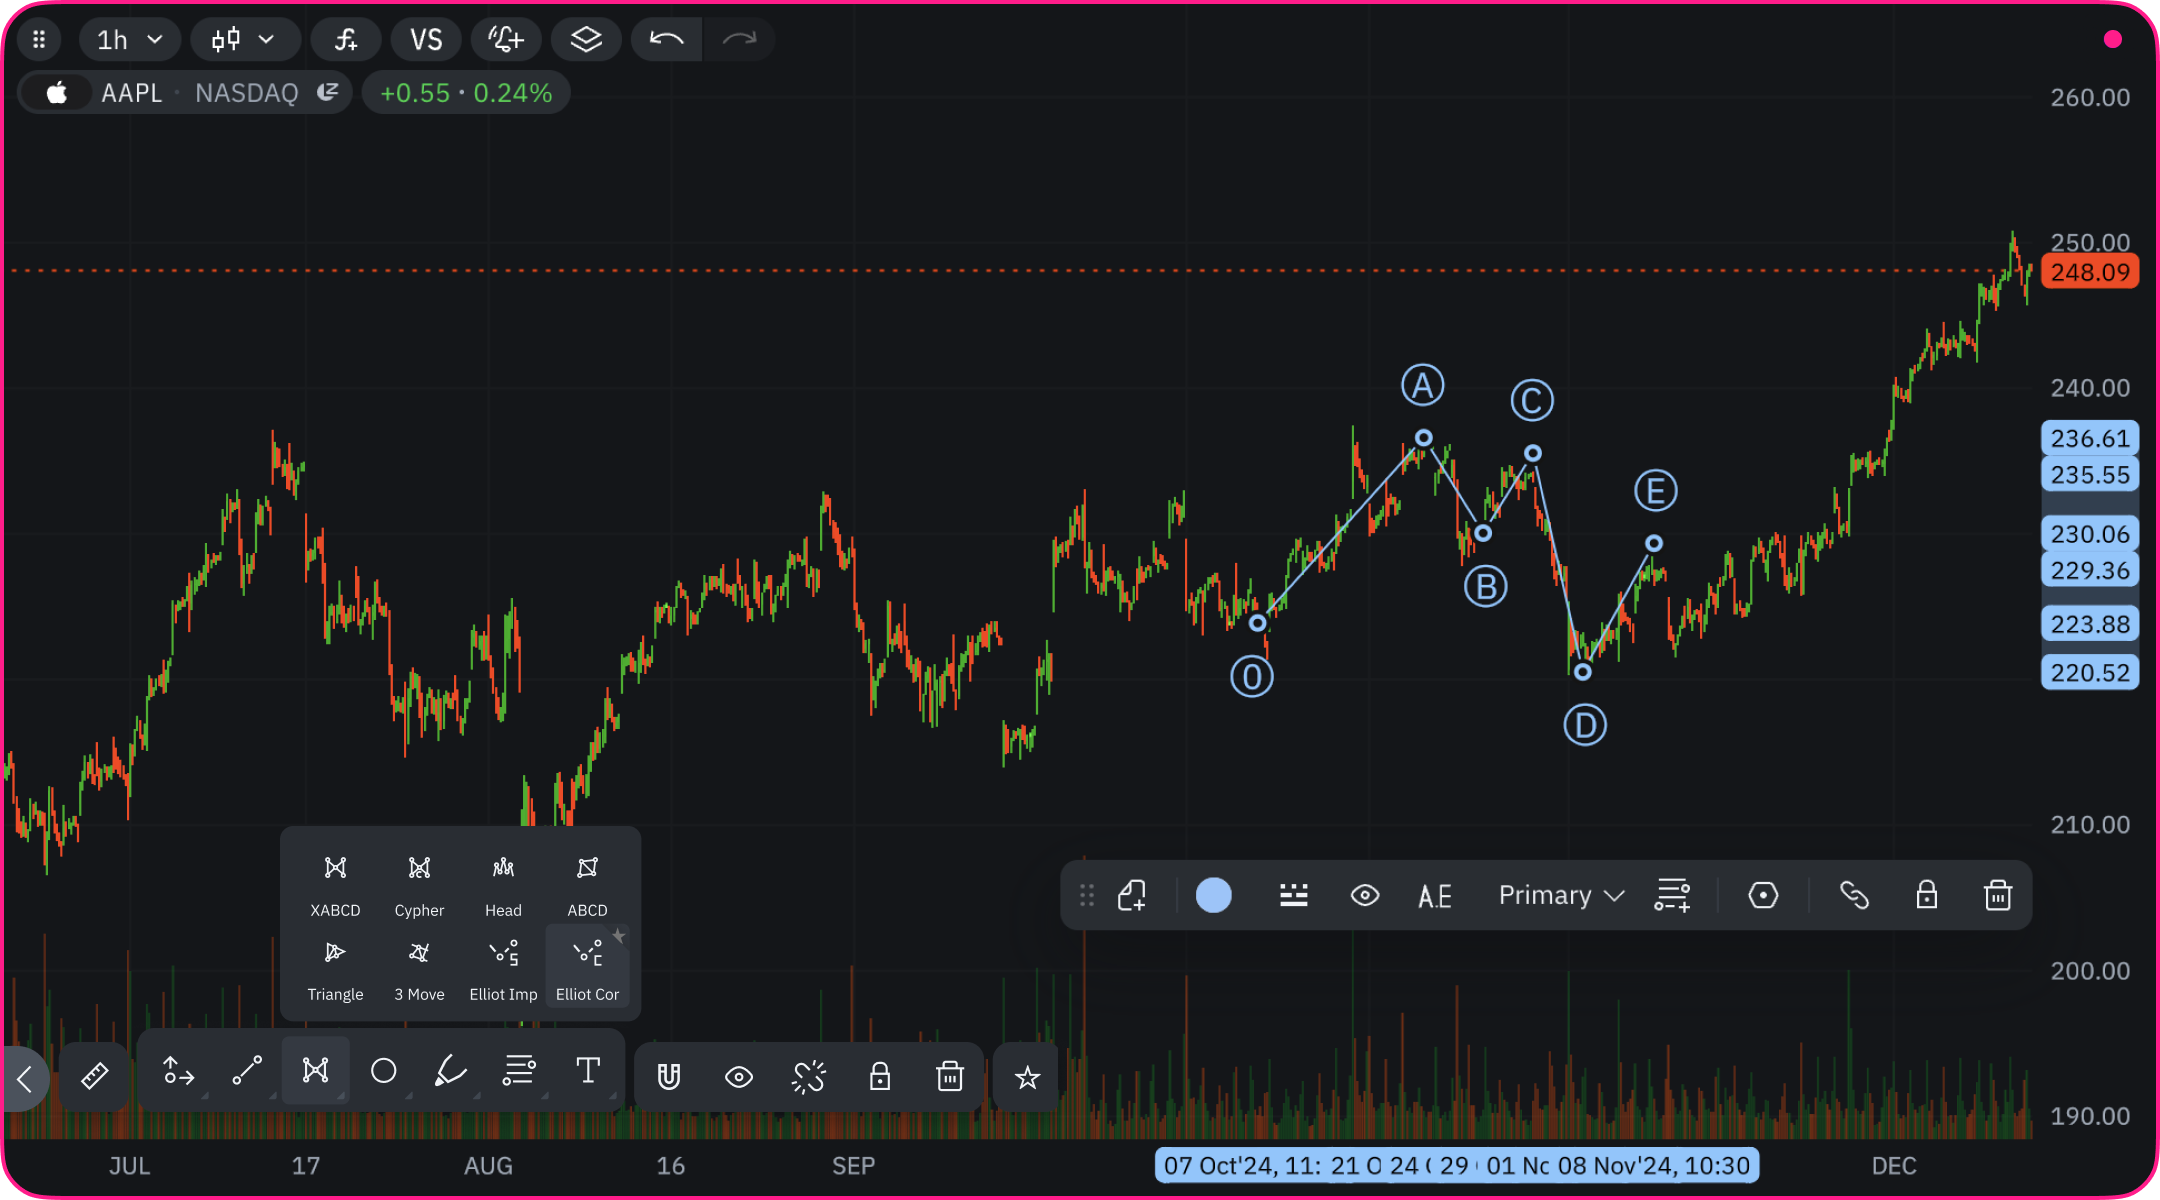 * Move against the main trend direction
* Consist of three distinct waves labeled A-B-C
* Typically retrace a portion of the preceding impulse wave
* Often more complex and difficult to identify than impulse waves
* **Elliott Impulse Structure (5 waves):**
1. **Wave Structure:** Each impulse consists of 5 waves, with waves 1, 3, and 5 being impulses themselves, and waves 2 and 4 being corrections
2. **Wave 2 Limitation:** The second wave never retraces more than 100% of wave 1 (never goes beyond the starting point of wave 1)
3. **Wave 3 Extension:** The third wave always moves beyond the end of wave 1, often the longest and strongest wave
4. **Wave 3 Prominence:** Among waves 1, 3, and 5, wave 3 is never the shortest and frequently the longest
5. **Wave 4 Boundary:** The fourth wave typically doesn't enter the price territory of wave 1 (no overlap)
* **Elliott Correction Structure (3 waves):**
1. **ZigZag Formation:** The most common corrective pattern is a zigzag structured as 5-3-5 (five waves down, three waves up, five waves down in a bearish market)
2. **Wave B Characteristics:** Wave B is typically shorter than Wave A, showing the underlying strength of the main trend
3. **Wave C Extension:** Wave C usually extends beyond the end of Wave A, creating a new extreme in the correction
* **Wave Hierarchy Notation:**
* **Main Waves:** Marked as (1), (2), (3), (4), (5), (A), (B), (C) showing the larger degree pattern
* **Sub-waves:** Marked as 1, 2, 3, 4, 5, a, b, c representing smaller waves inside the main waves
* **Analysis Scope:** The pattern typically examines 600 previous bars to identify wave structures
**Learn More:** For a comprehensive guide on Elliott Impulses with detailed examples and trading strategies, check out our in-depth tutorial at [MTC Education - Elliott Impulses](https://takeprofit.com/posts/mtc-education-elliott-impulses-38).
* Move against the main trend direction
* Consist of three distinct waves labeled A-B-C
* Typically retrace a portion of the preceding impulse wave
* Often more complex and difficult to identify than impulse waves
* **Elliott Impulse Structure (5 waves):**
1. **Wave Structure:** Each impulse consists of 5 waves, with waves 1, 3, and 5 being impulses themselves, and waves 2 and 4 being corrections
2. **Wave 2 Limitation:** The second wave never retraces more than 100% of wave 1 (never goes beyond the starting point of wave 1)
3. **Wave 3 Extension:** The third wave always moves beyond the end of wave 1, often the longest and strongest wave
4. **Wave 3 Prominence:** Among waves 1, 3, and 5, wave 3 is never the shortest and frequently the longest
5. **Wave 4 Boundary:** The fourth wave typically doesn't enter the price territory of wave 1 (no overlap)
* **Elliott Correction Structure (3 waves):**
1. **ZigZag Formation:** The most common corrective pattern is a zigzag structured as 5-3-5 (five waves down, three waves up, five waves down in a bearish market)
2. **Wave B Characteristics:** Wave B is typically shorter than Wave A, showing the underlying strength of the main trend
3. **Wave C Extension:** Wave C usually extends beyond the end of Wave A, creating a new extreme in the correction
* **Wave Hierarchy Notation:**
* **Main Waves:** Marked as (1), (2), (3), (4), (5), (A), (B), (C) showing the larger degree pattern
* **Sub-waves:** Marked as 1, 2, 3, 4, 5, a, b, c representing smaller waves inside the main waves
* **Analysis Scope:** The pattern typically examines 600 previous bars to identify wave structures
**Learn More:** For a comprehensive guide on Elliott Impulses with detailed examples and trading strategies, check out our in-depth tutorial at [MTC Education - Elliott Impulses](https://takeprofit.com/posts/mtc-education-elliott-impulses-38).