> ## Documentation Index
> Fetch the complete documentation index at: https://takeprofit.com/docs/llms.txt
> Use this file to discover all available pages before exploring further.
# Object Tree (Layers)
The Object Tree provides a centralized management system for all chart elements, making it easy to organize, edit, and control multiple drawings and indicators on your chart.
## Accessing Object Tree
Click the "Layers" icon on your chart to open the Object Tree panel.
## Key Features
### Grouping Drawings
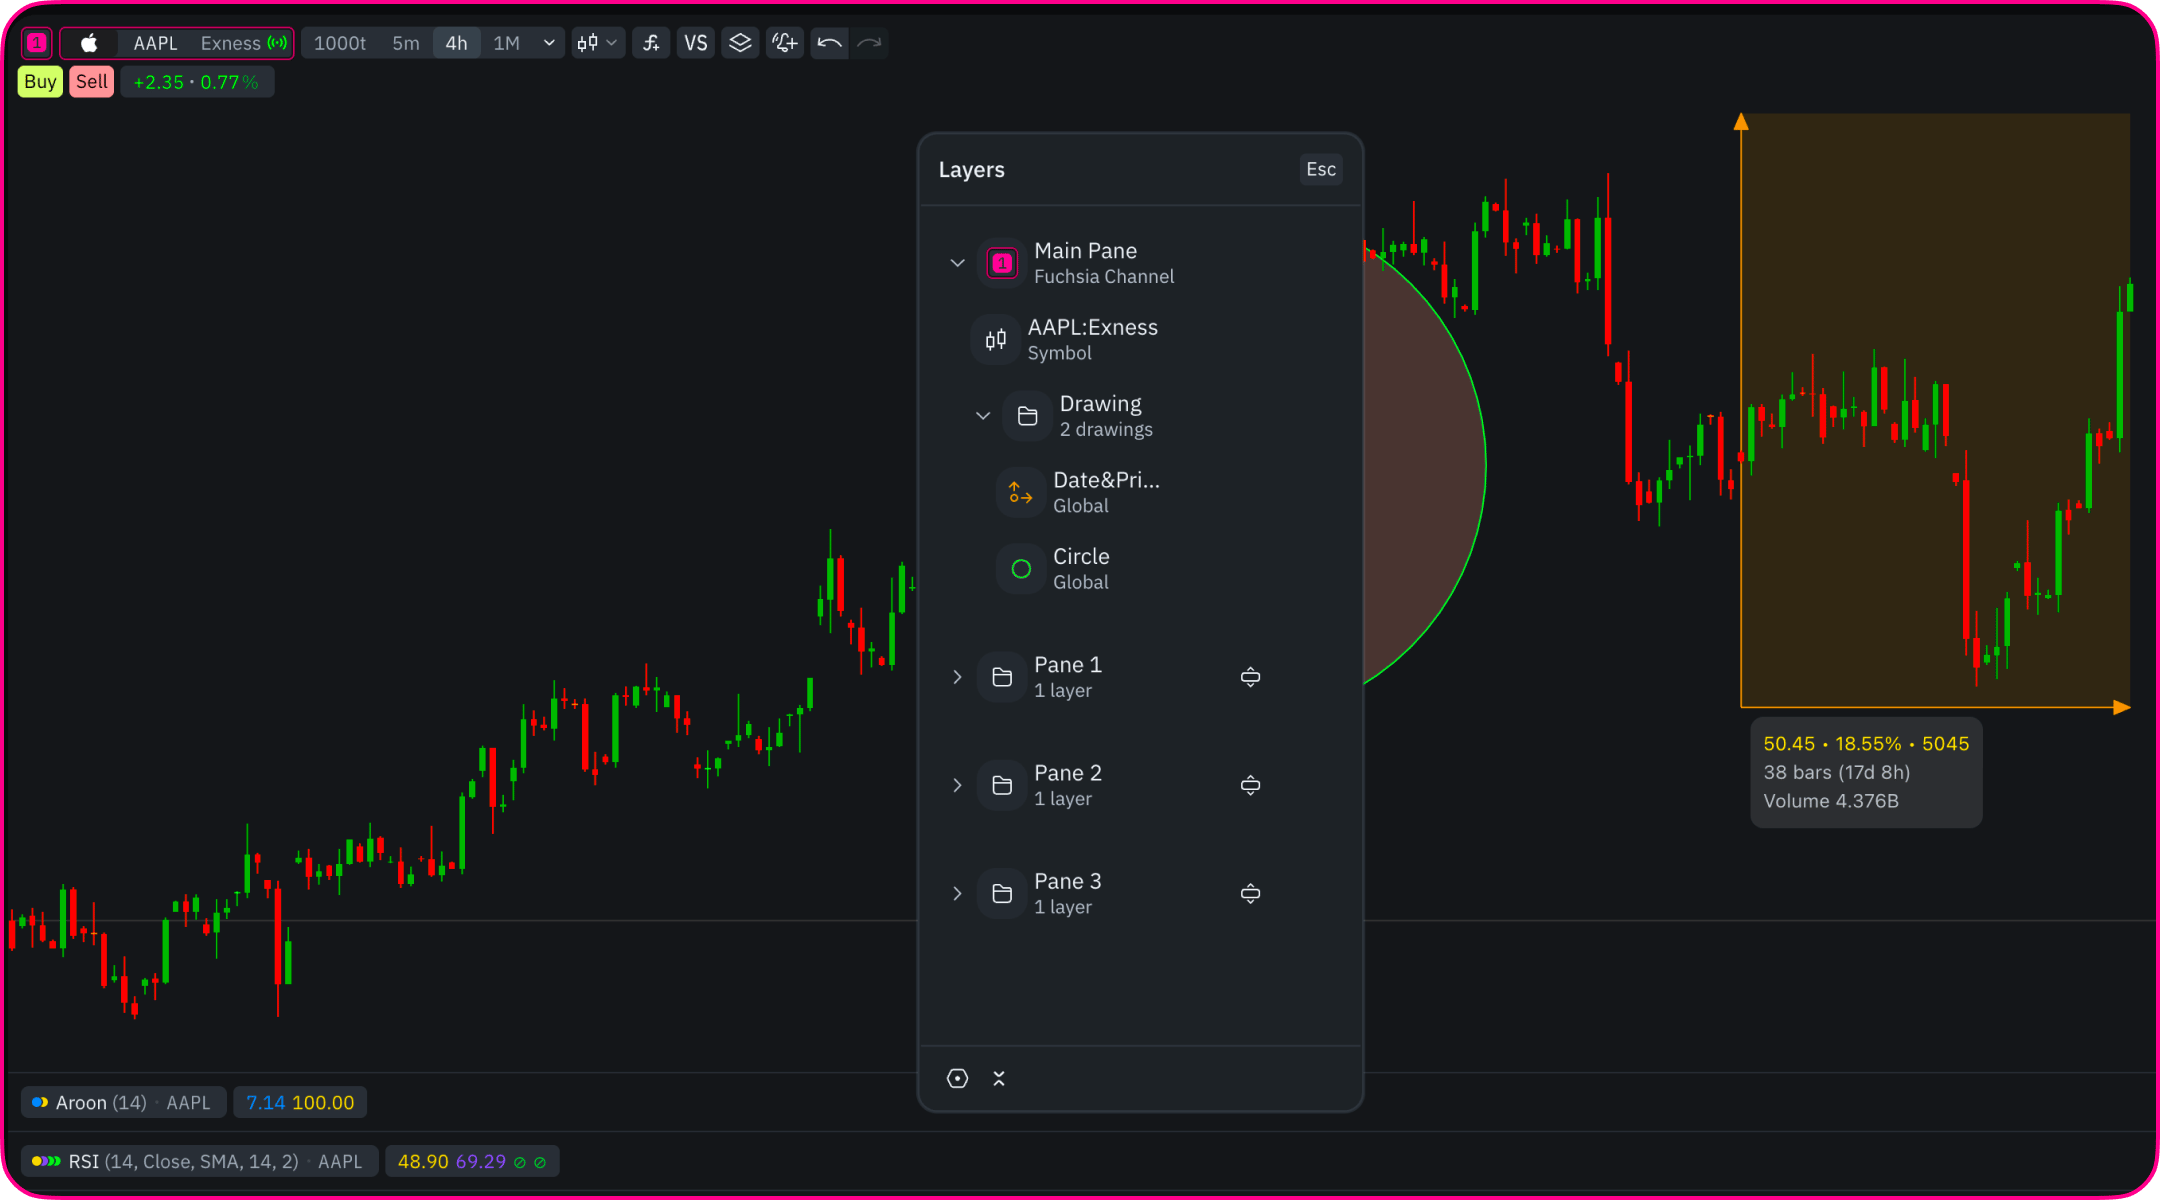 Organize related drawings into logical collections:
1. Select multiple drawings using **Ctrl / Command (⌘)**.
2. Click the **Folder icon** at the bottom of the **Layers** panel — a new group appears.
3. Rename groups for better organization.
### Group Management
Organize related drawings into logical collections:
1. Select multiple drawings using **Ctrl / Command (⌘)**.
2. Click the **Folder icon** at the bottom of the **Layers** panel — a new group appears.
3. Rename groups for better organization.
### Group Management
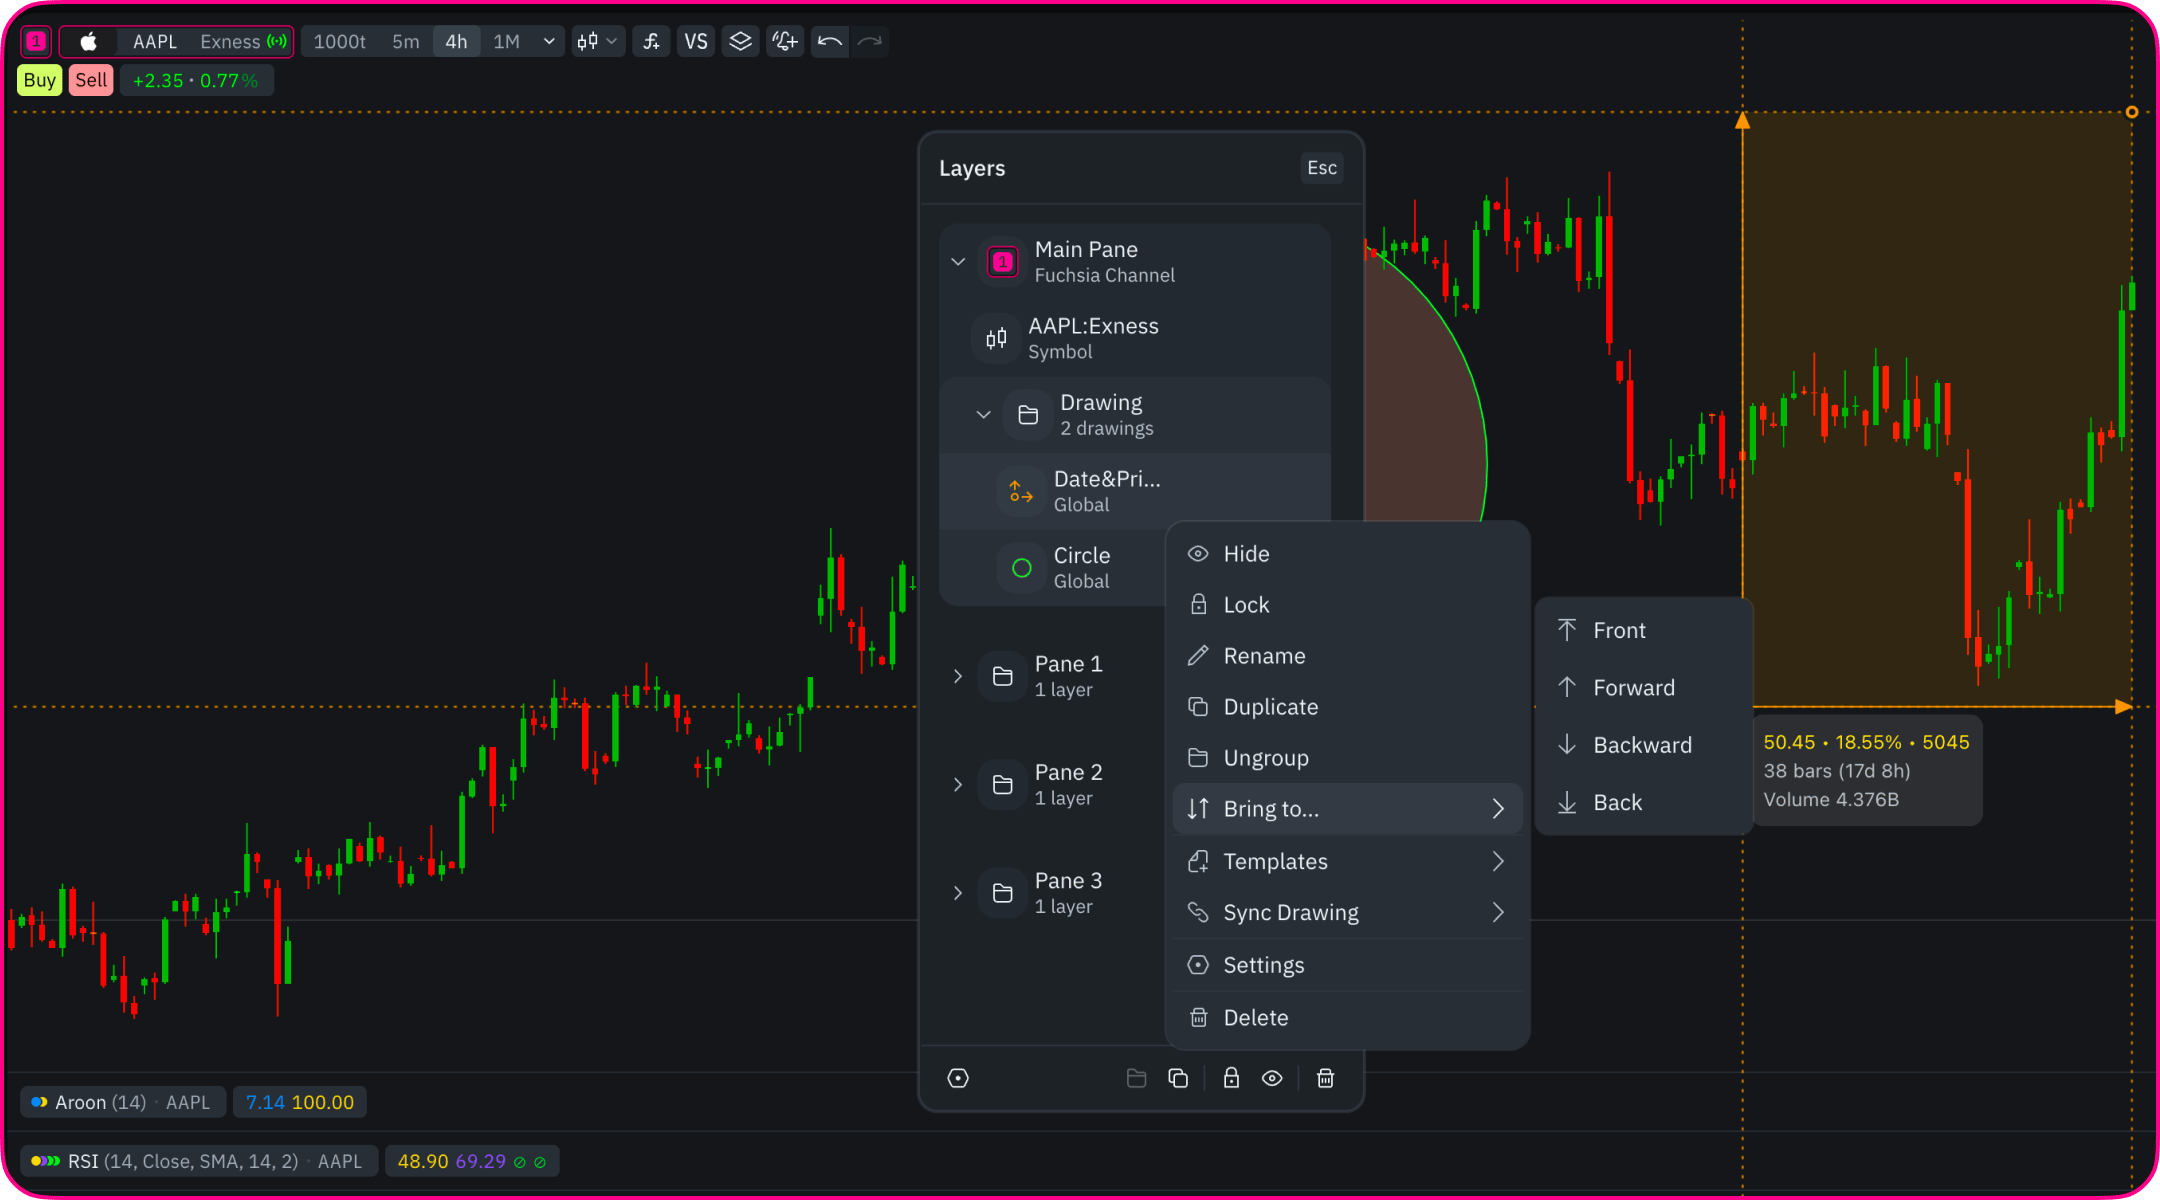 Right-click on any group to access management options:
* **Visibility:** Hide/show entire groups at once
* **Lock:** Prevent accidental changes to group elements
* **Ordering:** Bring to Front, Send to Back, Forward, Backward
* **Duplication:** Copy entire groups with all settings
* **Renaming:** Give descriptive names to groups
* **Synchronization:** Set sync level (global, workspace, channel, local)
### Bulk Operations
Efficiently manage multiple elements:
* Select several drawings using Ctrl or Shift
* Delete multiple items simultaneously
* Apply settings to multiple drawings at once
* Organize drawings across different groups
### Visibility Control
Toggle different analytical layers:
* Show/hide specific analysis scenarios
* Maintain multiple studies on one chart
* Reduce visual clutter while preserving work
* Switch between different analytical perspectives
## Pane Management
When you add indicators that plot in their own pane (like RSI or MACD), you can organize those panes directly on the chart:
* **Reorder indicators** — drag and drop items in the Object Tree to change their order.
* **Resize** — drag the divider between panes to adjust a pane's height. Custom pane sizes are saved automatically.
* **Minimize** — collapse a pane into a compact view to save space while keeping it on the chart.
* **Expand** — double-click a pane to expand it to the full chart; double-click again to restore.
* **Move up / down** — reorder panes vertically.
* **Hide or remove** — hide a pane from view, or delete it entirely.
## Practical Applications
* Separate drawings by strategy or timeframe
* Group related pattern components
* Organize drawings by trade setup
* Create analysis layers for different scenarios
* Maintain clean charts while preserving all analysis
Right-click on any group to access management options:
* **Visibility:** Hide/show entire groups at once
* **Lock:** Prevent accidental changes to group elements
* **Ordering:** Bring to Front, Send to Back, Forward, Backward
* **Duplication:** Copy entire groups with all settings
* **Renaming:** Give descriptive names to groups
* **Synchronization:** Set sync level (global, workspace, channel, local)
### Bulk Operations
Efficiently manage multiple elements:
* Select several drawings using Ctrl or Shift
* Delete multiple items simultaneously
* Apply settings to multiple drawings at once
* Organize drawings across different groups
### Visibility Control
Toggle different analytical layers:
* Show/hide specific analysis scenarios
* Maintain multiple studies on one chart
* Reduce visual clutter while preserving work
* Switch between different analytical perspectives
## Pane Management
When you add indicators that plot in their own pane (like RSI or MACD), you can organize those panes directly on the chart:
* **Reorder indicators** — drag and drop items in the Object Tree to change their order.
* **Resize** — drag the divider between panes to adjust a pane's height. Custom pane sizes are saved automatically.
* **Minimize** — collapse a pane into a compact view to save space while keeping it on the chart.
* **Expand** — double-click a pane to expand it to the full chart; double-click again to restore.
* **Move up / down** — reorder panes vertically.
* **Hide or remove** — hide a pane from view, or delete it entirely.
## Practical Applications
* Separate drawings by strategy or timeframe
* Group related pattern components
* Organize drawings by trade setup
* Create analysis layers for different scenarios
* Maintain clean charts while preserving all analysis