> ## Documentation Index
> Fetch the complete documentation index at: https://takeprofit.com/docs/llms.txt
> Use this file to discover all available pages before exploring further.
# How to Use the Long/Short Tool
## What Is the Long/Short Tool and Who Should Use It?
The Long/Short Tool is designed to simulate a trade based on your custom entry price, stop loss (SL), and take profit (TP). This drawing tool helps you visualize a potential position, assess its risk-reward profile, and understand position sizing before placing a real order with your broker.
This tool is especially useful for:
* **New traders**, who want to develop risk awareness and practice setting stops and targets.
* **Experienced traders**, who use chart-based planning and want quick visual feedback on trade setups.
* **Strategy testers**, who want to pre-validate trades on charts using fixed or dynamic Risk/Reward (RR) levels.
You can think of it as a visual trade planner and risk simulator — it won't place real trades, but it helps you make better ones.
***
## 🔧 Setup: Defining Your Risk
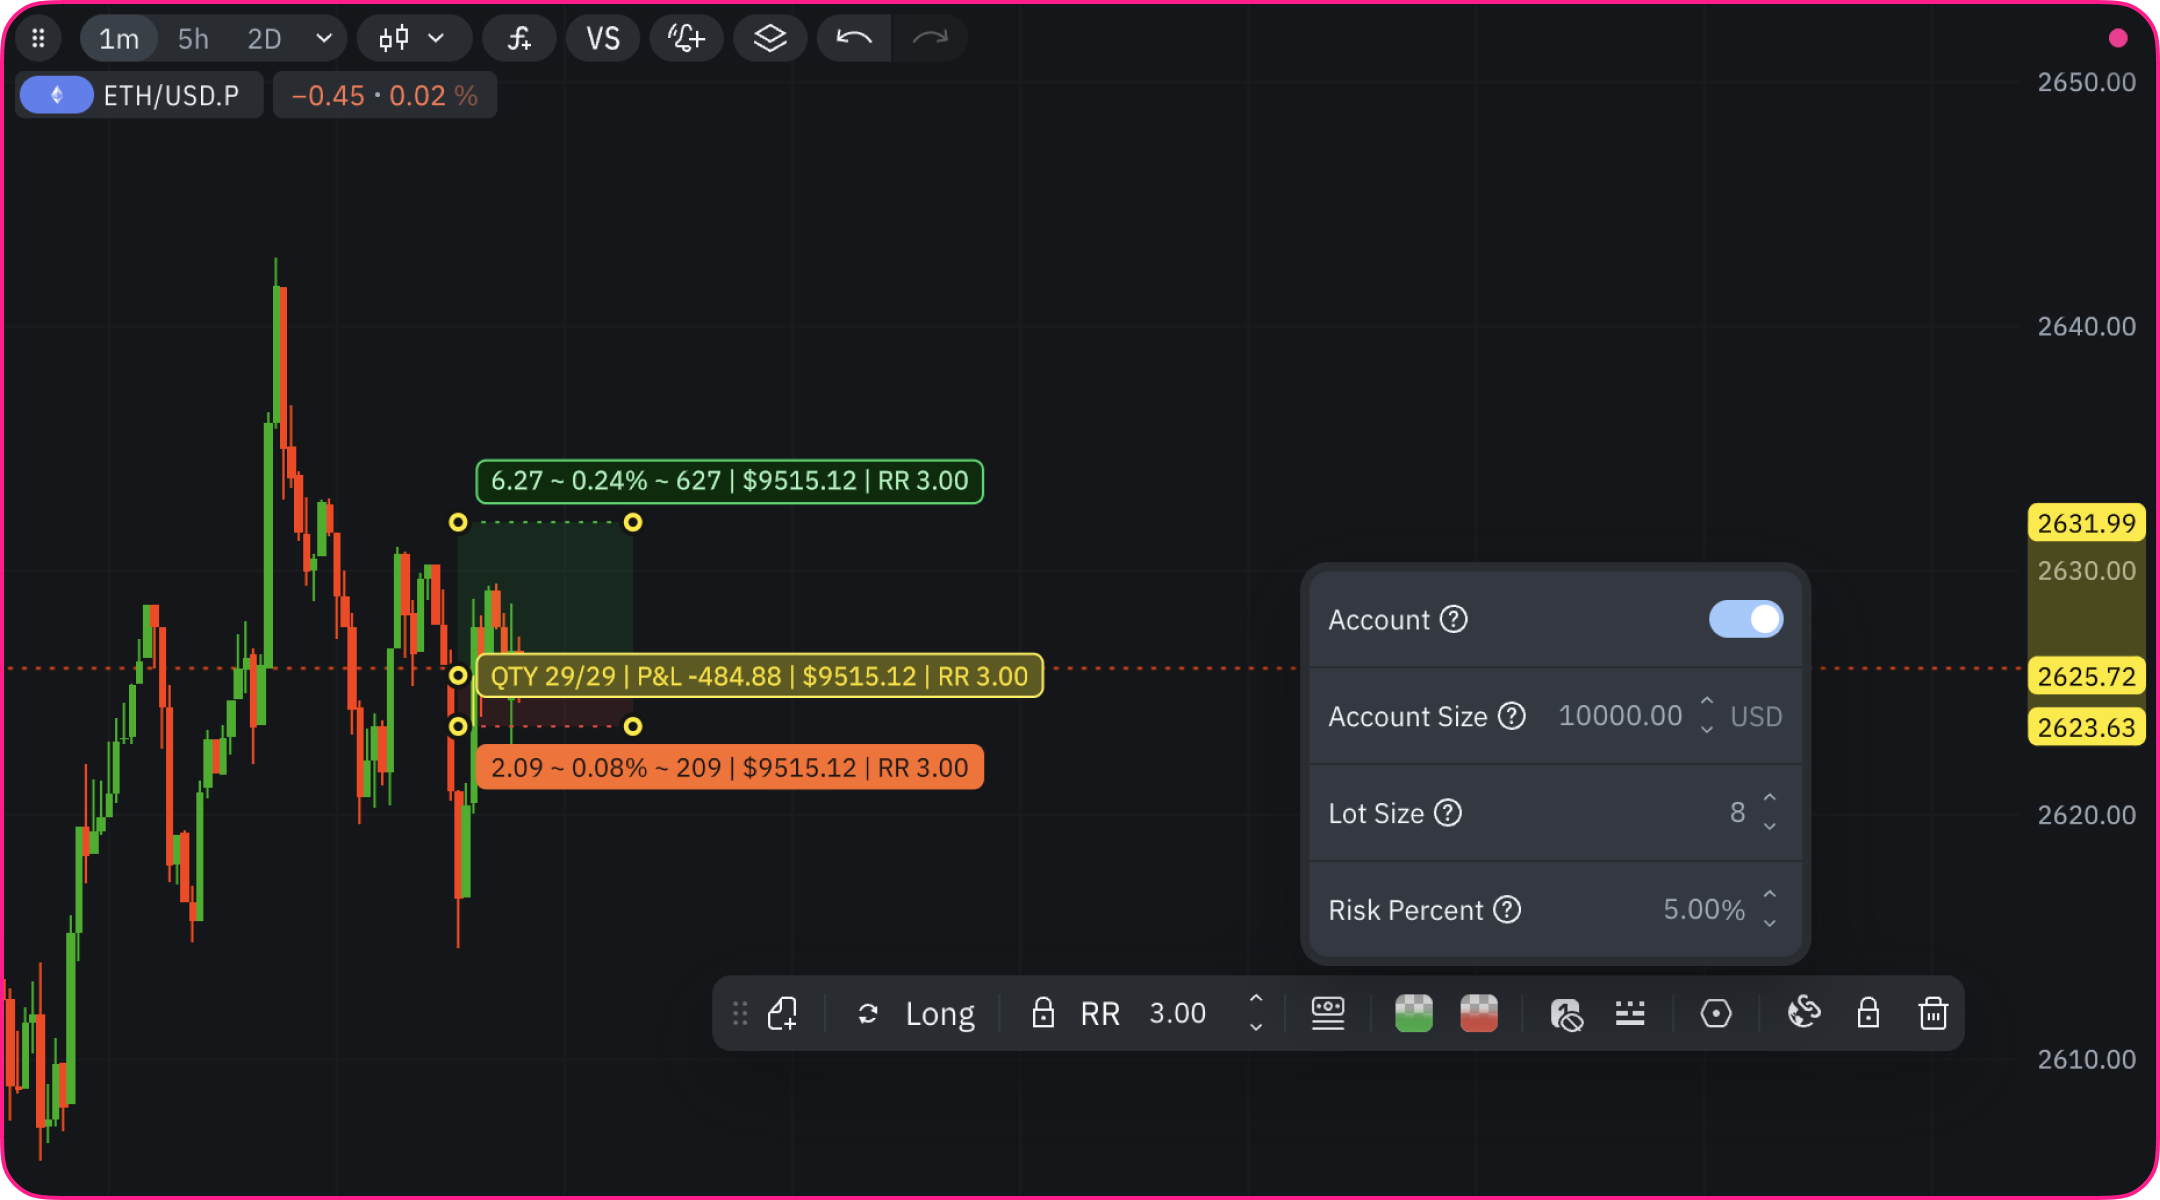 Before drawing a trade, configure the following settings:
* **Account Size** — This is your total capital used for the calculation. For example: 10,000.
* **Risk Percent** — The % of your capital you are willing to risk. For example: 5%.
If you set Account Size to 10,000 and Risk Percent to 50%, you're risking 5,000 in the simulation. The system will calculate how many lots you could buy if you risked that much at your chosen entry price.
***
## 🟡 Entry Level
Before drawing a trade, configure the following settings:
* **Account Size** — This is your total capital used for the calculation. For example: 10,000.
* **Risk Percent** — The % of your capital you are willing to risk. For example: 5%.
If you set Account Size to 10,000 and Risk Percent to 50%, you're risking 5,000 in the simulation. The system will calculate how many lots you could buy if you risked that much at your chosen entry price.
***
## 🟡 Entry Level
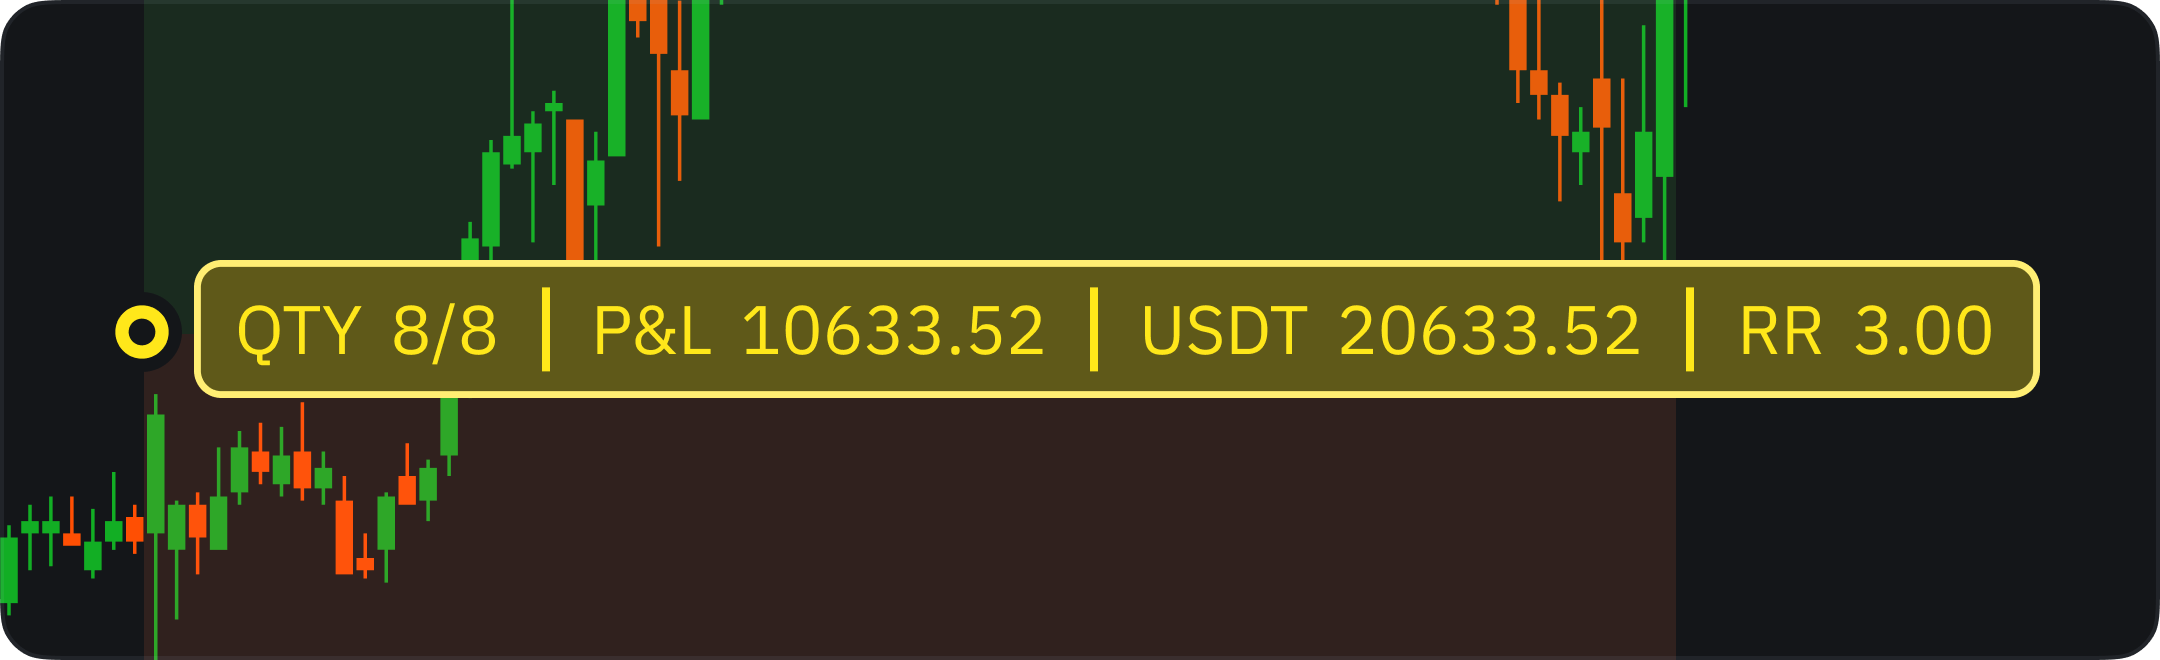 * When you place the tool on the chart, a **yellow horizontal line** marks your chosen entry price.
* A **dot near the line** shows the time and price of your hypothetical entry.
* You'll see a **QTY label** with two numbers:\
For example, `QTY: 8/8`
* First number = remaining lots (after some were sold at partial exits, if any).
* Second number = total lots originally bought.
This helps you track how much of the position is still open.
***
## 🔻 Stop Loss and 🔺 Take Profit
* The **lowest level** below the yellow entry line is the Stop Loss (for long trades).
* The **highest level** above the entry is the Take Profit.
* When you place the tool on the chart, a **yellow horizontal line** marks your chosen entry price.
* A **dot near the line** shows the time and price of your hypothetical entry.
* You'll see a **QTY label** with two numbers:\
For example, `QTY: 8/8`
* First number = remaining lots (after some were sold at partial exits, if any).
* Second number = total lots originally bought.
This helps you track how much of the position is still open.
***
## 🔻 Stop Loss and 🔺 Take Profit
* The **lowest level** below the yellow entry line is the Stop Loss (for long trades).
* The **highest level** above the entry is the Take Profit.
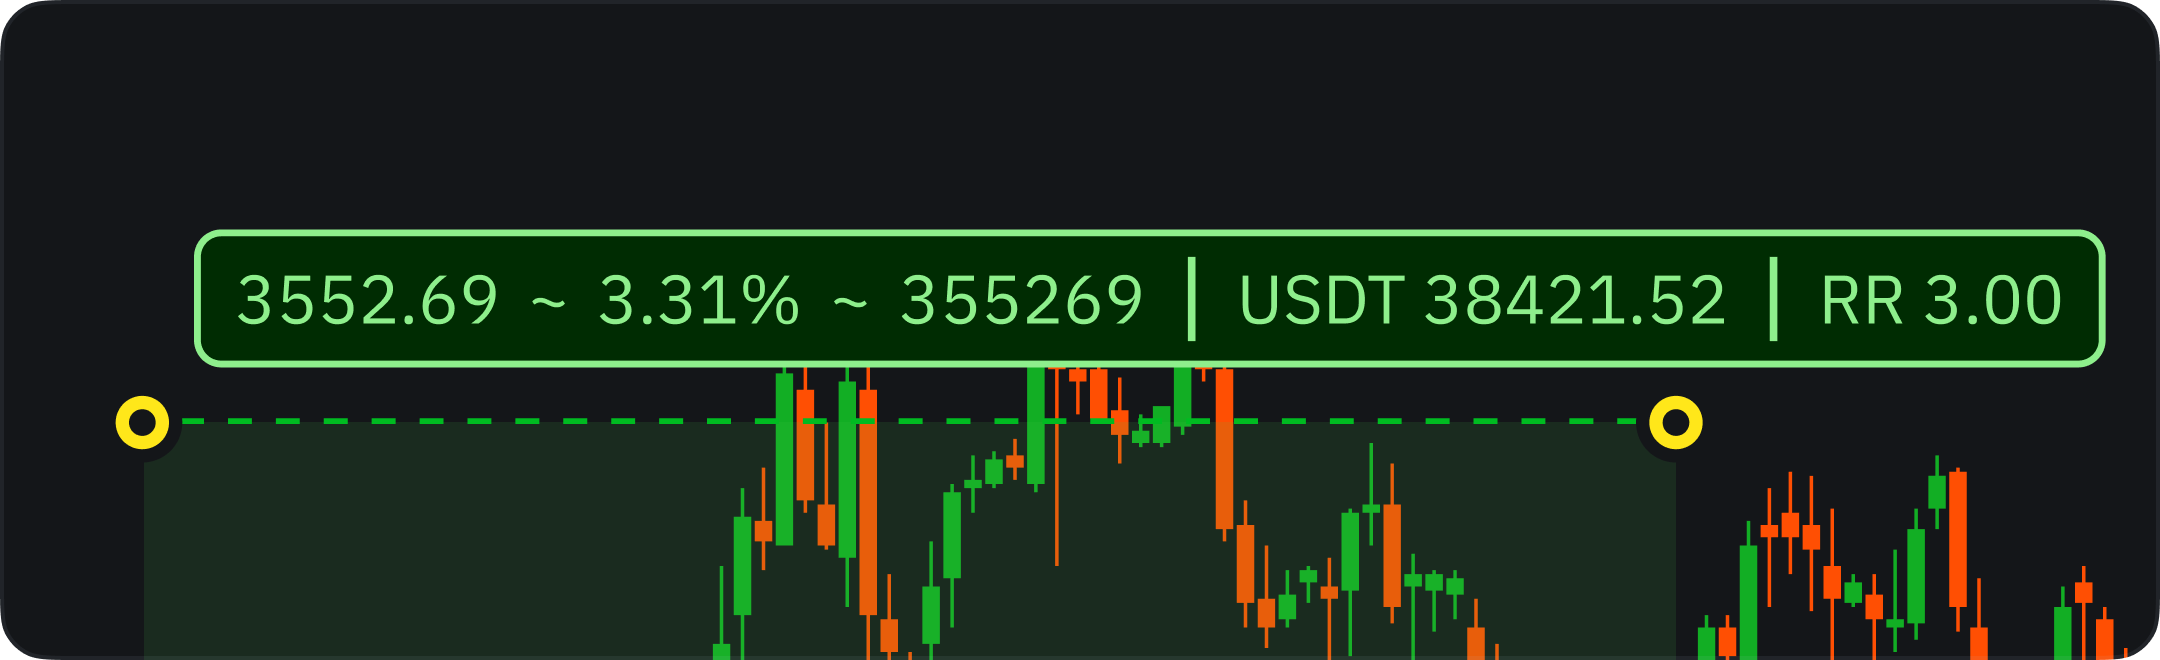 * These levels are calculated automatically based on your RR setting, or can be manually adjusted.
* If the line connecting entry to TP/SL is **dashed**, the trade is still open.
* Once it hits a TP or SL level, the line becomes **solid**, indicating closure.
***
## 📈 P\&L and RR
* **P\&L** shows your current hypothetical profit or loss based on price movement.
* **RR (Risk/Reward Ratio)** is calculated based on your configured RR or dynamically from your levels:
* If you set a fixed RR of 2.0, and you risk 500, the TP will be placed at a price that gives 1,000 reward.
* If you manually place stop and target, RR is calculated based on those placements.
This helps you immediately see if the trade is worth taking.
***
## 🧩 Partial Targets (Optional)
* These levels are calculated automatically based on your RR setting, or can be manually adjusted.
* If the line connecting entry to TP/SL is **dashed**, the trade is still open.
* Once it hits a TP or SL level, the line becomes **solid**, indicating closure.
***
## 📈 P\&L and RR
* **P\&L** shows your current hypothetical profit or loss based on price movement.
* **RR (Risk/Reward Ratio)** is calculated based on your configured RR or dynamically from your levels:
* If you set a fixed RR of 2.0, and you risk 500, the TP will be placed at a price that gives 1,000 reward.
* If you manually place stop and target, RR is calculated based on those placements.
This helps you immediately see if the trade is worth taking.
***
## 🧩 Partial Targets (Optional)
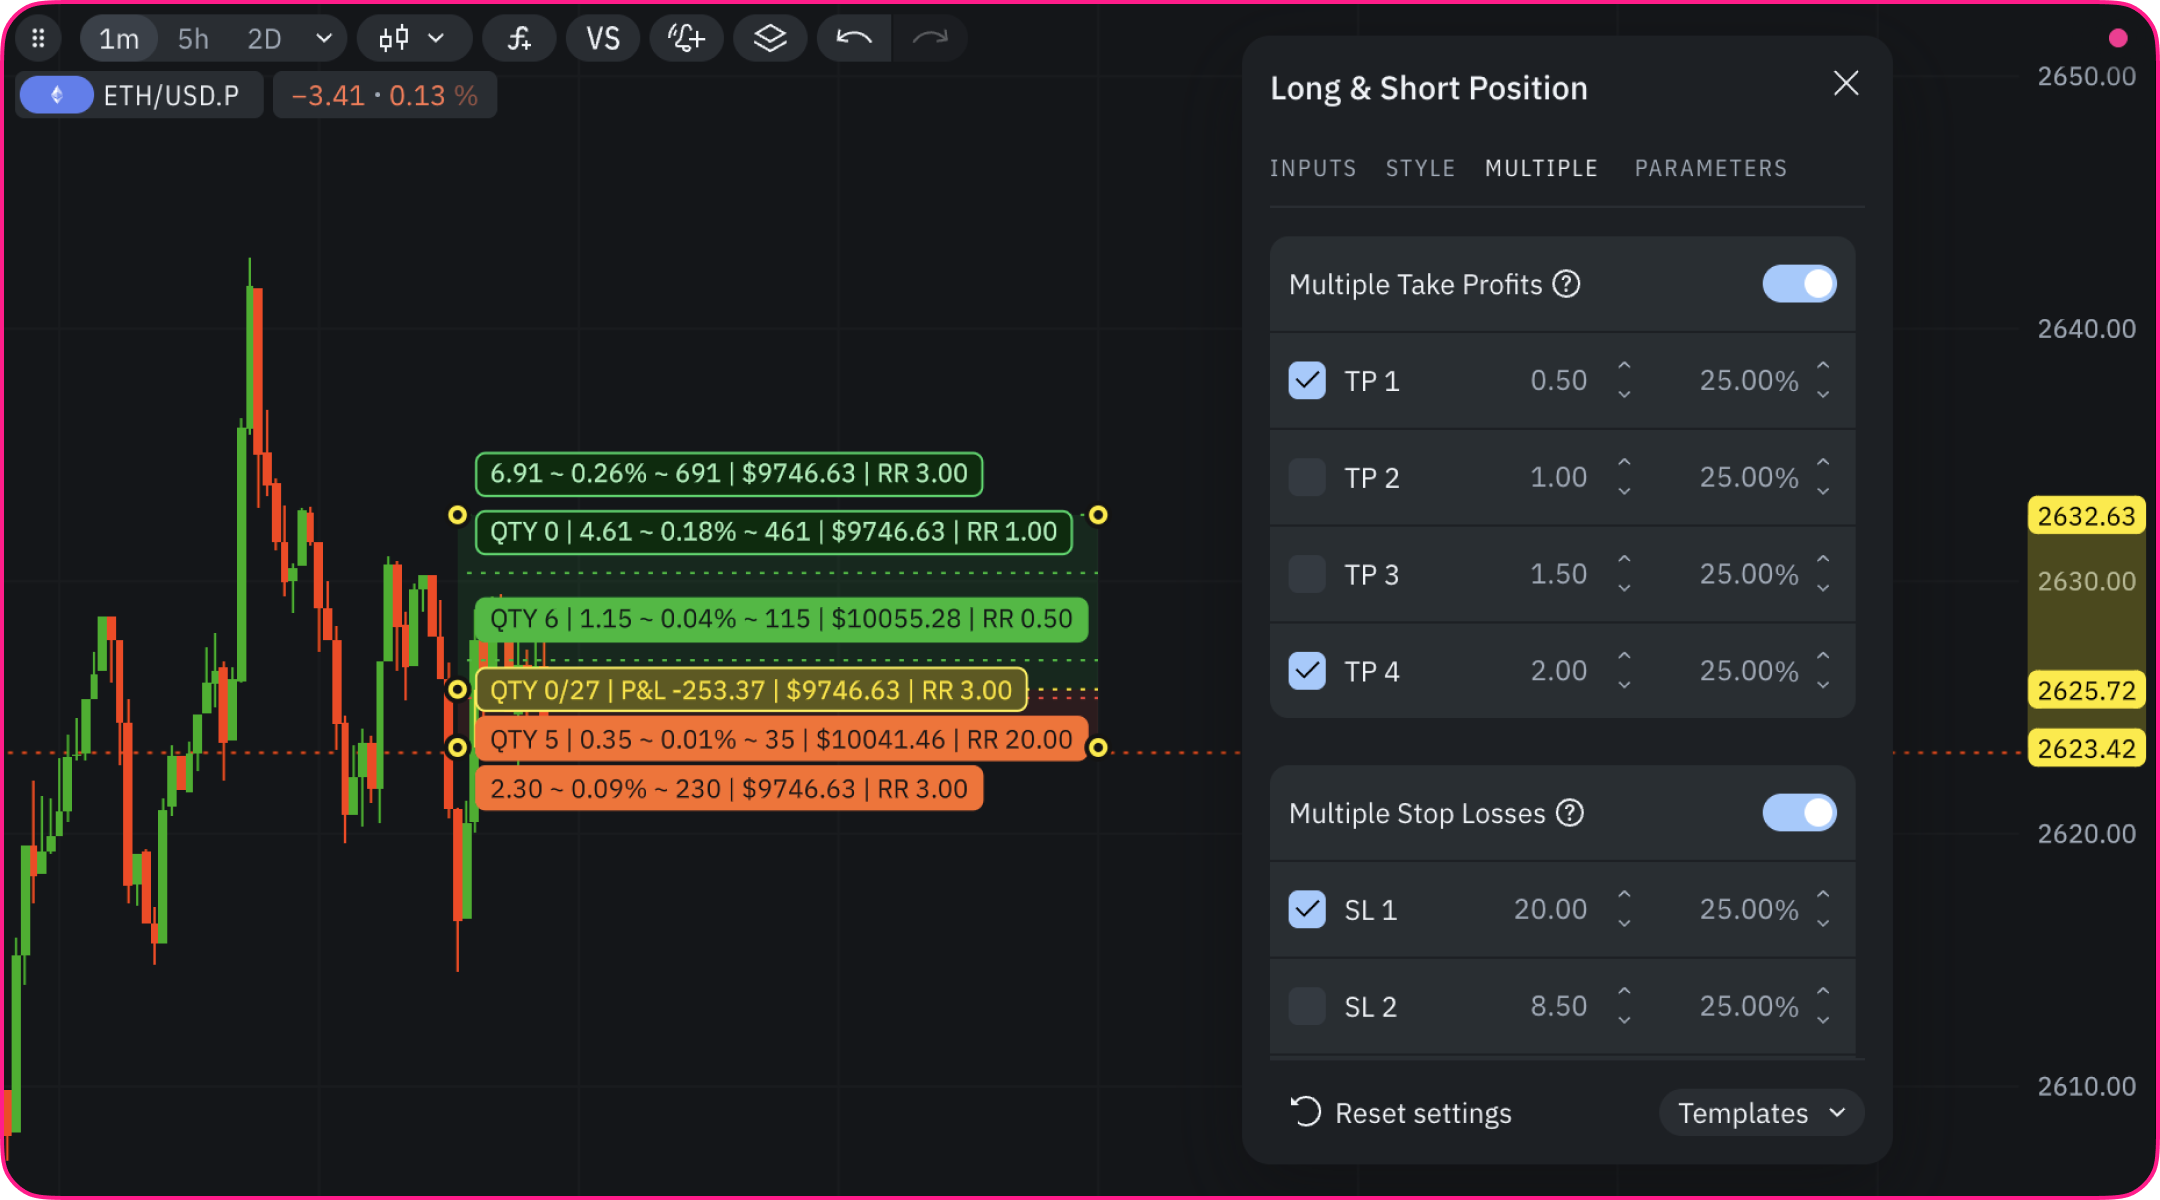 You can set partial targets between your entry and final Take-Profit (TP) or Stop-Loss (SL). These are often used for scaling out of a position as the trade moves in your favor.
Each target displays:
* **Absolute change** in currency.
* **Percentage change** from entry.
* **Change in pips**.
You can also define:
* **RR target** for the target.
* **What percentage of your position to close** when that target is reached.
For example:
* You set RR = 1.0 and choose to exit 50% of the position.
* The tool places a target where your profit equals the initial risk.
* When price hits that target, the background fills in and your quantity updates (e.g. 8/8 → 4/8).
This setup helps with layered exits, risk scaling, and more flexible trade management.
***
## 🧠 Example Workflow
Let's walk through a complete example using numbers.
### Step 1 -- Define Capital and Risk
* You set:
* `Account Size = 10,000`
* `Risk Percent = 10%` → you're risking `1,000`
### Step 2 -- Draw Entry
* You place the tool at a price of **100** (entry price for a long trade).
The system calculates:
* Your position size = 10 lots (e.g. 1,000 / 100 per share).
* QTY shows `10/10`
### Step 3 -- Set Risk/Reward
You configure:
* Fixed RR = 2.0
* Tool places:
* Stop Loss at **90** (10% below entry)
* Take Profit at **120** (20% above entry)
Now:
* If price drops to 90 → loss of 1,000 (your full risk)
* If price rises to 120 → gain of 2,000
* RR = 1:2
### Step 4 -- Add Intermediate Target
You add a partial TP:
* RR = 1.0 (i.e. 110)
* Sell 50% of the position (5 lots)
If the price hits 110:
* Tool marks the level with a colored background.
* QTY updates to `5/10`
* You've secured 500 and reduced exposure.
***
## ✅ Tips for Best Use
* Use the tool before entering real trades to validate your setup visually.
* Try both fixed RR mode and manual level mode to see which fits your strategy better.
* For complex strategies, define multiple exits to manage position actively.
* Use it alongside your charting and analysis to stay grounded in risk.
***
## 🧭 Final Notes
The Long/Short Tool is not a trading signal — it's a risk visualization assistant.
It won't tell you where the market is going, but it will help you answer:
* Is this setup worth the risk?
* How much could I lose or gain?
* What's the best way to scale in or out?
For any trader trying to improve discipline and clarity in decision-making, this tool can be a vital part of the planning process.
You can set partial targets between your entry and final Take-Profit (TP) or Stop-Loss (SL). These are often used for scaling out of a position as the trade moves in your favor.
Each target displays:
* **Absolute change** in currency.
* **Percentage change** from entry.
* **Change in pips**.
You can also define:
* **RR target** for the target.
* **What percentage of your position to close** when that target is reached.
For example:
* You set RR = 1.0 and choose to exit 50% of the position.
* The tool places a target where your profit equals the initial risk.
* When price hits that target, the background fills in and your quantity updates (e.g. 8/8 → 4/8).
This setup helps with layered exits, risk scaling, and more flexible trade management.
***
## 🧠 Example Workflow
Let's walk through a complete example using numbers.
### Step 1 -- Define Capital and Risk
* You set:
* `Account Size = 10,000`
* `Risk Percent = 10%` → you're risking `1,000`
### Step 2 -- Draw Entry
* You place the tool at a price of **100** (entry price for a long trade).
The system calculates:
* Your position size = 10 lots (e.g. 1,000 / 100 per share).
* QTY shows `10/10`
### Step 3 -- Set Risk/Reward
You configure:
* Fixed RR = 2.0
* Tool places:
* Stop Loss at **90** (10% below entry)
* Take Profit at **120** (20% above entry)
Now:
* If price drops to 90 → loss of 1,000 (your full risk)
* If price rises to 120 → gain of 2,000
* RR = 1:2
### Step 4 -- Add Intermediate Target
You add a partial TP:
* RR = 1.0 (i.e. 110)
* Sell 50% of the position (5 lots)
If the price hits 110:
* Tool marks the level with a colored background.
* QTY updates to `5/10`
* You've secured 500 and reduced exposure.
***
## ✅ Tips for Best Use
* Use the tool before entering real trades to validate your setup visually.
* Try both fixed RR mode and manual level mode to see which fits your strategy better.
* For complex strategies, define multiple exits to manage position actively.
* Use it alongside your charting and analysis to stay grounded in risk.
***
## 🧭 Final Notes
The Long/Short Tool is not a trading signal — it's a risk visualization assistant.
It won't tell you where the market is going, but it will help you answer:
* Is this setup worth the risk?
* How much could I lose or gain?
* What's the best way to scale in or out?
For any trader trying to improve discipline and clarity in decision-making, this tool can be a vital part of the planning process.