> ## Documentation Index
> Fetch the complete documentation index at: https://takeprofit.com/docs/llms.txt
> Use this file to discover all available pages before exploring further.
# Chart Features
## Chart comparison
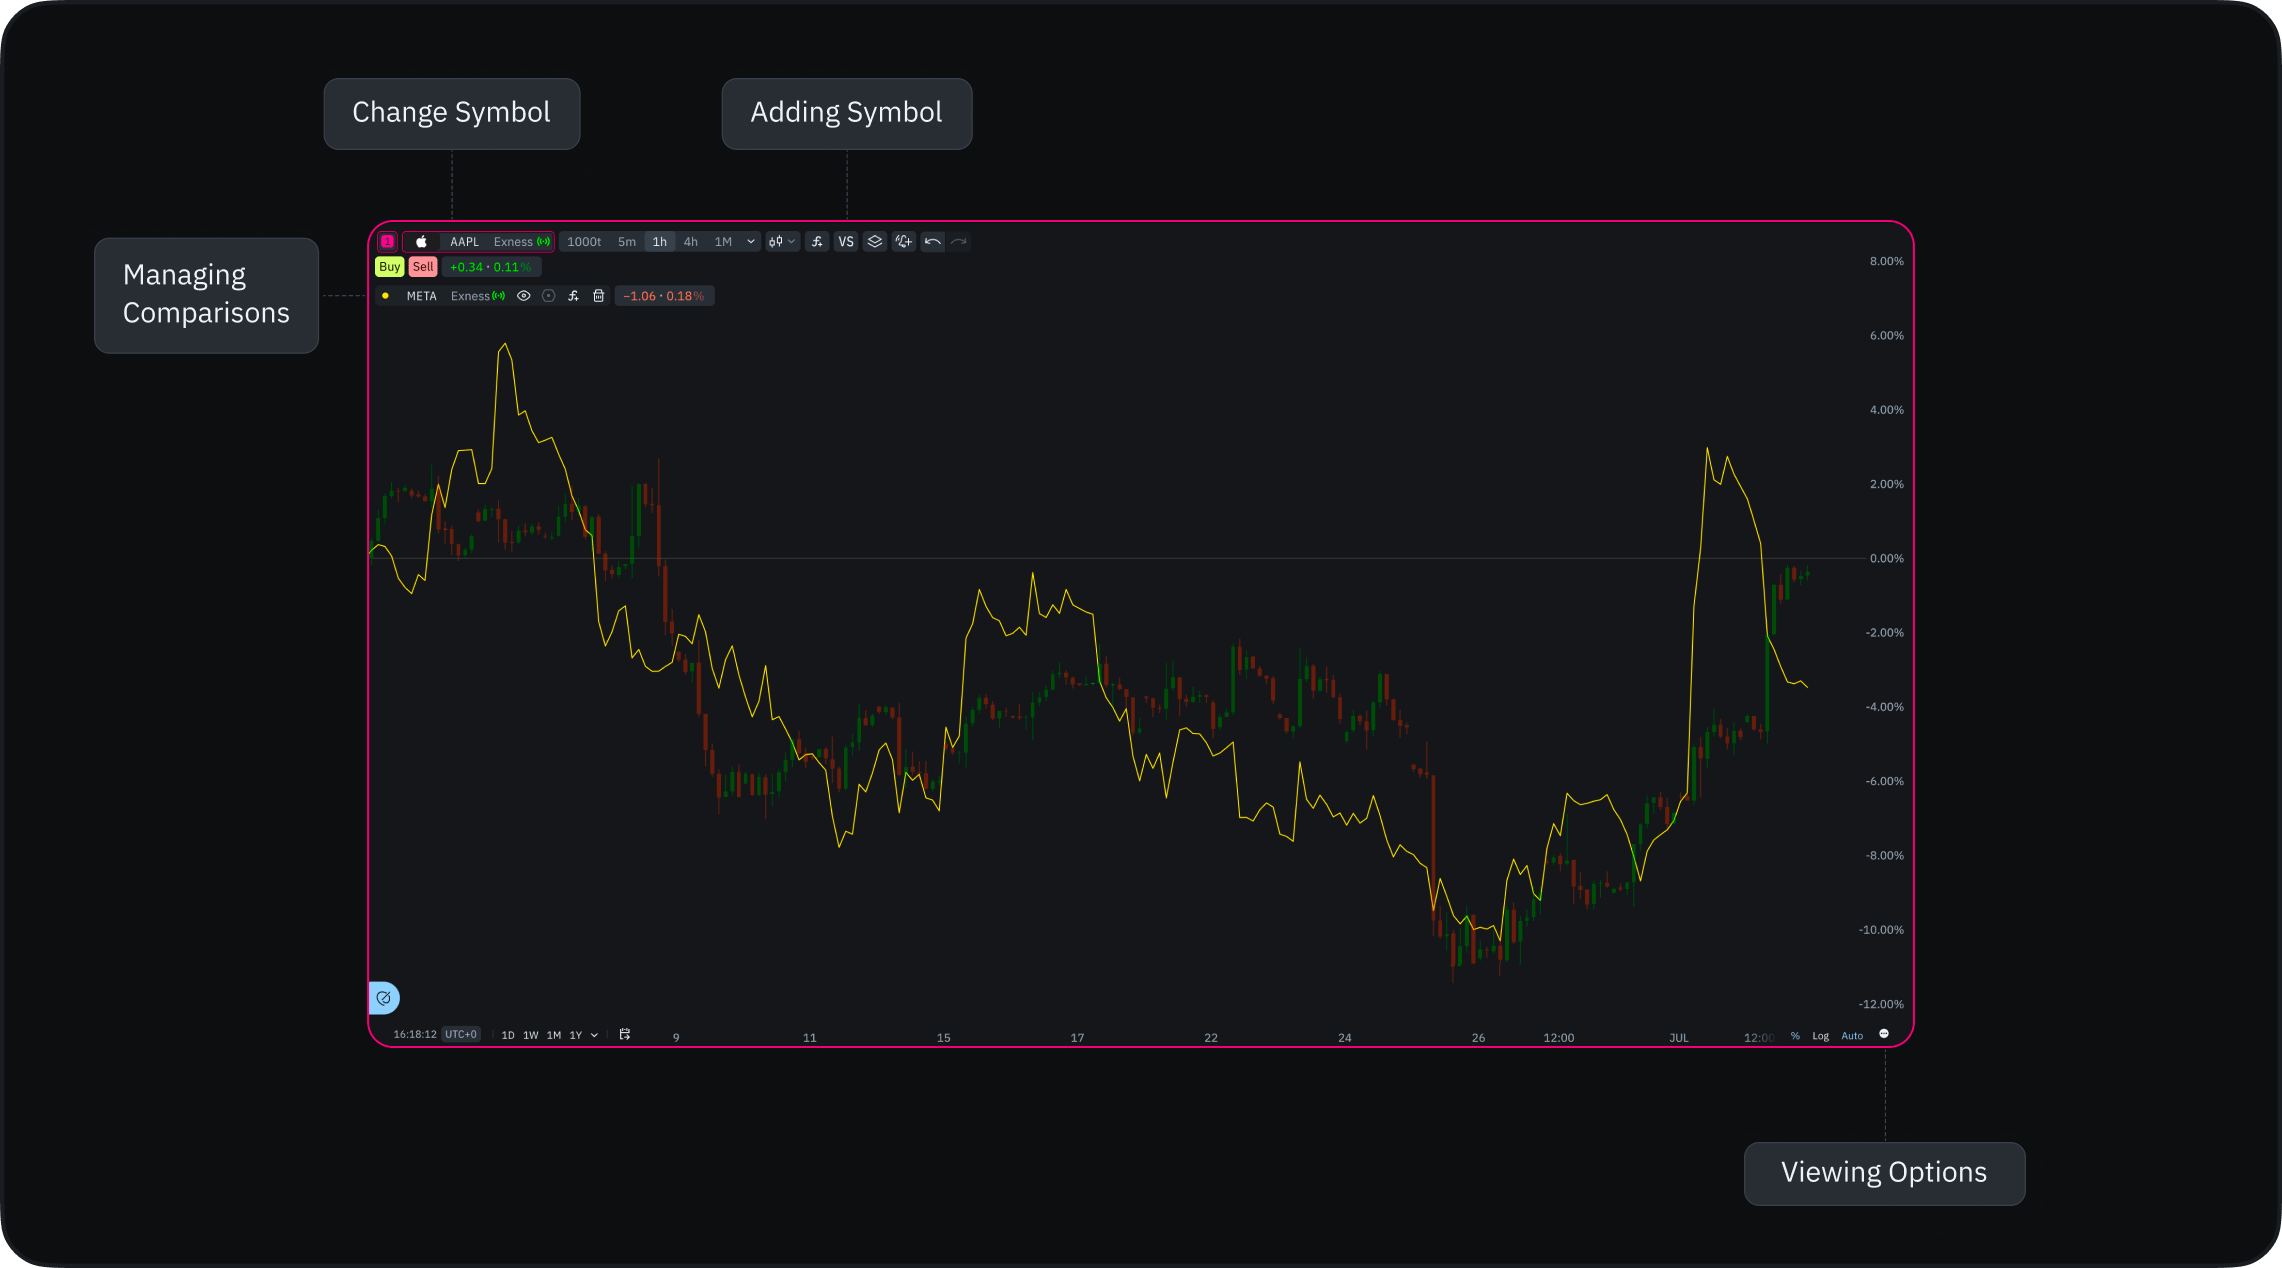 Compare multiple instruments directly on your chart to analyze relative performance. Layer different asset classes and track their movements against each other.
### Using Comparison Tools
#### Adding Instruments
1. Click the "VS" icon on your chart
2. Use the search window to find instruments
3. Select instruments to overlay on your chart
4. Add multiple instruments for comprehensive comparison
#### Viewing Options
* Default view: Percentage mode for easy relative comparison
* Alternative: Switch to absolute values in bottom panel
Percentage view often works better when comparing instruments with different price ranges or volatility.
### Managing Comparisons
* Each compared instrument appears as a colored line
* Hide instruments: Click the eye icon
* Remove instruments: Click the bin icon
* Customization options coming soon:
* Line colors
* Line types
* Additional display settings
### Performance Considerations
* Add as many instruments as needed
* Remove excess comparisons if you notice slowdown
* Consider removing unused comparisons for optimal performance
### Go to date
Instantly navigate to a specific date in the chart's history without manually scrolling back through past price action.
1. Locate the calendar icon on the bottom panel of your chart
2. Click the icon to open the calendar dropdown menu
3. Select your desired month, year, and day
4. The chart instantly snaps to your selected date
## Accessing Drawing Tools
The drawing toolbar appears when you hover your mouse over the chart area. It contains 8 tool categories:
* Measures
* Lines
* Patterns
* Shapes
* Drawings
* Fibonacci
* Text
Plus utility tools: Magnet mode, Hide/Show, Sync, Lock, and Favorite.
Compare multiple instruments directly on your chart to analyze relative performance. Layer different asset classes and track their movements against each other.
### Using Comparison Tools
#### Adding Instruments
1. Click the "VS" icon on your chart
2. Use the search window to find instruments
3. Select instruments to overlay on your chart
4. Add multiple instruments for comprehensive comparison
#### Viewing Options
* Default view: Percentage mode for easy relative comparison
* Alternative: Switch to absolute values in bottom panel
Percentage view often works better when comparing instruments with different price ranges or volatility.
### Managing Comparisons
* Each compared instrument appears as a colored line
* Hide instruments: Click the eye icon
* Remove instruments: Click the bin icon
* Customization options coming soon:
* Line colors
* Line types
* Additional display settings
### Performance Considerations
* Add as many instruments as needed
* Remove excess comparisons if you notice slowdown
* Consider removing unused comparisons for optimal performance
### Go to date
Instantly navigate to a specific date in the chart's history without manually scrolling back through past price action.
1. Locate the calendar icon on the bottom panel of your chart
2. Click the icon to open the calendar dropdown menu
3. Select your desired month, year, and day
4. The chart instantly snaps to your selected date
## Accessing Drawing Tools
The drawing toolbar appears when you hover your mouse over the chart area. It contains 8 tool categories:
* Measures
* Lines
* Patterns
* Shapes
* Drawings
* Fibonacci
* Text
Plus utility tools: Magnet mode, Hide/Show, Sync, Lock, and Favorite.